
1,471 Photos and videos


The BOLD strategy provides optimal risk-adjusted exposure to #Bitcoin and #Gold as a hedge against monetary inflation.
Learn more about BOLD on our website: bold.report/
7
448
Has gold bottomed?
Gold is down 25% from its peak in January at $5,417.
Having been heavily overbought since that time, it is now oversold and has found support at the $4,000 level, last seen during the October 2025 correction.
#Gold #Investing
2
132
Today is #SpaceX IPO day — and we're selling Seraphim Space (SSIT).
We bought in November 2024 when it traded at a 38% discount to NAV. That discount has since swung to a 22% premium.
"Buy the rumour, sell the news" has rarely felt more apt. 🚀
Read the $SSIT sell note by @AtlasPulse and @WinderKit: bytetree.com/research/2026/0…
1
4
202
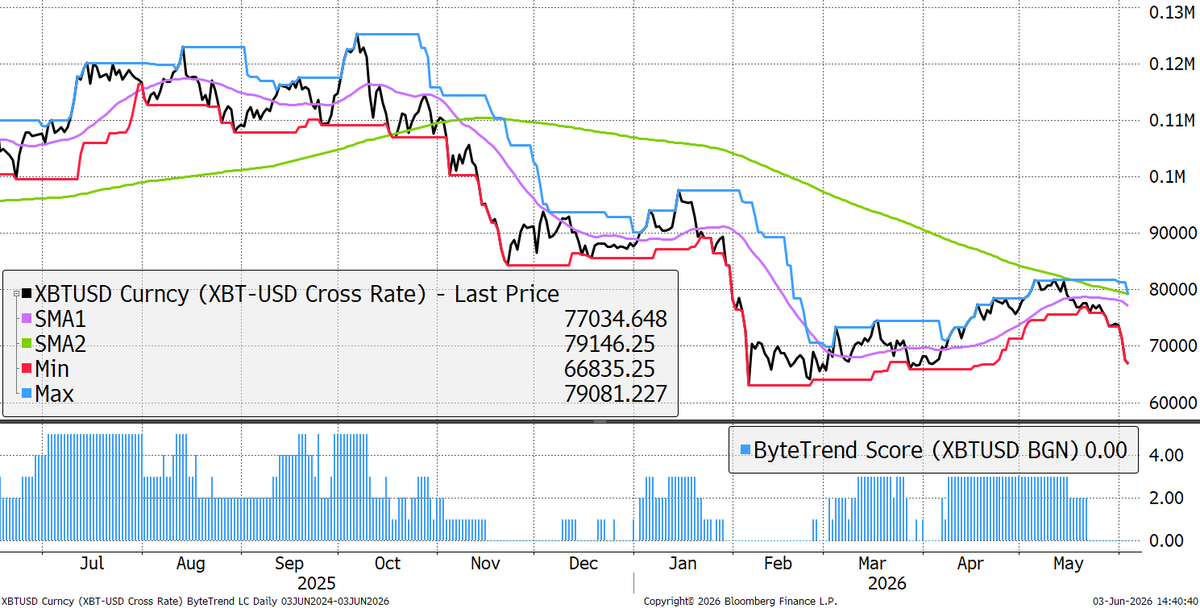
BTC sits at $61k, while crypto breadth is at its most bearish since November 2022.
But under the surface, the regulatory picture is quietly improving, with the FCA, CFTC, and US Congress all moving in the same direction.
More in our latest ByteFolio 👇 bytetree.com/research/2026/0…
1
77
Tomorrow's US #CPI is forecast at 4.2%. Russell Napier's research is clear: when inflation tops 4%, equities struggle — and the pattern goes back decades.
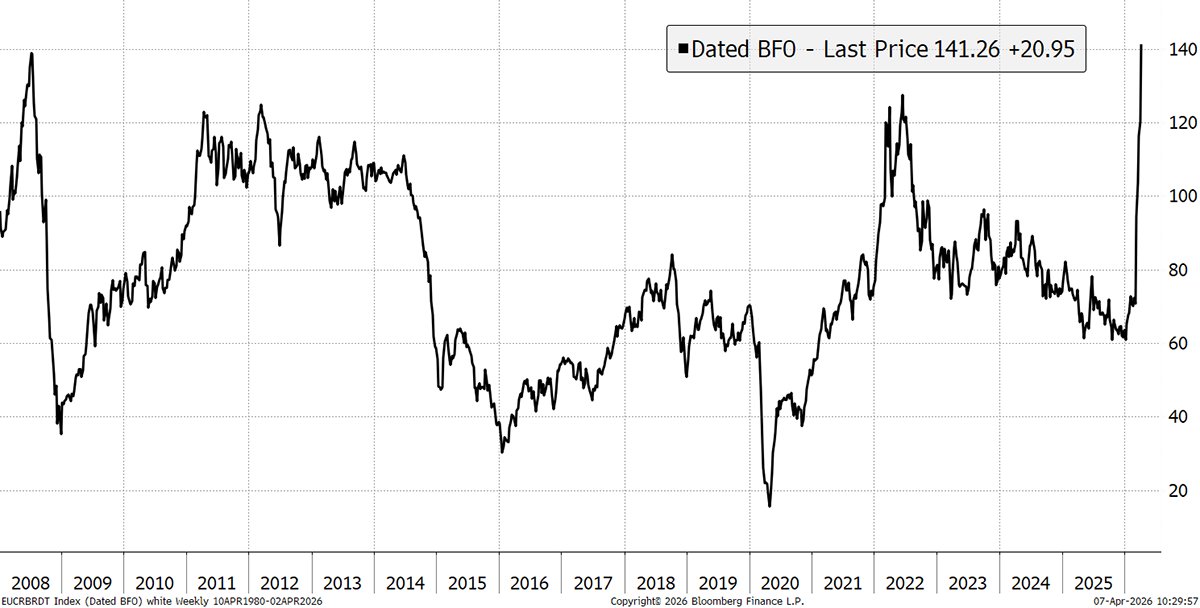
This week, @AtlasPulse looks at what the #oil market, $USD, and the divergence between #quality and high-beta stocks are telling us about where we are in this cycle.
Read The Multi-Asset Investor 👇bytetree.com/research/2026/0…
1
4
357
Korea's $KOSPI is rallying hard — but only 25% of stocks are trading above their 200-day moving averages. Strong index, deteriorating breadth. That gap rarely lasts for long. bytetree.com/research/2026/0…
1
2
134
Last week's selloff wasn't just a tech story — #bonds, #gold, #Bitcoin, and #oil all fell together. The dollar was the common thread.
Nothing stalls a bull market quite like a strong #USD.
Read the full update by @AtlasPulse and @WinderKit for free 👇globaltrends.bytetree.com/th…
2
1
113
ByteTree retweeted

Jun 3
I write a short note on Bitcoin on Wednesdays on @ByteTree . Free to read. With the price down, it's an important week. I looked at the ant-bubble, the quantum threat and the energy spike. Not to forget Saylor. 🧵
1
2
9
839
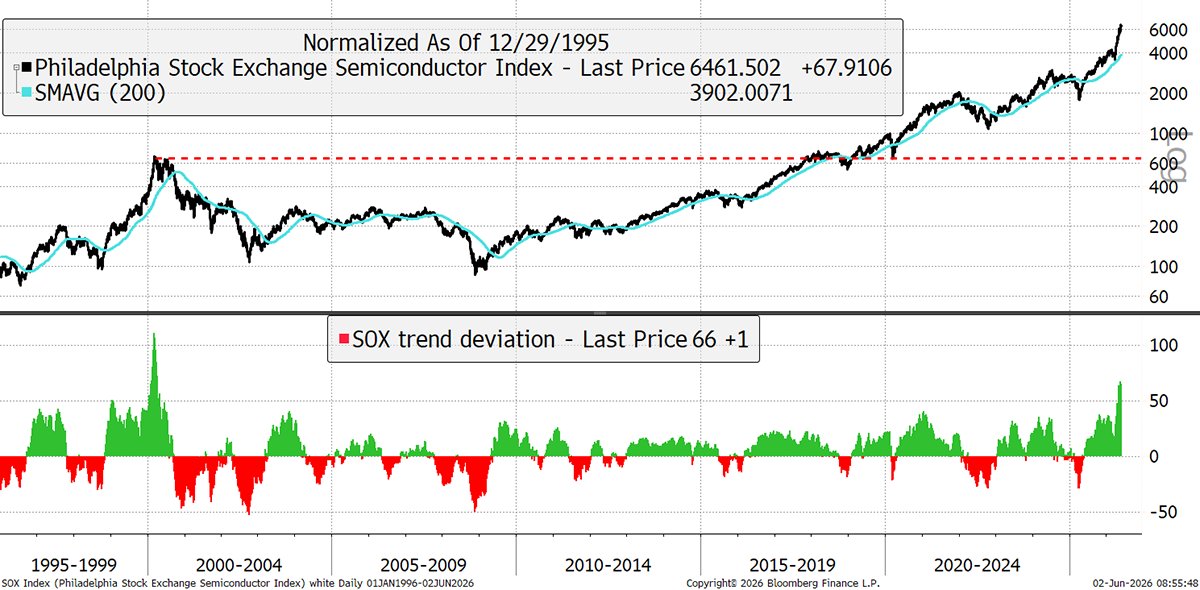
The Philadelphia #Semiconductor Index ($SOX) is currently 65% above its 200-day moving average. For context, #gold only reached 43% at its January peak. At the height of the dot-com #bubble in 2000, the SOX hit over 100% overbought — and the market didn't make a new high until 2017.
What we tend to forget is that capital doesn't appear from nowhere. When one part of the market surges, it often drains the areas left behind. This is what we call the #antibubble. The areas it leaves behind — often value, often defensive — tend to be exactly where the opportunity builds.
Read our latest update of The Multi-Asset Investor by @AtlasPulse: bytetree.com/research/2026/0…
1
3
186
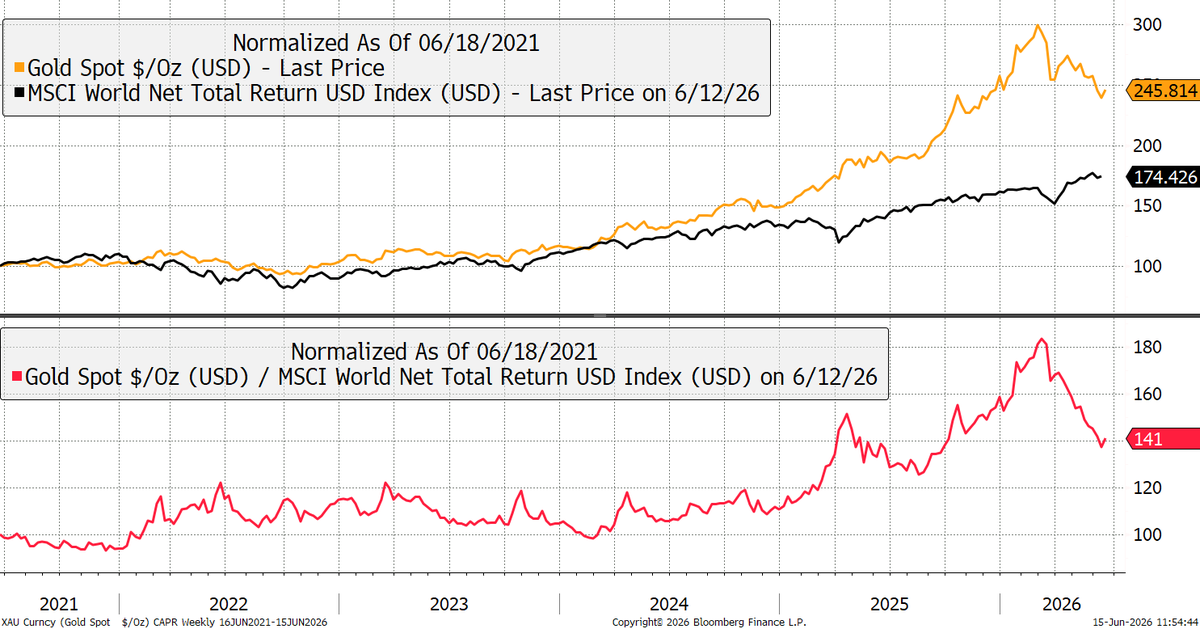
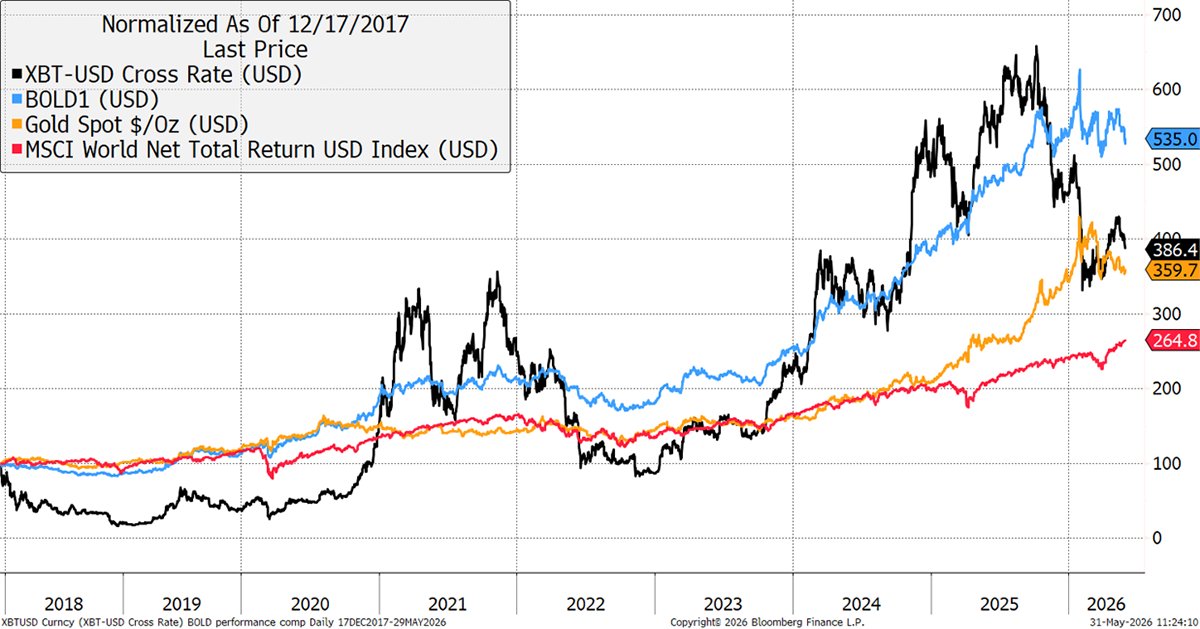
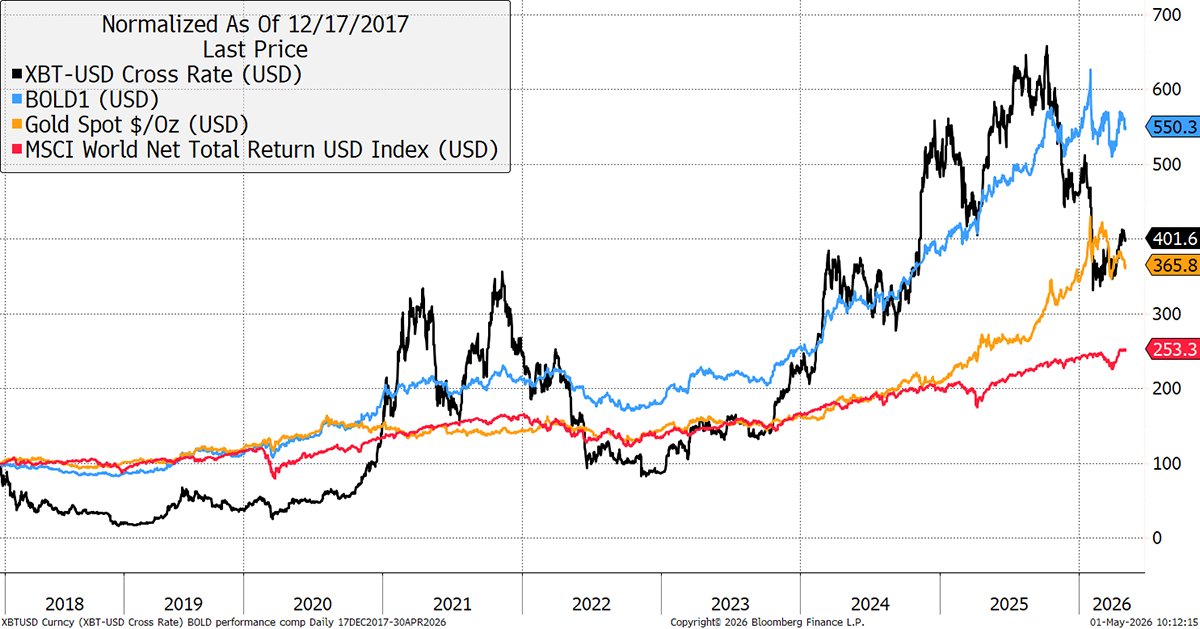
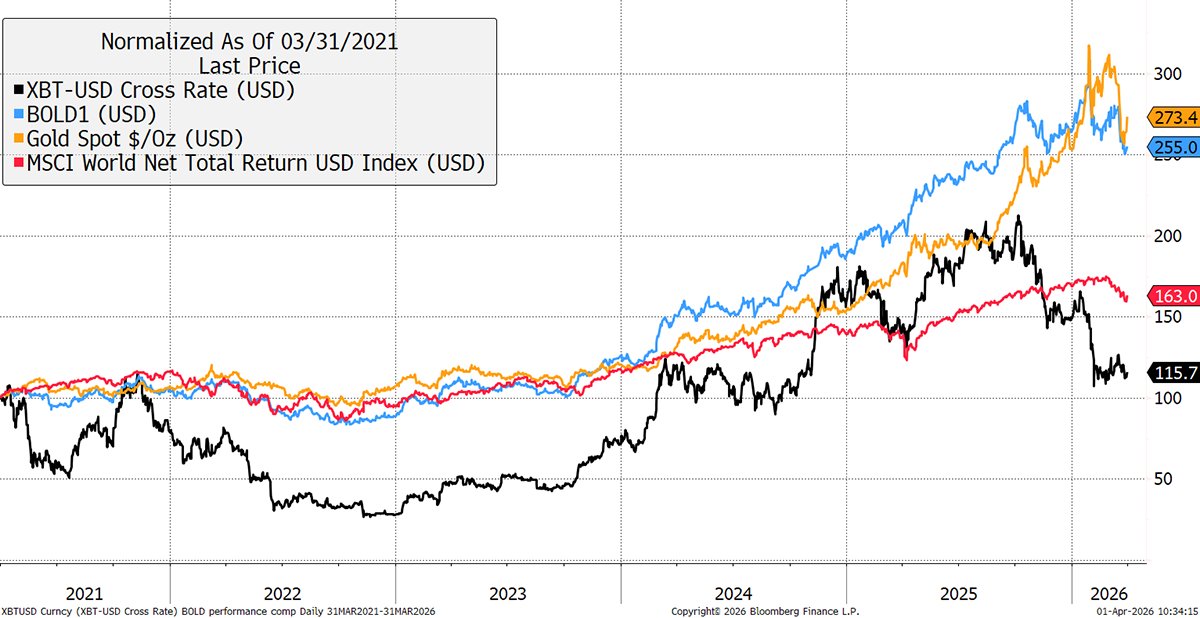
The AI boom is pulling capital away from #Bitcoin and #Gold — but BOLD's long-term story stays compelling.
June rebalancing for $BOLD: 43.2% Bitcoin / 56.8% Gold.
Since Bitcoin's 2017 peak, BOLD has returned 435% vs 286% for BTC alone.
Read our latest monthly update on BOLD by @AtlasPulse, for free: bytetree.com/research/2026/0…
In partnership with @21shares and @KaikoData.
1
104
Post-pandemic, major sportswear brands have had a rough few years. #Nike's struggles are the headline, but the weakness has been broad.
That's starting to change. #Asics is leading the charge, #adidas is winning the advertising battle, Nike's turnaround is showing promise under a new insider-CEO, #Puma's decline is abating, and #JDSports is following suit.
Green shoots across the board — and a #WorldCup summer to boot.
In the latest Venture update, Charlie and Kit have picked their favourite stock to capture the opportunity. 👇 bytetree.com/research/2026/0…
1
2
332
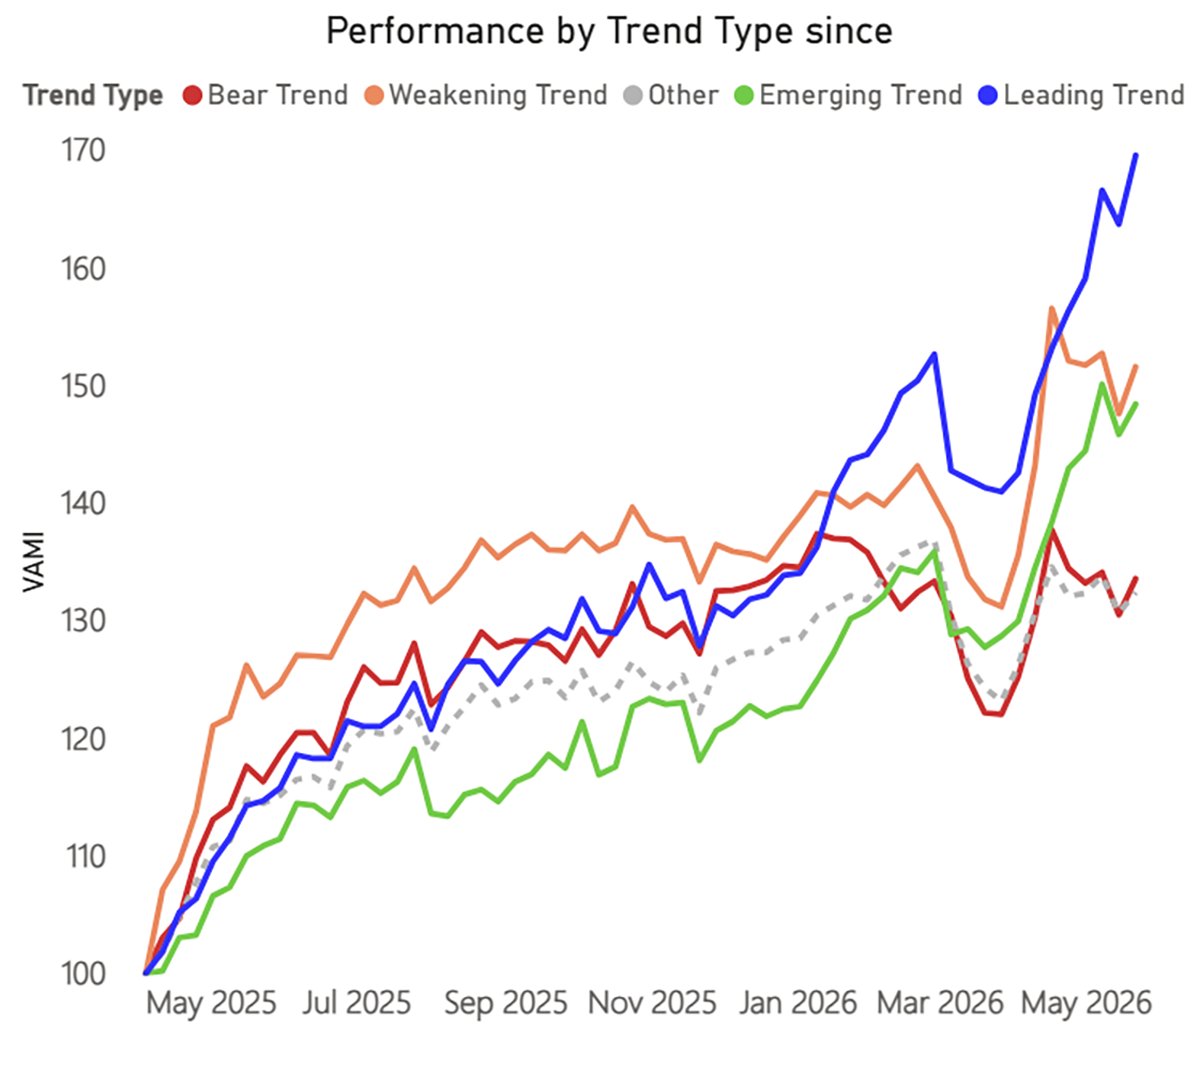
The #semiconductor index is 65% above its 200-day moving average. Everything else? Mostly slack.
This week's Global Trends Investor maps the divergence: only #Technology Hardware is truly leading globally, while most sectors, regions, and industries sit in the slow lane.
Notably, the last time the $SOX ran this hot was 2000. It took 17 years to make the next new high.
The Global Trends Investor is our free weekly trend-following letter tracking global #momentum across the world's 200 largest stocks.
Read this week's issue by @AtlasPulse and @WinderKit: globaltrends.bytetree.com/fl…
2
102
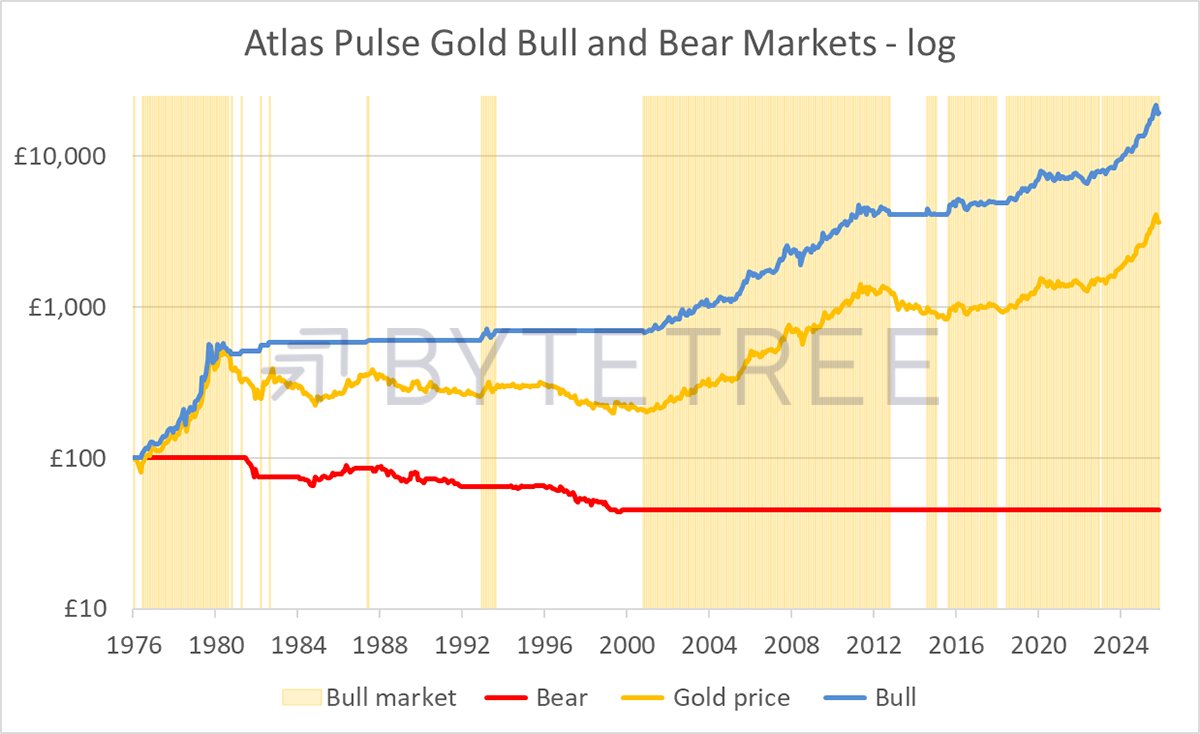
Gold is soft, and the short-term picture isn't good. But bigger picture, the correction sits within a medium- and long-term uptrend.
What's more, we've been here before - 1974, 1980, 2011 - with 3 very different outcomes.
In our latest free update, @AtlasPulse takes a technical look at the #goldprice - read it in full👇
bytetree.com/research/2026/0…
1
948
In two weeks, the largest IPO in history goes live. #SpaceX is targeting a $1.75tn valuation on $18.7bn of sales — it's loss-making, but growing fast, and Musk retains full control regardless of shareholders.
But the real story is what Nasdaq did to get the listing.
@AtlasPulse explains 👇bytetree.com/research/2026/0…
1
267
Hardware or Nowhere.
Tech hardware is dominating global stock trends right now — but strip it out, and the picture gets a lot murkier, especially in Asia.
This week's GTI 200 looks at what Toyota's earnings tell us about tariff reality, and why a market retesting all-time highs can still feel very thin.
The full analysis by @AtlasPulse and @WinderKit is free to read: globaltrends.bytetree.com/ha…
Sign up for our free mailing list for weekly updates.
1
2
119
There is a particular kind of quality business we like.
It’s one that owns an irreplaceable physical asset and uses it to generate healthy cash flows on long-term contracts, with a built-in ability to pass through inflation. Examples include things like railways, airports, pipelines, royalty companies, motorway concessions, and more.
Today’s note recommends such a company, and it’s one that has reached a powerful inflection point.
Full write-up by @AtlasPulse and @WinderKit on our website👇 bytetree.com/research/2026/0…
1
100
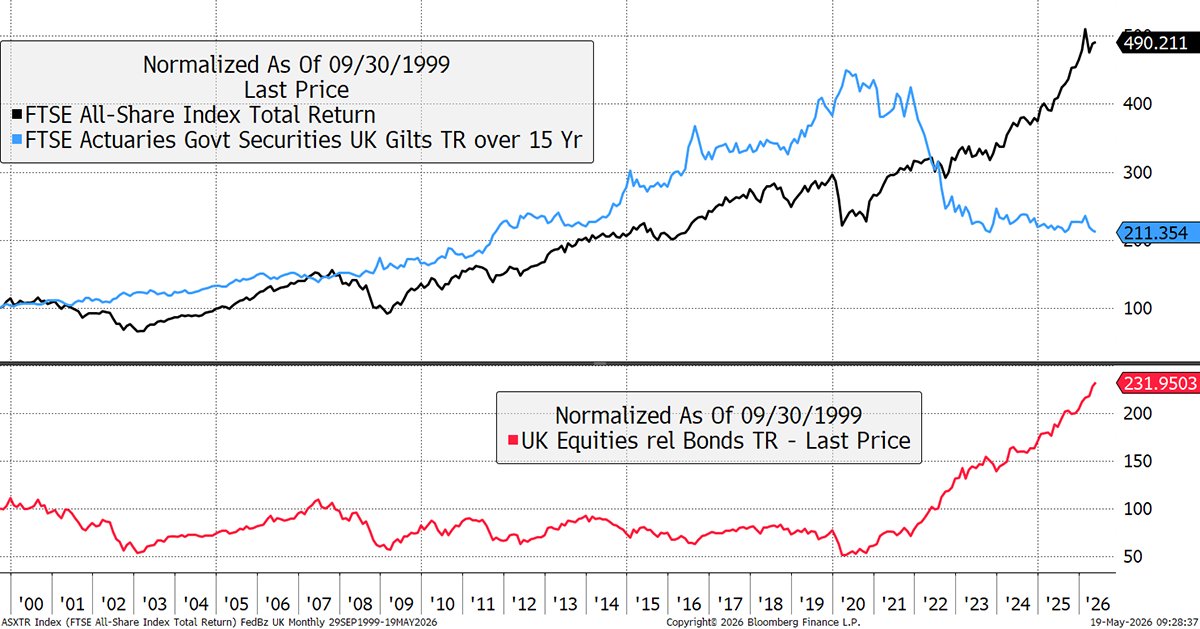
The recent outperformance of #UKequities over #bonds is truly staggering — the divergence hasn’t been this wide in decades.
As inflation pressures build in this #commoditybull market, #bondyields continue making new highs. We are now back in a world where gilts yield more than equities — something investors haven’t experienced since before 2008.
So far, equities have remained resilient. But how much longer can that last?
Read our latest edition of The Multi-Asset Investor:
bytetree.com/research/2026/0…
📈UK Equities vs Gilts - Total Return since 1999 (inc. dividends)
1
1
118
We are delighted TO ANNOUNCE that @ajbell now trades $BOLD - visit BOLDETF.com for more information about BOLD.
May 13

Delighted that @ajbell are now trading Bitcoin and Ethereum ETPs. Best of all, BOLD too.
1
124
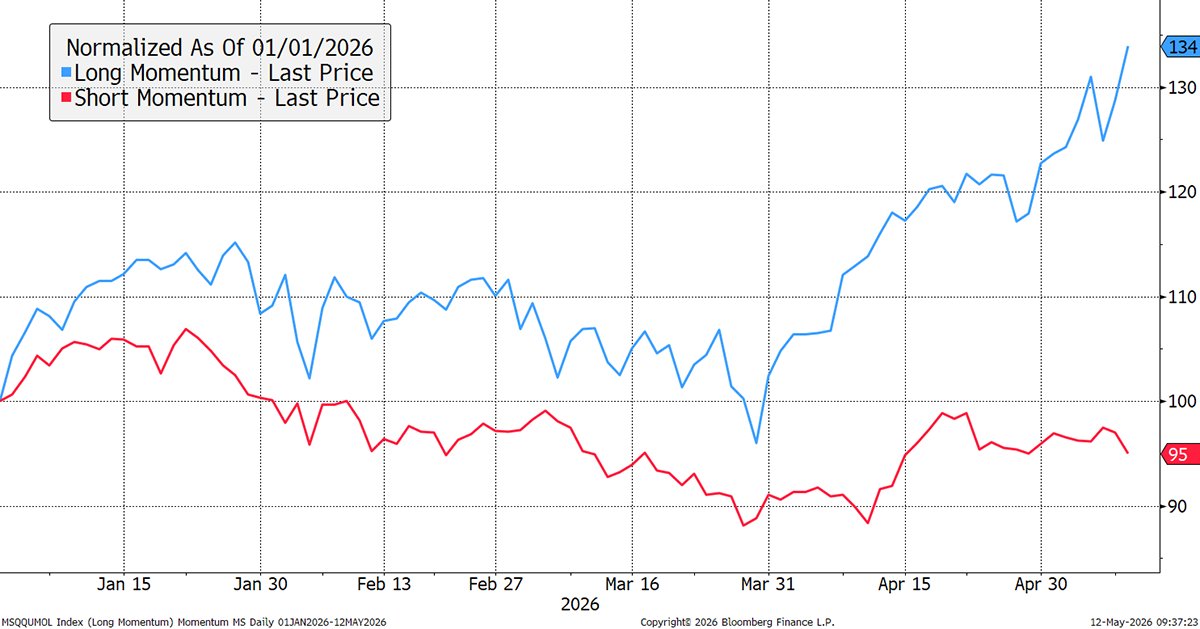
The 1999 chart we'd hoped never to see again is back. The spread between US #momentum winners and losers has reached 39% — a reading only matched in 2000 and 2008, and you know how both of those ended.
Exhibit A is #Intel, whose sales are still struggling but whose stock has risen sixfold on the back of a Trump-era state cash injection, taking its price-to-sales ratio back to #dotcom-bubble territory.
Meanwhile, global equities have just hit a new all-time high relative to world GDP. The oxygen gets thinner up here, and the rally is being carried by an ever-narrower group of names insulated from a cost-of-living crisis that is grinding everything else down.
What options do investors have from here? Read our latest update, "Bubble Alert": bytetree.com/research/2026/0…
📈US Momentum – Past Winners vs Past Losers – 2026 YTD
2
257
In our latest Quality Portfolio recommendation, we examine a business built around disciplined capital allocation, resilient cash generation, and long-term compounding through multiple market cycles.
The company has recently experienced one of its weakest periods of relative performance in many years, despite the underlying business continuing to strengthen.
Such disconnects rarely last forever.
The full investment case by @AtlasPulse and @WinderKit is available to subscribers: bytetree.com/research/2026/0…
1
1
109