
A new platform for data-driven stock analysis for global investors.
Joined April 2026
- Tweets 196
- Following 46
- Followers 8
- Likes 0
194 Photos and videos


Jun 14
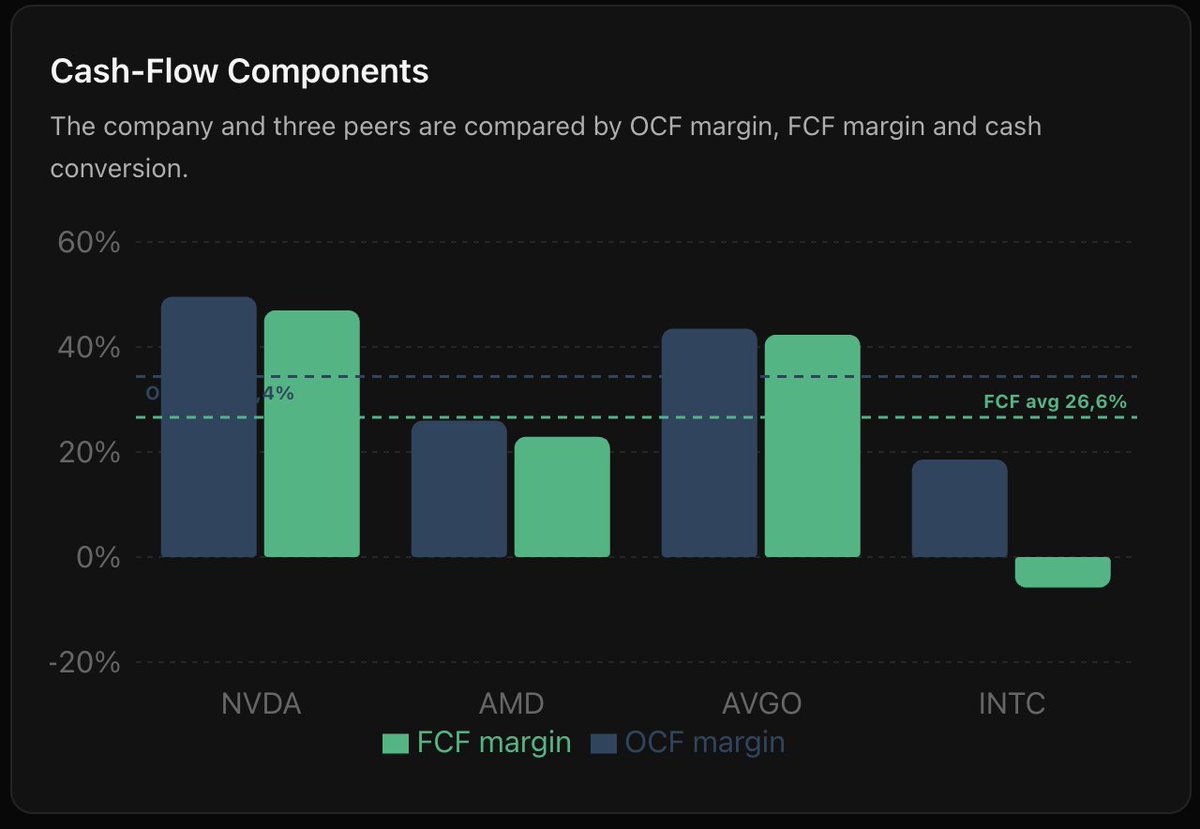
$NVDA is printing cash at an insane level.
Our latest peer analysis vs $AMD, $AVGO & $INTC shows why $NVDA stands in a league of its own:
Margin domination:
-Gross margin: 74.1%
-Operating margin: 64%
-Net margin: 63%
Cash flow beast mode:
-OCF margin: 49.4%
-FCF margin: ~47% (vs peer average of just 26.6%)
From $253.5B revenue straight down to $159.6B net income — almost nothing leaks out.Meanwhile $AMD and especially $INTC are getting crushed on margins and cash conversion. Here is the full breakdown and advanced analyses: 👇👇👇
datafin.app/en/analyses/flow…
Is $NVDA still the undisputed cash king of semiconductors? Drop your thoughts.
#NVDA #Semiconductors #Stocks #Investing


20
Jun 13
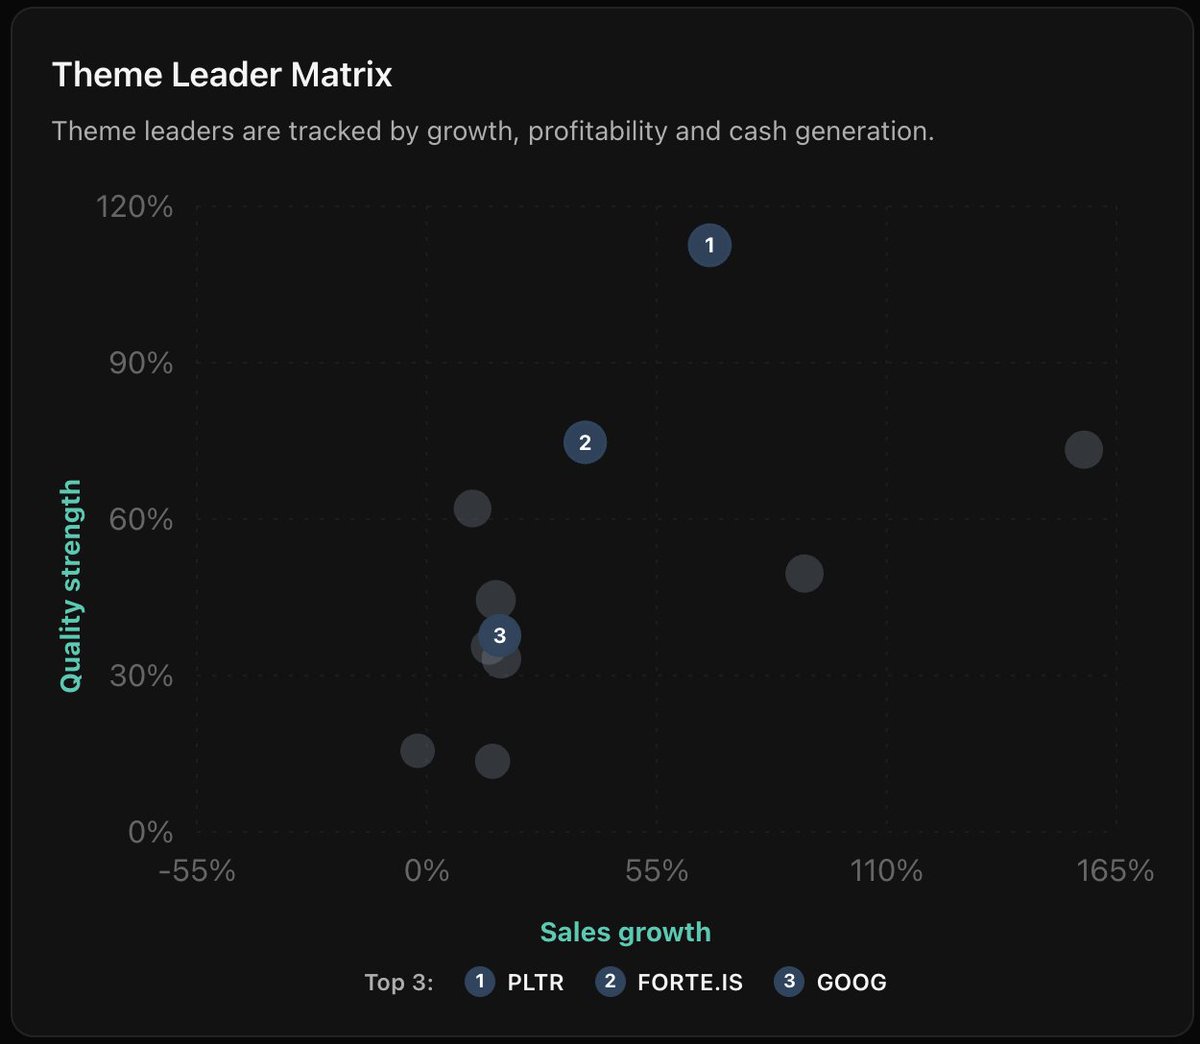
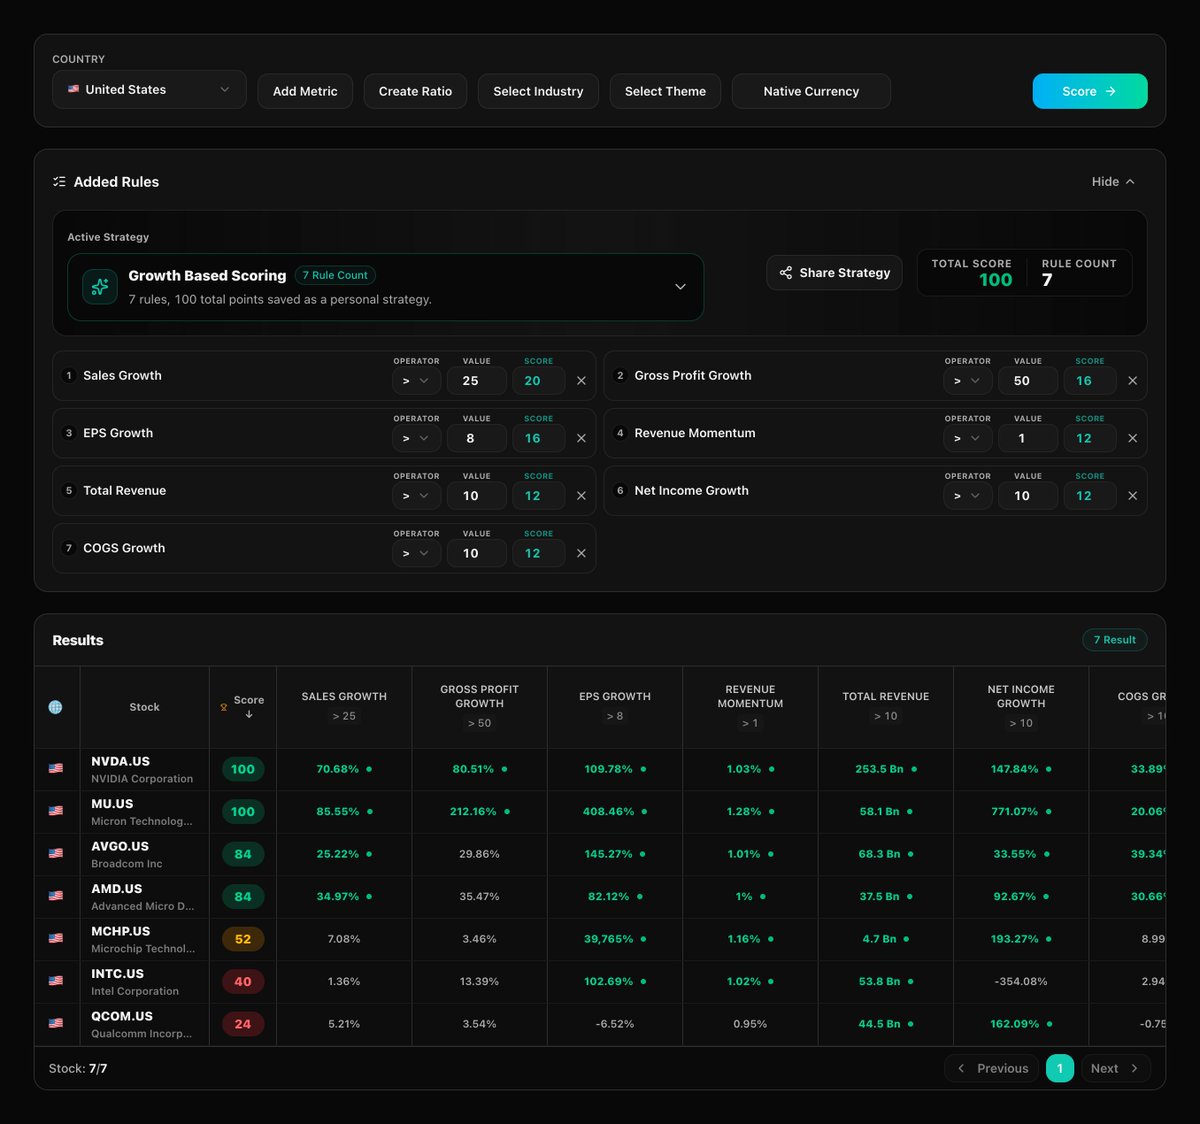
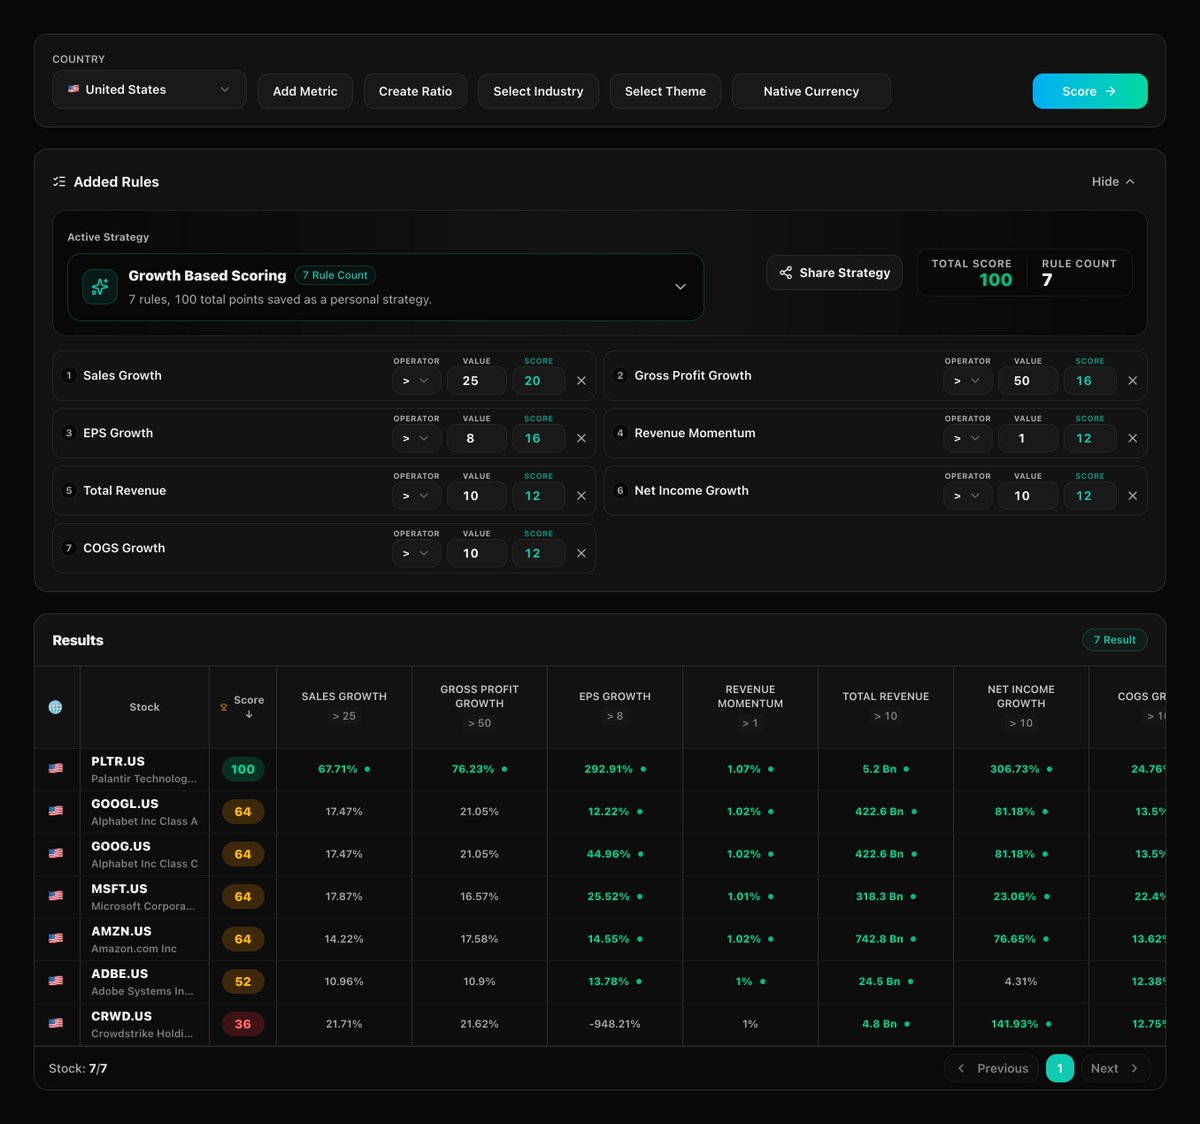
🚀 AI Software Layer is one of the cheapest AI themes right now!
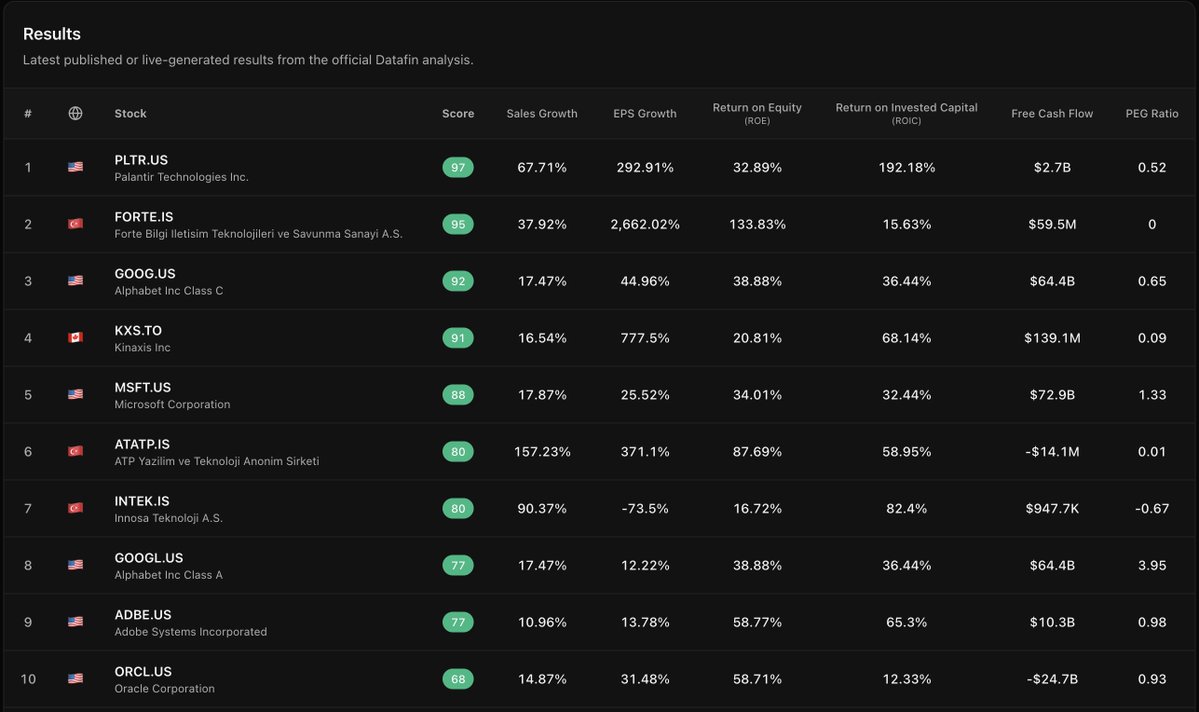
Our latest analysis shows the leaders in growth quality cash generation:
Theme Leader Matrix Top 3:
1⃣ $PLTR - 67.7% Sales Growth | 292.9% EPS Growth | 192% ROIC | $2.7B FCF
2⃣ $FORTE.IS - 37.9% Sales Growth | 2,662% EPS Growth | 133.8% ROE
3⃣ $GOOG - Solid 17.5% Sales Growth strong profitability
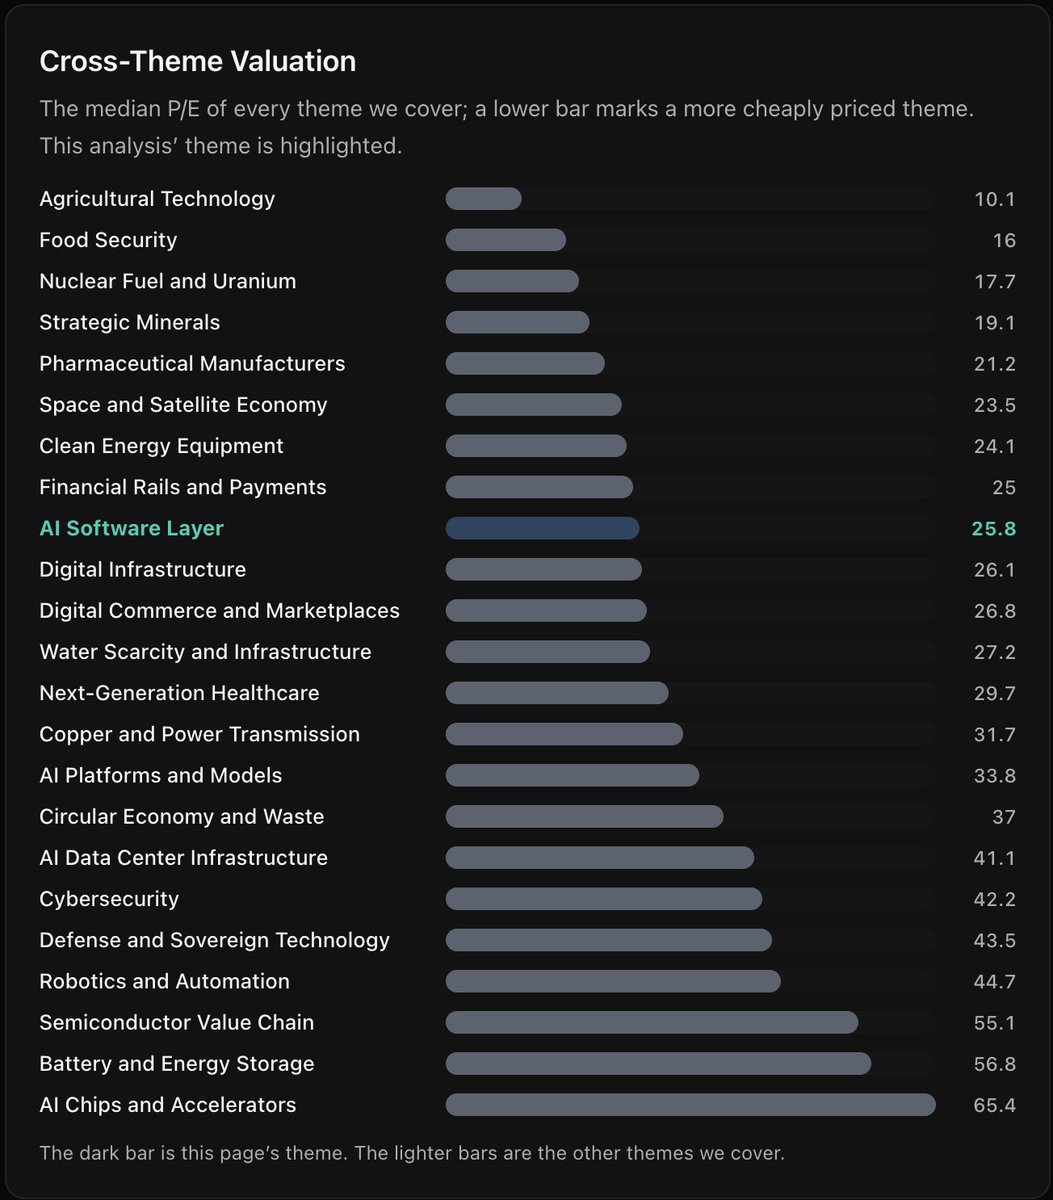
Even better? The AI Software Layer theme sits at a median P/E of just 25.8 — significantly cheaper than hotter AI themes like AI Chips (65.4) or Semiconductors (55.1).
These are high-quality AI software names trading at attractive valuations. Check the full Theme Leader Matrix, Cross-Theme Valuation, and top 10 results below 👇
datafin.app/en/analyses/them…
$MSFT $ADBE $ORCL $KXS.TO
#AI #Stocks #PLTR #TechStocks #Investing
61
Jun 12
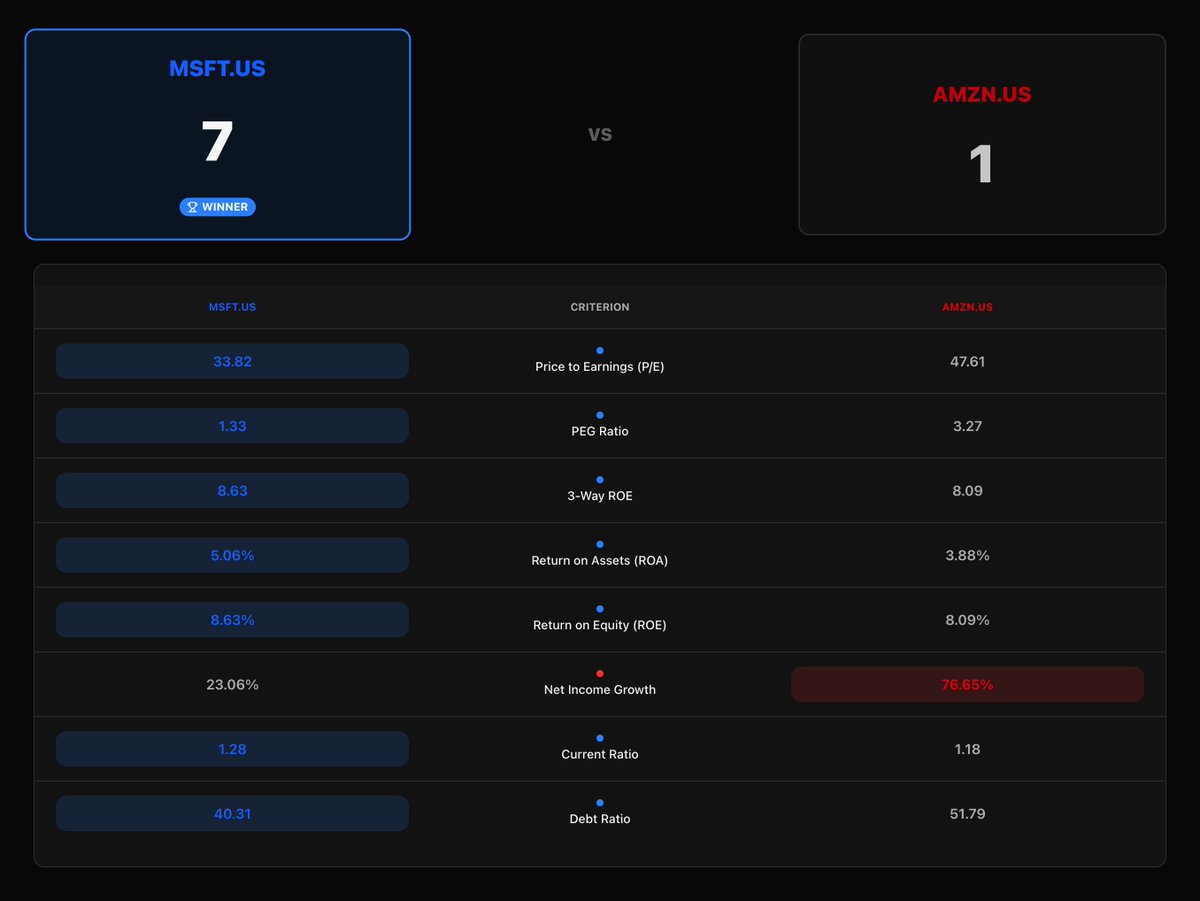
$MSFT vs. $AMZN
Full-scale comparison!
Price-to-Earnings (P/E)
PEG Ratio
3-Way ROE
Return on Assets (ROA)
Return on Equity (ROE)
Net Income Growth
Current Ratio
Debt Ratio
Compare any companies using the metrics of your choice! datafin.app/en/screener/sc_d…
1
40
Jun 12
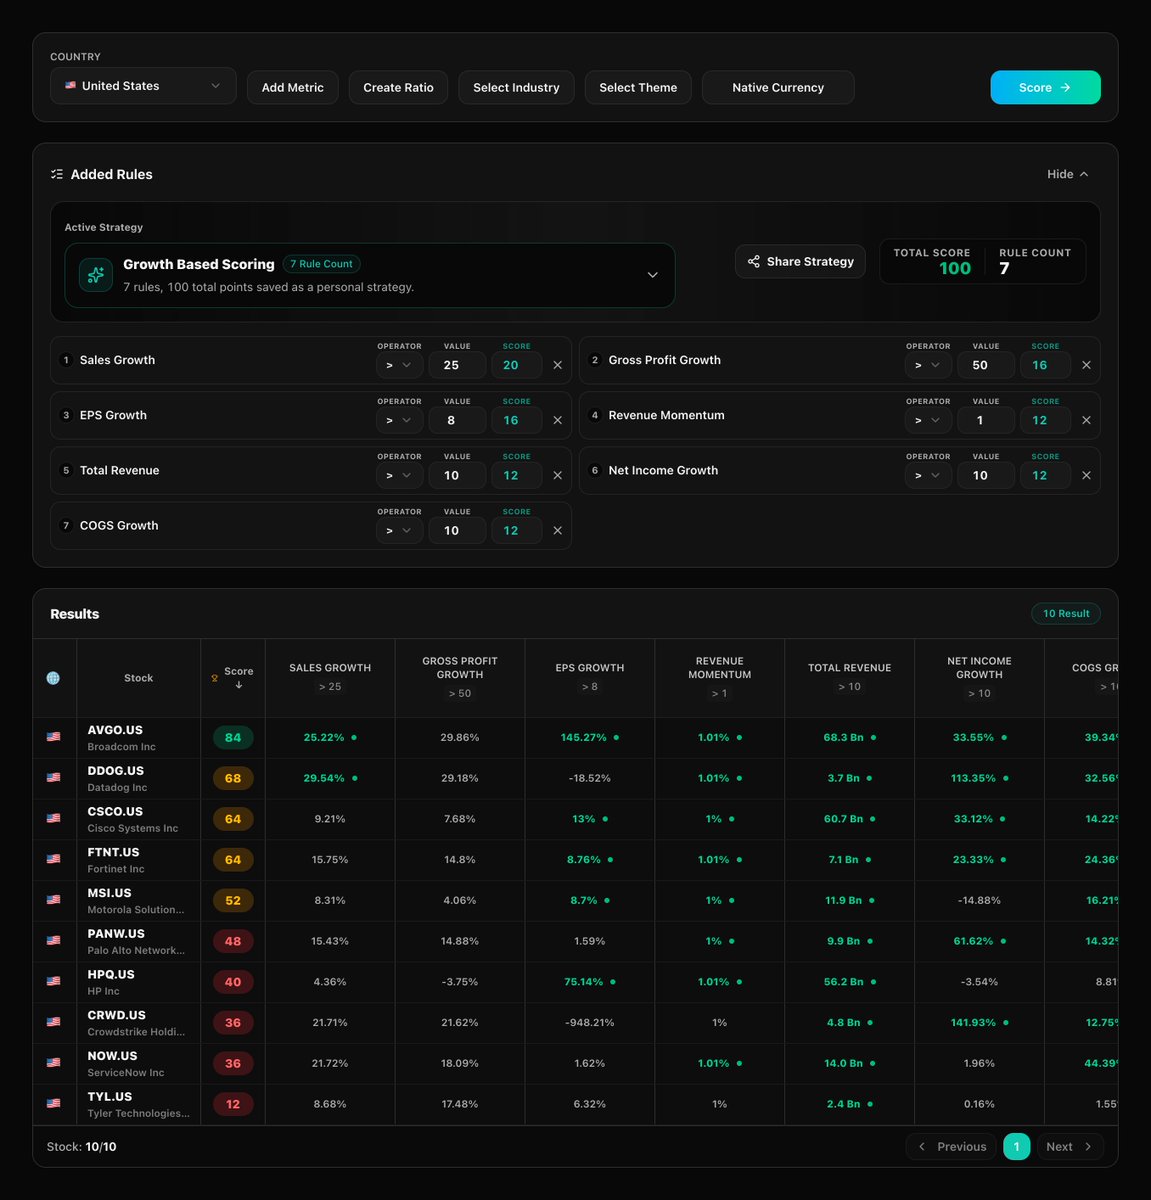
$AVGO $DDOG $CSCO and $FTNT
These companies are those in the Cybersecurity theme that stand out in our growth-based scoring method.
Here is the full breakdown:
datafin.app/en/screener/sc_s…
22
Jun 12
$AAPL vs $MSFT who actually wins?
Our fresh head-to-head just dropped and it’s a perfect 3-3 split with very different strengths:
$AAPL wins big on profitability & cash:
ROE: 141.47% (vs 34.01%)
ROIC: 99.68% (vs 32.44%)
Free Cash Flow: $129.2B (vs $72.9B)
$MSFT wins on growth & valuation:Sales Growth: 17.87% (vs 12.76%)
P/E: 33.82 (vs 44.49)
EV/EBITDA: 15.62 (vs 25.97)
The Factor Profile radar shows it clearly — $MSFT stretches further on growth and cheaper multiples, while $AAPL towers on returns and cash generation. Click to see the full breakdown 👇
datafin.app/en/analyses/duel…
Which side are you on right now — Team $AAPL or Team $MSFT? Drop your pick below 👇
#AAPL #MSFT #TechStocks #StockComparison #Investing

36
Jun 11
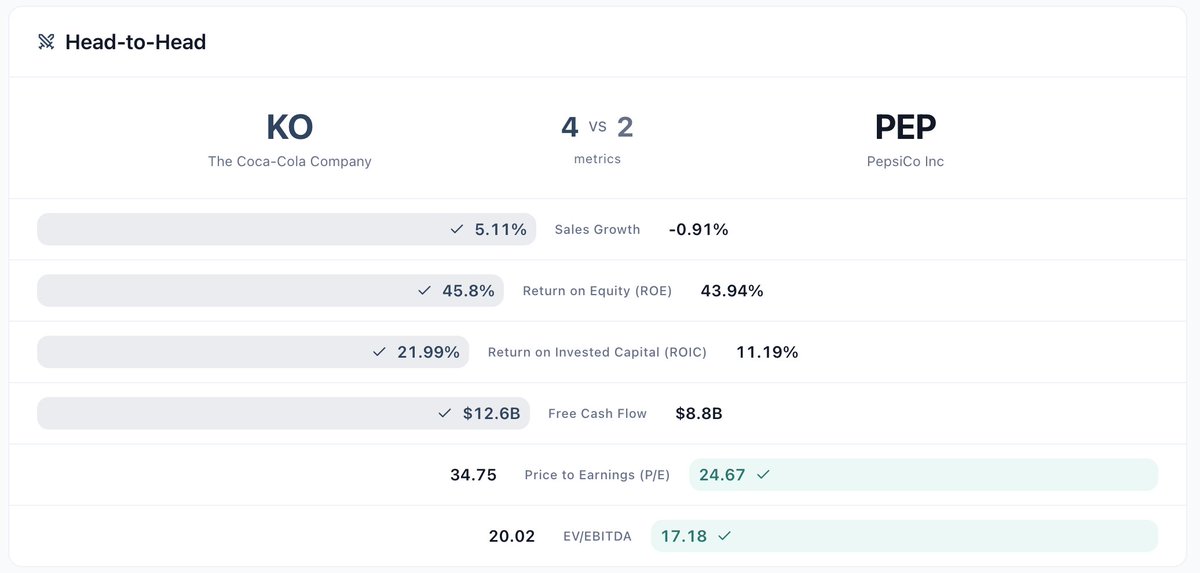
$PEP vs. $KO
Full-scale comparison!
Price-to-Earnings (P/E)
PEG Ratio
3-Way ROE
Return on Assets (ROA)
Return on Equity (ROE)
Net Income Growth
Current Ratio
Debt Ratio
Compare any companies using the metrics of your choice! datafin.app/en/screener/sc_d…
21
Jun 11
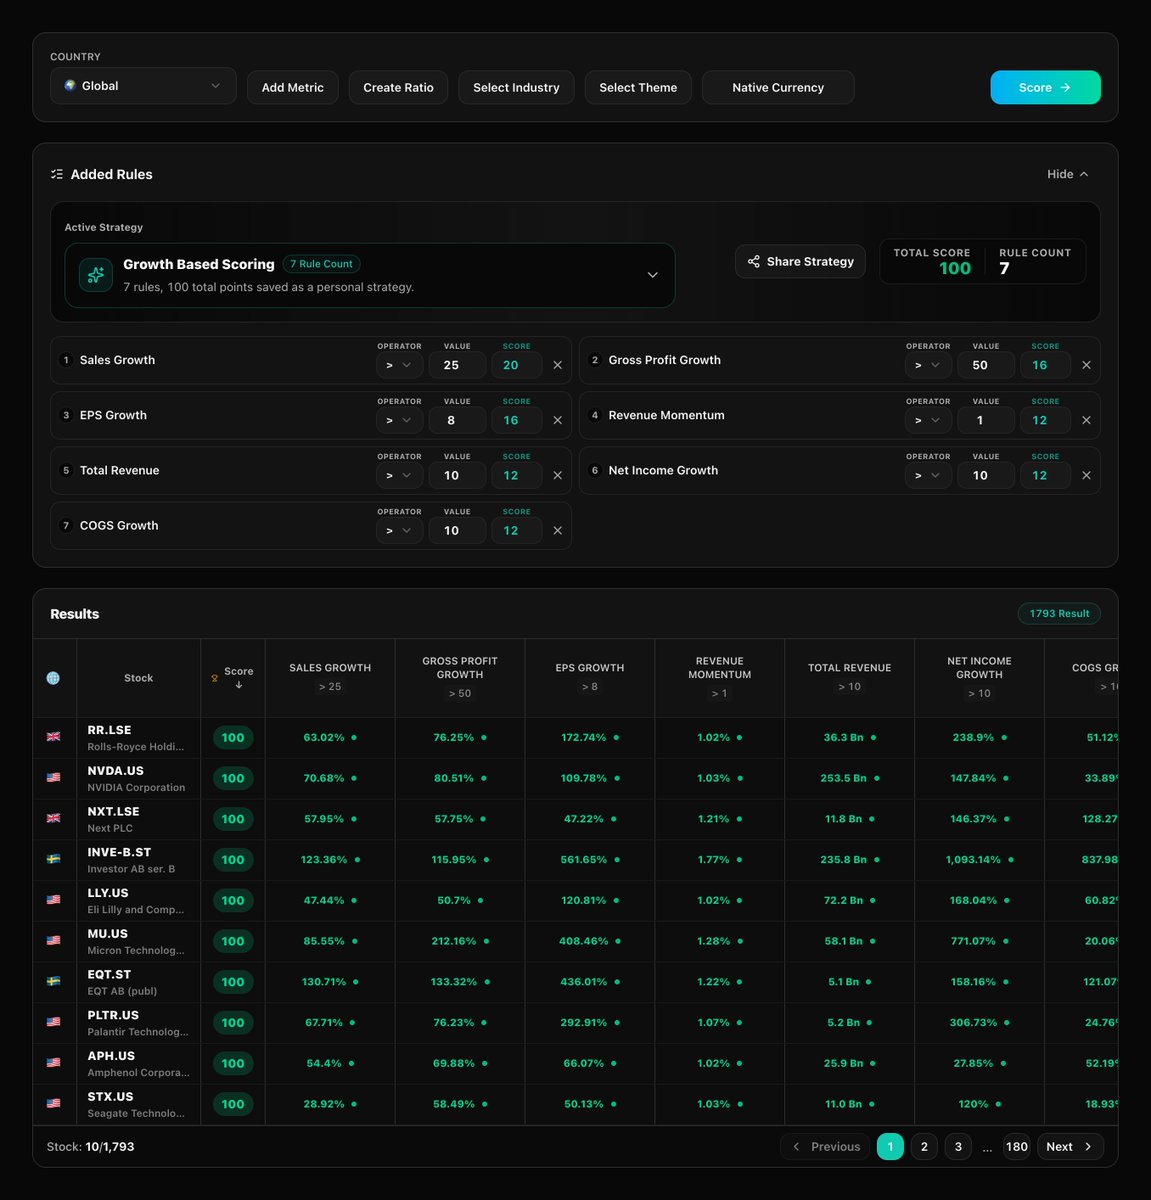
$RR.LSE $NVDA $NXT.LSE and $INVE-B.ST
These companies are those in the Battery and Energy Storage theme that stand out in our growth-based scoring method.
Here is the full breakdown:
datafin.app/en/screener/sc_s…
63
Jun 11
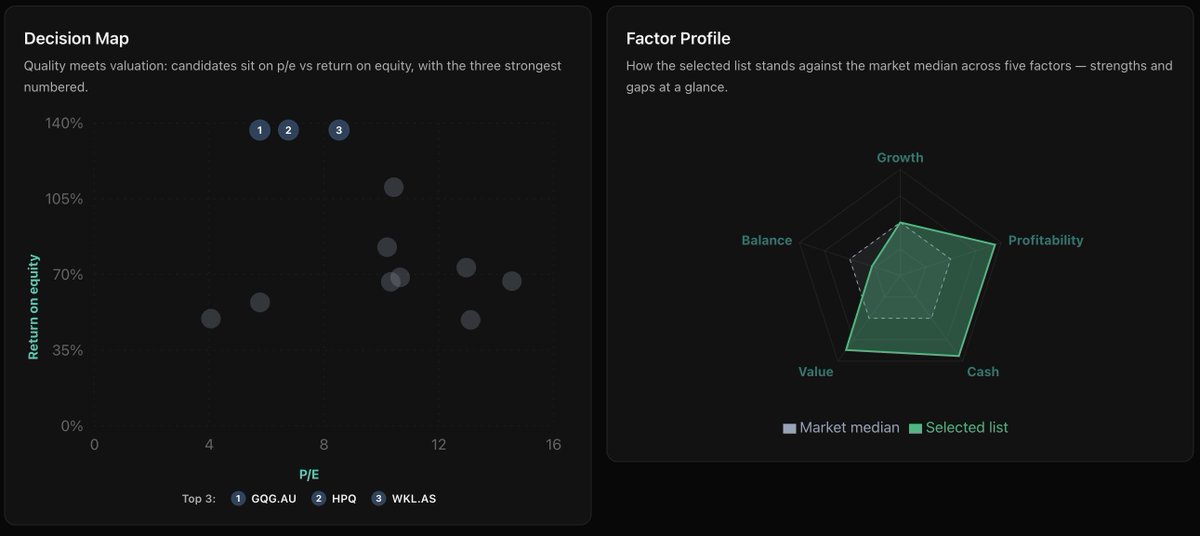
🔥 Quality stocks at insane valuations just dropped!
Our latest Datafin analysis is showing exactly where quality meets value right now. The Decision Map proves it: high Return on Equity low P/E = the sweet spot.
Here are the three strongest right now:
🥇 $GQG.AU – ROE 216.7% | P/E 5.77
🥈 $HPQ – ROE 214.9% | P/E 6.76
🥉 $WKL.AS – ROE 203.8% | P/E 8.53
And the full top 10 list is absolutely dominating the market median across Profitability, Cash Flow, Value & more (see the Factor Profile radar).
Top performers include:
$ATRL.TO (96) • $GQG.AU (95) • $ALL.US (94) • $WKL.AS (94) • $HPQ (93)
These aren’t just high scorers, they’re high-quality compounders trading at bargain prices. Which one are you adding to your watchlist first?
$VNT.AU $LOG.MC $OBM.AU $UNA.AS $AMP.US
Here is the full breakdown: 👇
datafin.app/en/analyses/scre…
#Stocks #Investing #StockMarket #ValueStocks #QualityStocks
10
Jun 10
$DIS vs. $NFLX
Full-scale comparison!
Price-to-Earnings (P/E)
PEG Ratio
3-Way ROE
Return on Assets (ROA)
Return on Equity (ROE)
Net Income Growth
Current Ratio
Debt Ratio
Compare any companies using the metrics of your choice! datafin.app/en/screener/sc_d…
9
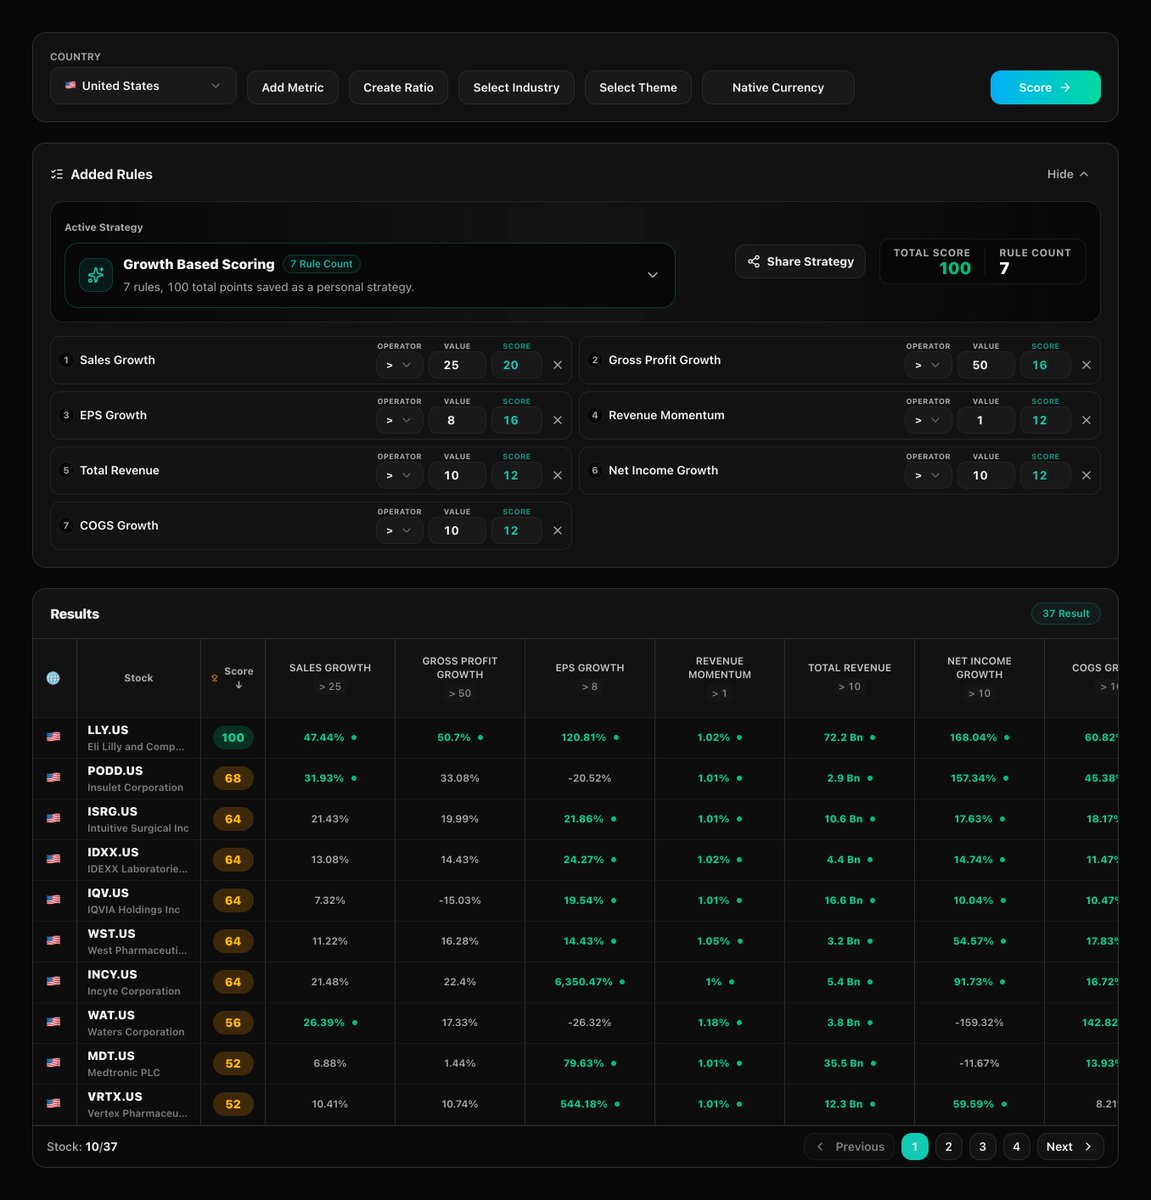
Jun 10
$LLY $PODD $ISRG and $IDXX
These companies are those in the Next Generation Healthcare theme that stand out in our growth-based scoring method.
Here is the full breakdown:
datafin.app/en/screener/sc_s…
10
Jun 9
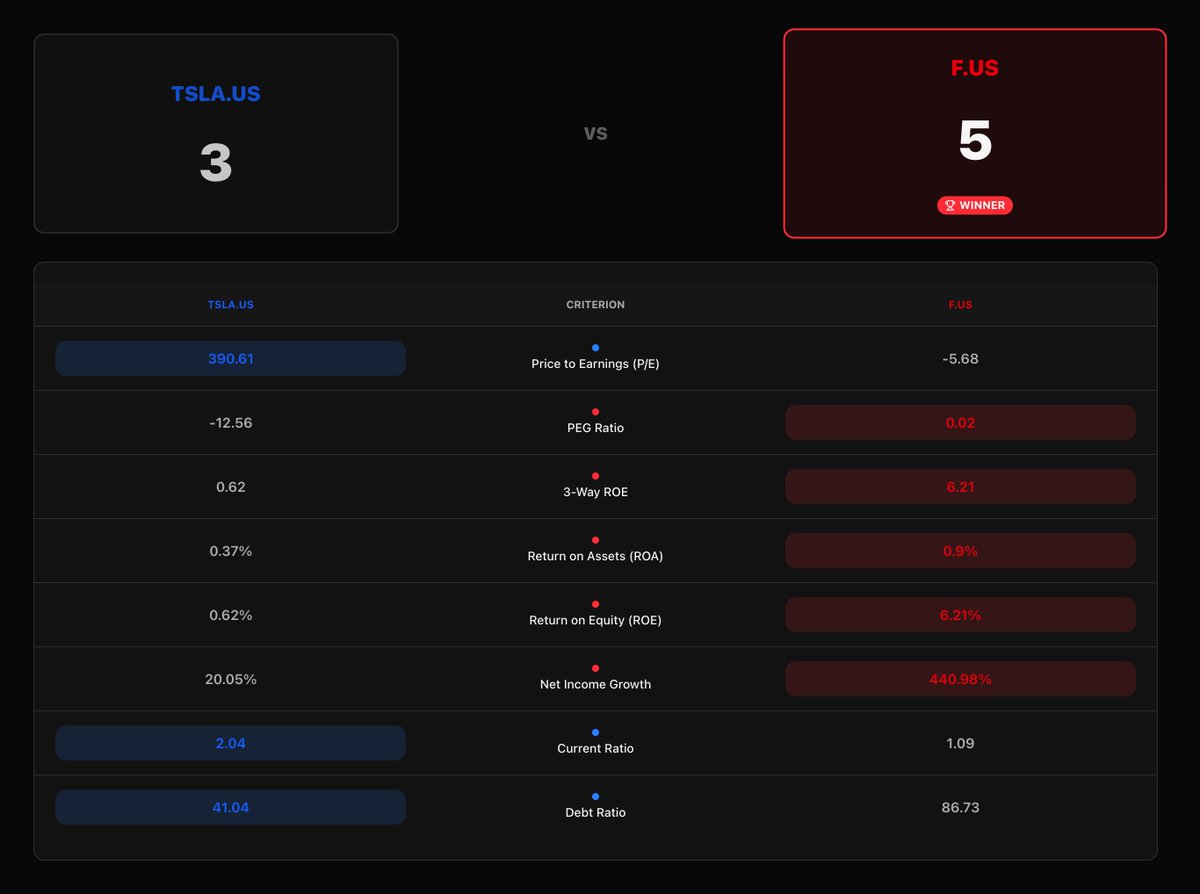
$TSLA vs. $F
Full-scale comparison!
Price-to-Earnings (P/E)
PEG Ratio
3-Way ROE
Return on Assets (ROA)
Return on Equity (ROE)
Net Income Growth
Current Ratio
Debt Ratio
Compare any companies using the metrics of your choice! datafin.app/en/screener/sc_d…
4
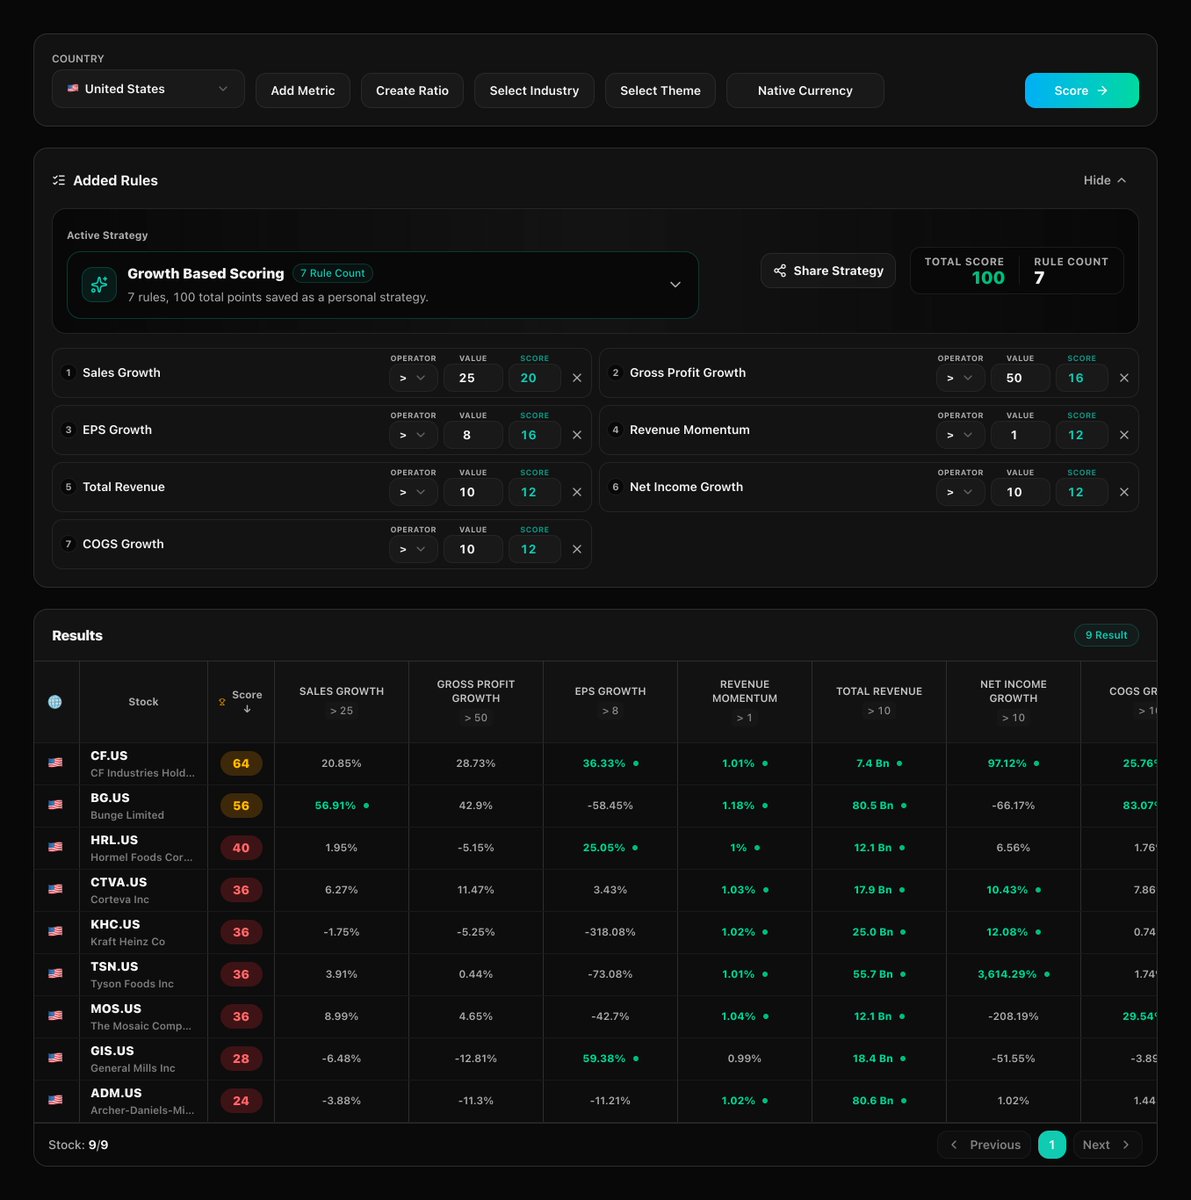
Jun 9
$CF $BG $HRL and $CTVA
These companies are those in the Food Security theme that stand out in our growth-based scoring method.
Here is the full breakdown:
datafin.app/en/screener/sc_s…
6
Jun 8
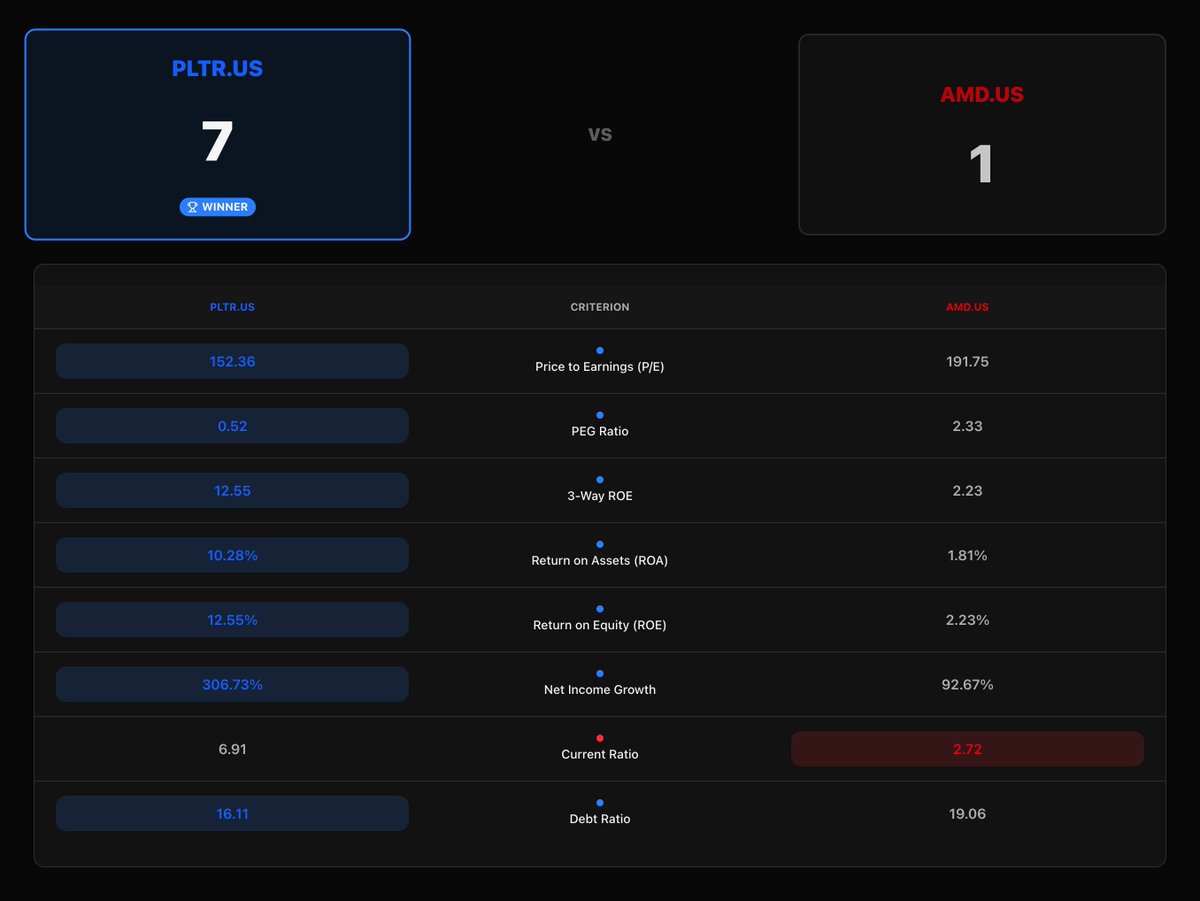
$PLTR vs. $AMD
Full-scale comparison!
Price-to-Earnings (P/E)
PEG Ratio
3-Way ROE
Return on Assets (ROA)
Return on Equity (ROE)
Net Income Growth
Current Ratio
Debt Ratio
Compare any companies using the metrics of your choice! datafin.app/en/screener/sc_d…
7
Jun 8
$NVDA $MU $AVGO and $AMD
These companies are those in the AI Chips and Accelerators theme that stand out in our growth-based scoring method.
Here is the full breakdown:
datafin.app/en/screener/sc_s…
5
Jun 7
$PLTR $GOOGL $GOOG and $MSFT
These companies are those in the robotics and automation theme that stand out in our growth-based scoring method.
Here is the full breakdown:
datafin.app/en/screener/sc_s…
8
Jun 7
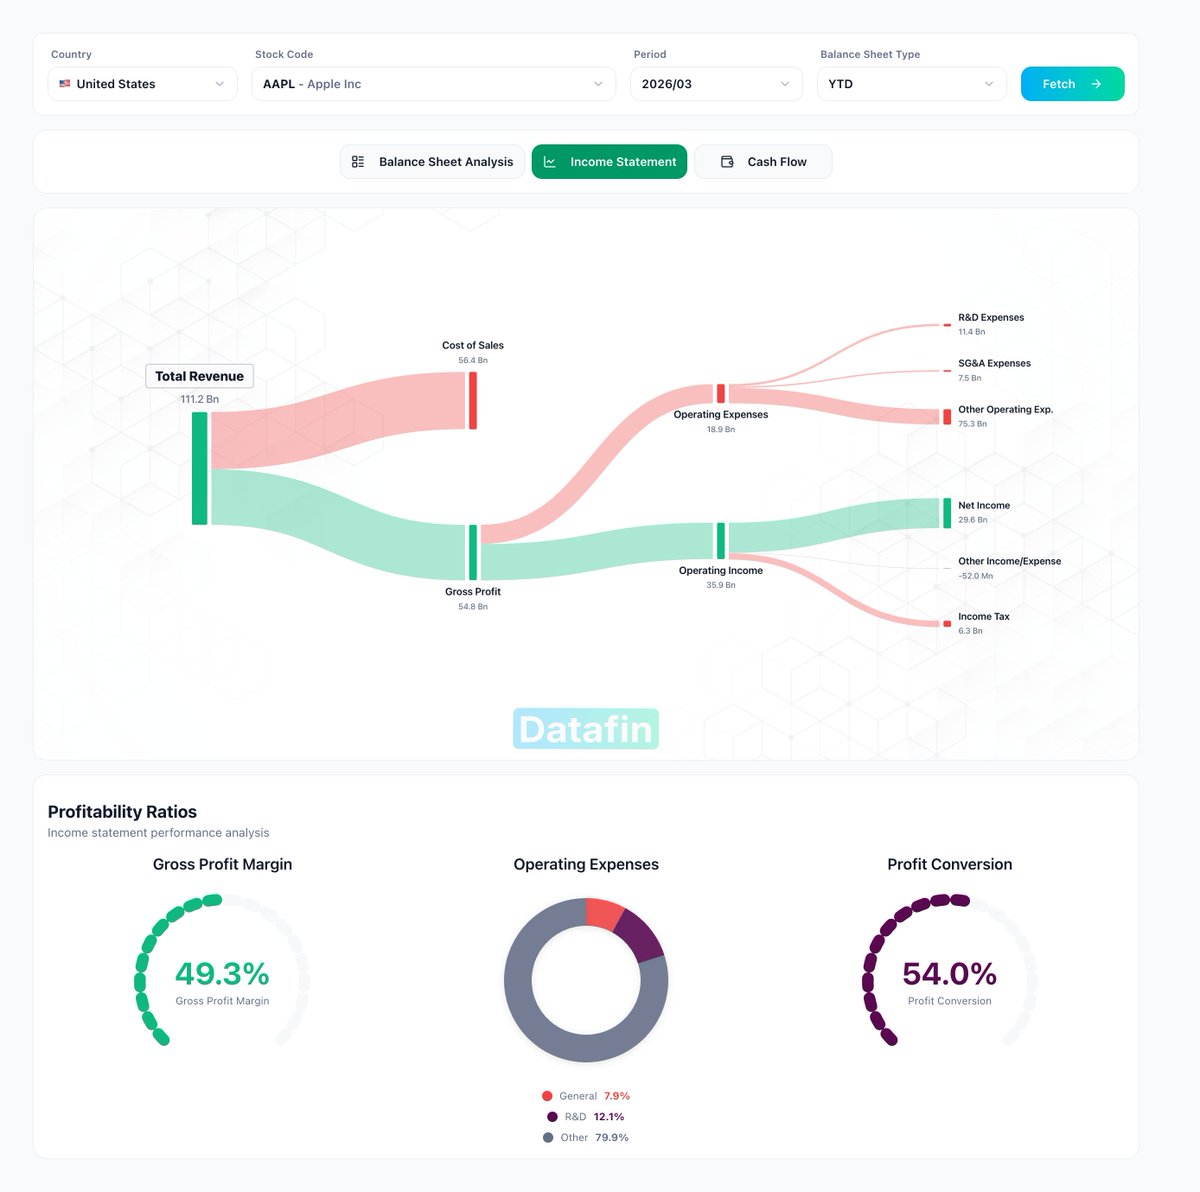
$AAPL - Flow Analysis
$AAPL is a masterclass in hardware monetization. They are maintaining a massive 49.3% gross profit margin on a whopping $111.2 Bn in total revenue.
Even more impressive? A stellar 54.0% profit conversion rate, flowing an incredible $29.6 Bn directly into net income. The ultimate cash machine.
#Fintech
10
Jun 6
Visa and Mastercard look almost identical from far away.
That is exactly why the small differences matter:
growth, ROIC, free cash flow, valuation multiples and scale.
Datafin turns the payment rails debate into a clean head-to-head comparison.

9
Jun 6
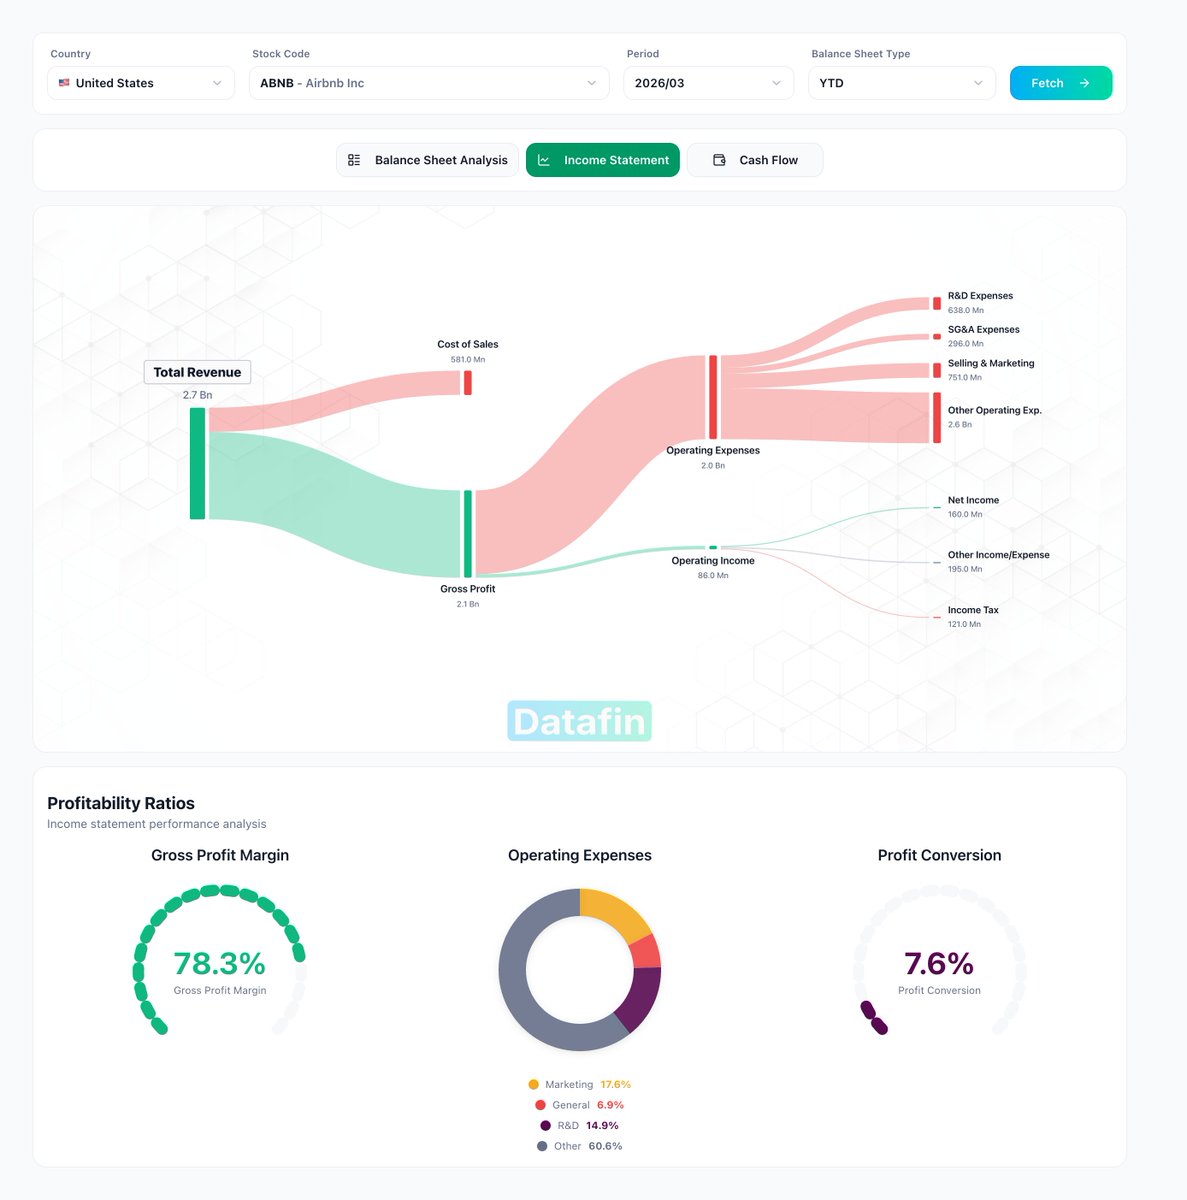
$ABNB - Flow Analysis
$ABNB boasts a phenomenal asset-light model, driving a massive 78.3% gross profit margin.
However, their profit conversion sits at 7.6% due to heavy customer acquisition and marketing spend (17.6%). The core unit economics are incredible, but fixed cost optimization remains the key.
#Wealth
13
Jun 5
Coca-Cola and PepsiCo are both defensive icons.
But the business engines are not the same.
One is a focused beverage-margin machine.
The other is a diversified snacks-and-drinks cash-flow system.
Datafin compares the fundamentals side by side.
7
Jun 5
$WMT - Flow Analysis
The absolute scale of $WMT remains staggering. $190.7 Bn in total revenue for a single period driving $47.0 Bn in gross profit at a 24.7% margin.
While their profit conversion sits at 9.0% ($4.2 Bn net income), the sheer velocity of cash flowing through this retail engine is unmatched.
#Economy

5