
#Datashader is an #OpenSource library for rasterizing large amounts of data into beautiful, accurate images. Datashader is a project of @AnacondaInc. #DataViz
Joined June 2017
- Tweets 366
- Following 545
- Followers 4,446
- Likes 447
37 Photos and videos


Pinned Tweet

28 Jun 2017
LOVE this! @Instacart delivery visualizations using #datashader from @jeremystan: bit.ly/2tkdHNY #OpenSource #DataViz #Instacart
1
25
65
Datashader retweeted

11 Aug 2023
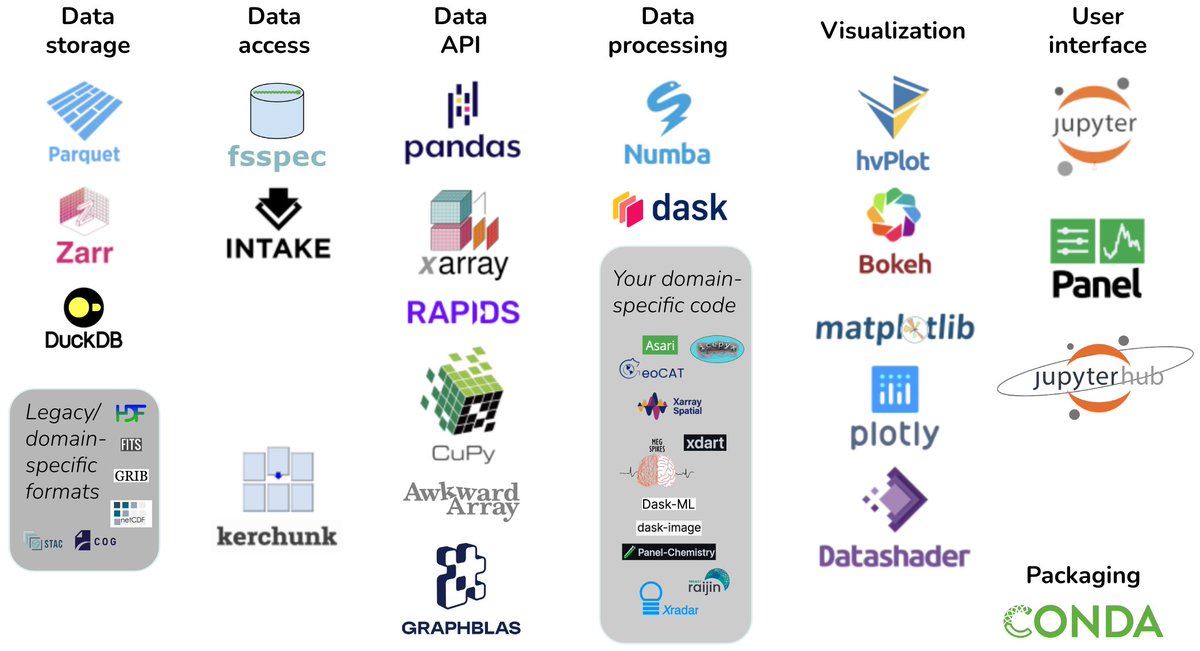
We’re excited to announce our support for Pandata, the scalable open-source analysis stack 🎉 🐍 🌐
Pandata offers a set of general-purpose & powerful open-source data analytics tools enabling scalable data processing for any domain.
Read more here 👇
bit.ly/45q2sFi
2
25
119
25,439
Datashader retweeted

18 Nov 2022
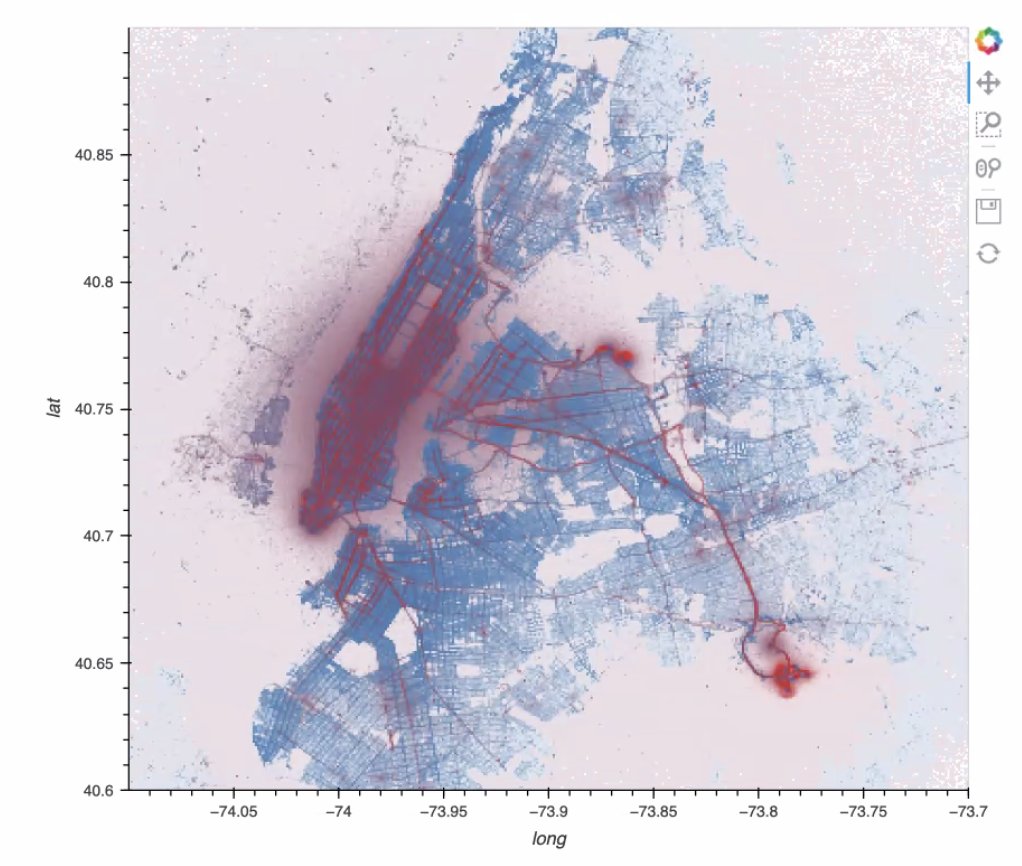
1 billion points of NYC taxi data, interactively visualized with @datashader
2
8
45
Datashader retweeted

21 Sep 2023
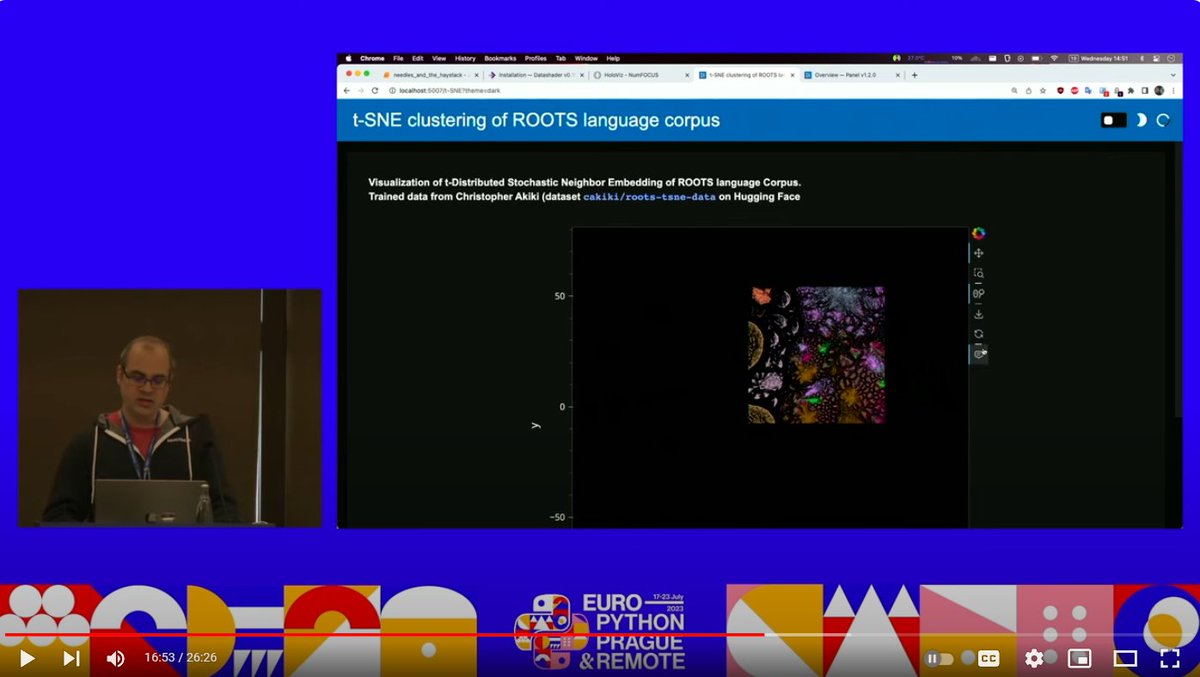
📢Videos from @europython are out.
💁♀️If you are interested in big data visualization and data apps check out Jean-Luc Stevens talk
🧵👇 Link below
#python #dataviz #datascience @datashader
1
4
8
1,631
Datashader retweeted

5 Jun 2023
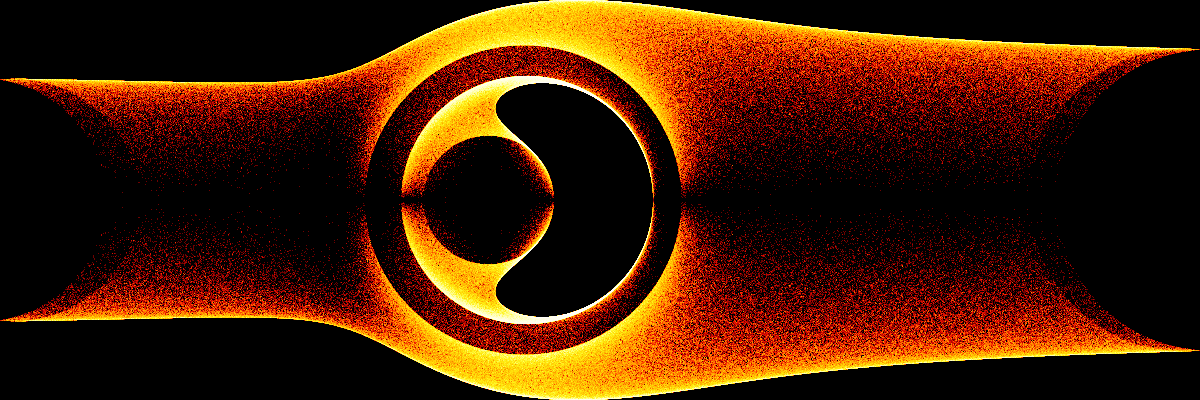
Code Dataset Visualization—11.66 million files from the Stack, a @BigCodeProject dataset sourced from permissively-licensed @github repositories spanning 86 programming languages (StarCoder languages subset).
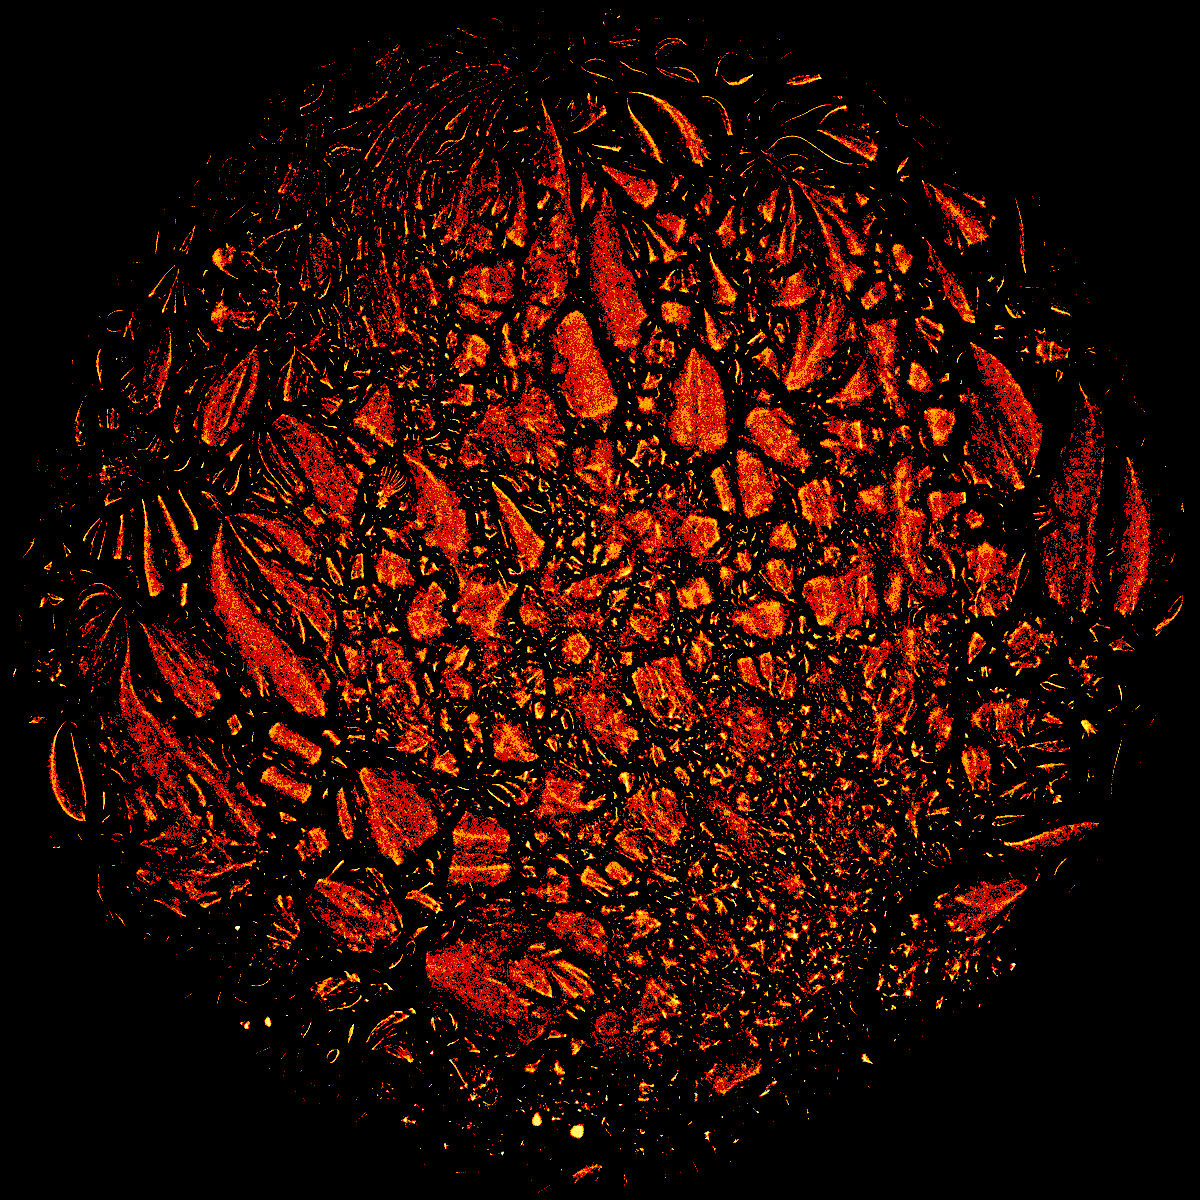
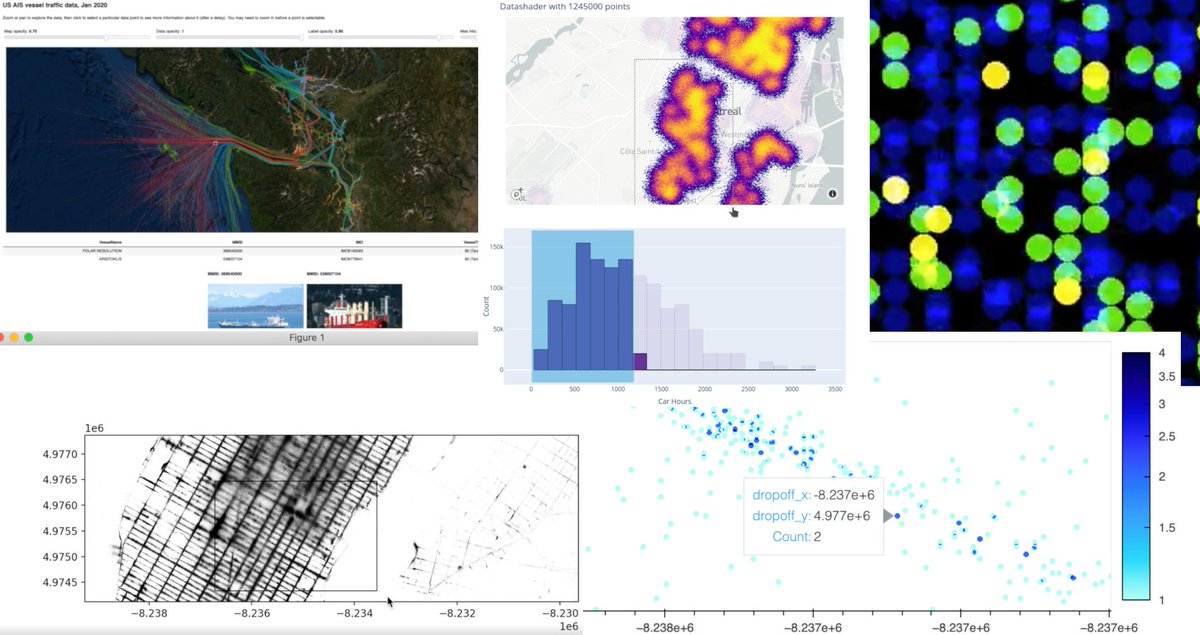
ALT Scatterplot of many points using a fire-theme palette on a black background. The points cluster in small groups. The general shape is circular, as is common of TSNE embeddings.
12
10
58
8,272

Our project family continues to grow 🪴🙌! We're excited to welcome @HoloViz_org, who has joined NumFOCUS as a sponsored project!
Learn more about the project here: numfocus.org/project/holoviz. #openscience #support #scientificcomputing #datascience

2
16
32
8,583
Datashader retweeted
10 May 2023
🎉 We’re thrilled to announce @AnacondaInc’s first ever #DataAppContest !!
The competition goes from June 13-30, so start building your team for the chance to win great prizes & showcase your skills!
Learn more & register here 👇
bit.ly/3VUzDxd

11
22
7,015
Datashader retweeted
28 Apr 2023
We are thrilled to announce the availability of the Panel 1.0 release candidate for general testing! This release represents a leap forward in performance and usability. We need your help to make this a smooth transition, find the announcement here: discourse.holoviz.org/t/pane…

22
54
6,808
Datashader retweeted

21 Mar 2023
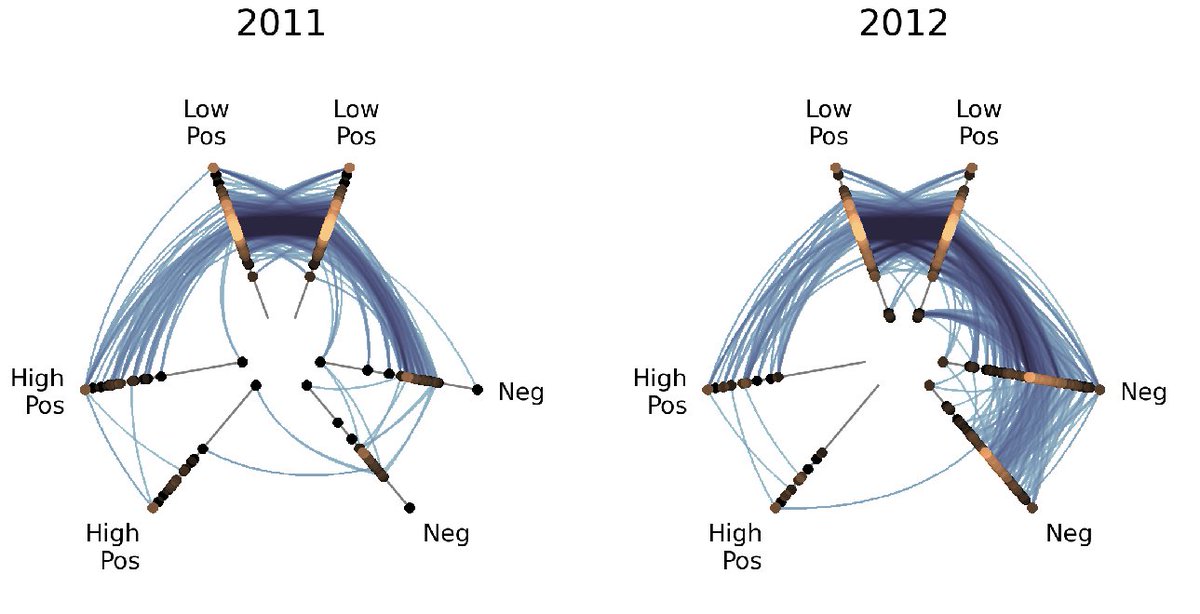
We revamped our Bitcoin OTC user ratings example to use Hiveplotlib's @datashader capabilities. We see changes in trust in the network over time that appear to correlate with the price of Bitcoin. For more, check out our docs: geomdata.gitlab.io/hiveplotl…
2
3
3
872
Datashader retweeted

29 Nov 2022
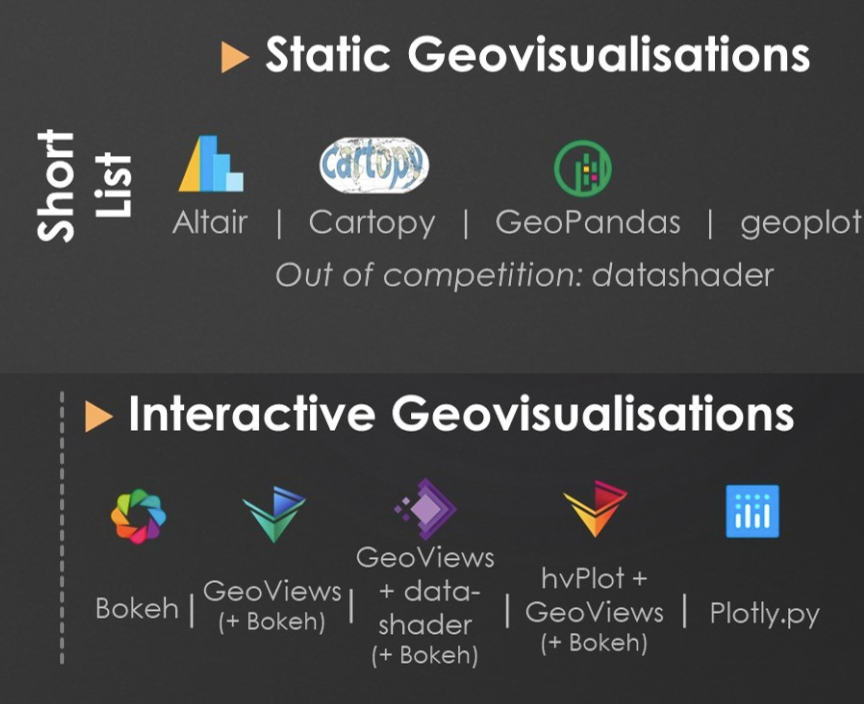
Check out this new review of Python viz libraries for geographic applications, comparing Altair, @Bokeh, Cartopy, @Datashader, GeoPandas, Geoplot, GeoViews, hvPlot, and Plotly: gregorhd.github.io/geospatia…
1
14
80
Datashader retweeted

16 Nov 2022
Video visualizing 1,000,000,000 points
youtu.be/LKIRAzsqLb0
This is a common example with Datashader. This video is different in that it focuses on performance tuning. When we start, an update takes 40s. When we're done, it takes ~1s.
High performance requires thought.
6
26
78
15 Nov 2022
Cool. Everyone be sure to zoom in and see the pretty snowflakes when these patterns are rendered at high resolution like this...


5
Datashader retweeted

10 Nov 2022
We are excited for @HoloViews, hvPlot, and @Panel_org to start building on the upcoming better support for bioscience and biomedical applications in @bokeh !
10 Nov 2022

Bokeh has been awarded a 2-year grant from the Chan Zuckerberg Initiative!:tada::tada:
A big thank you to @cziscience!
We are excited to support data visualization for bioscience research:microscope::bar_chart:
Read our announcement blog post here: blog.bokeh.org/announcing-cz…
10
26
Datashader retweeted
1 Nov 2022
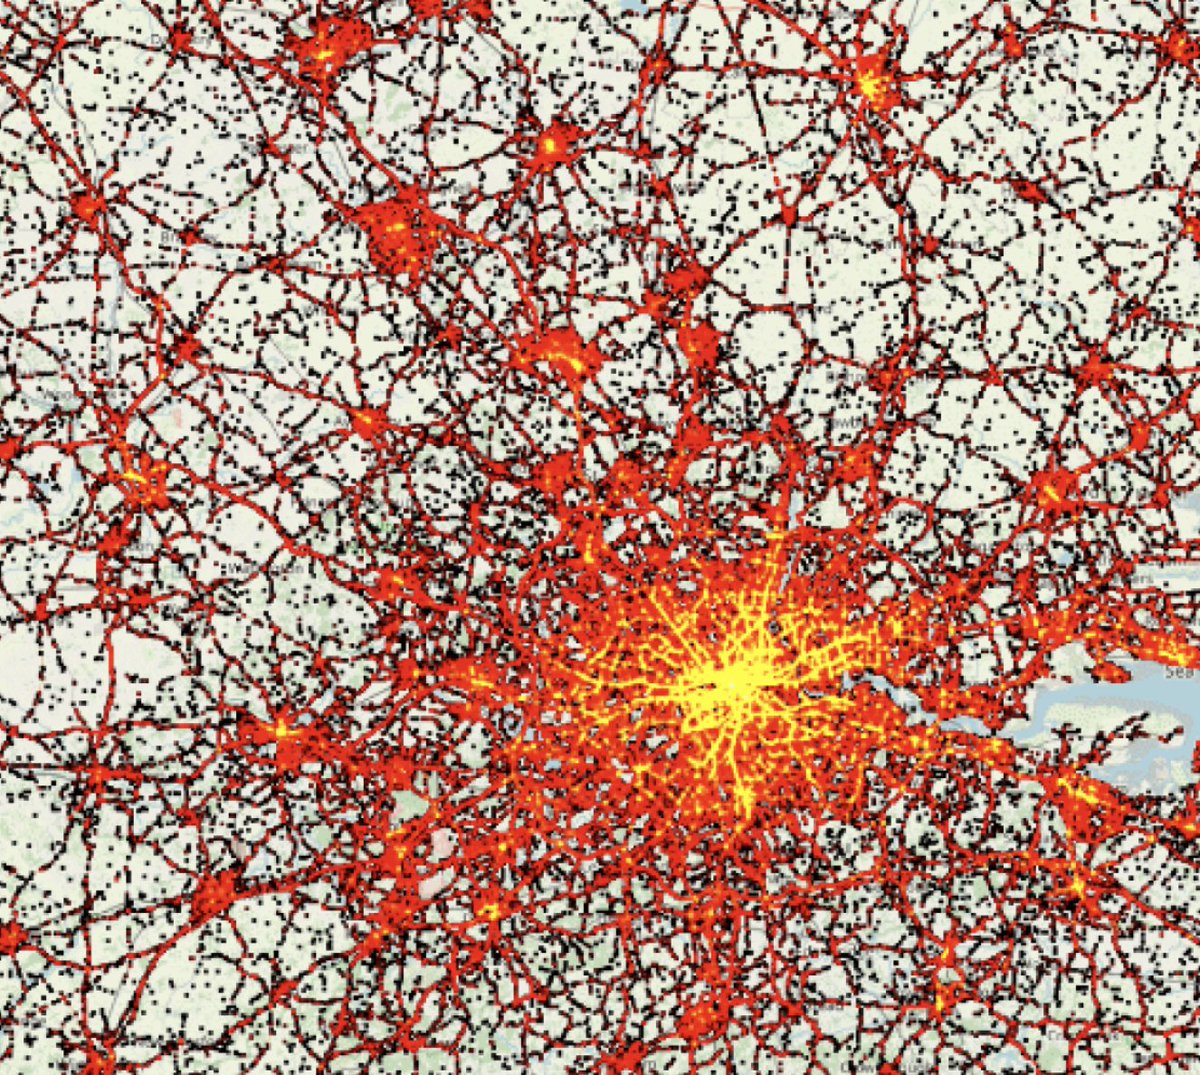
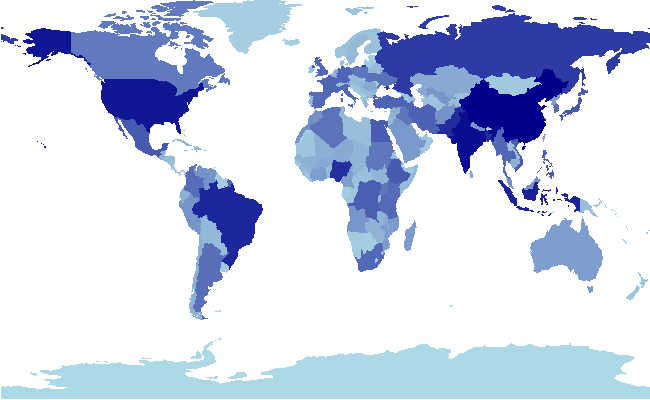
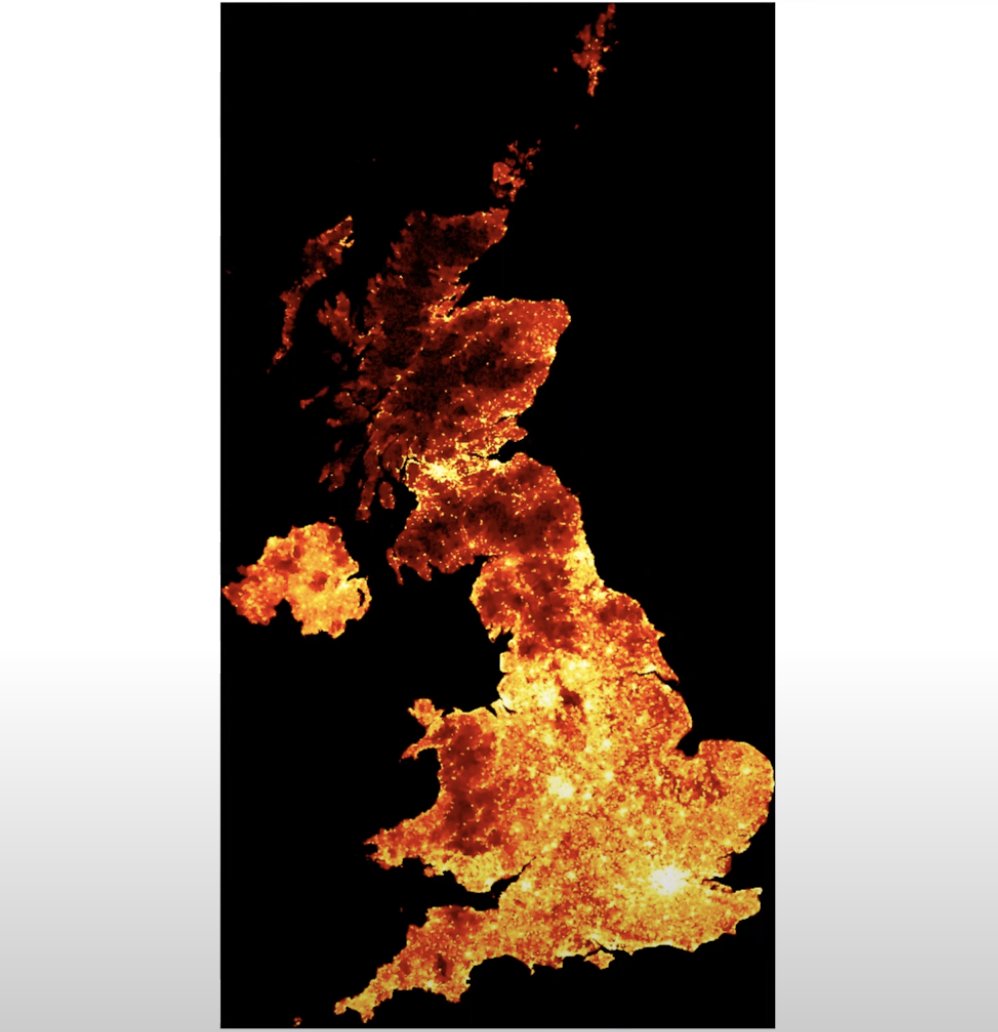
Great new @Datashader talk about the UK Census from github.com/ianthomas23: youtube.com/watch?v=GX5IQgwS…
6
15

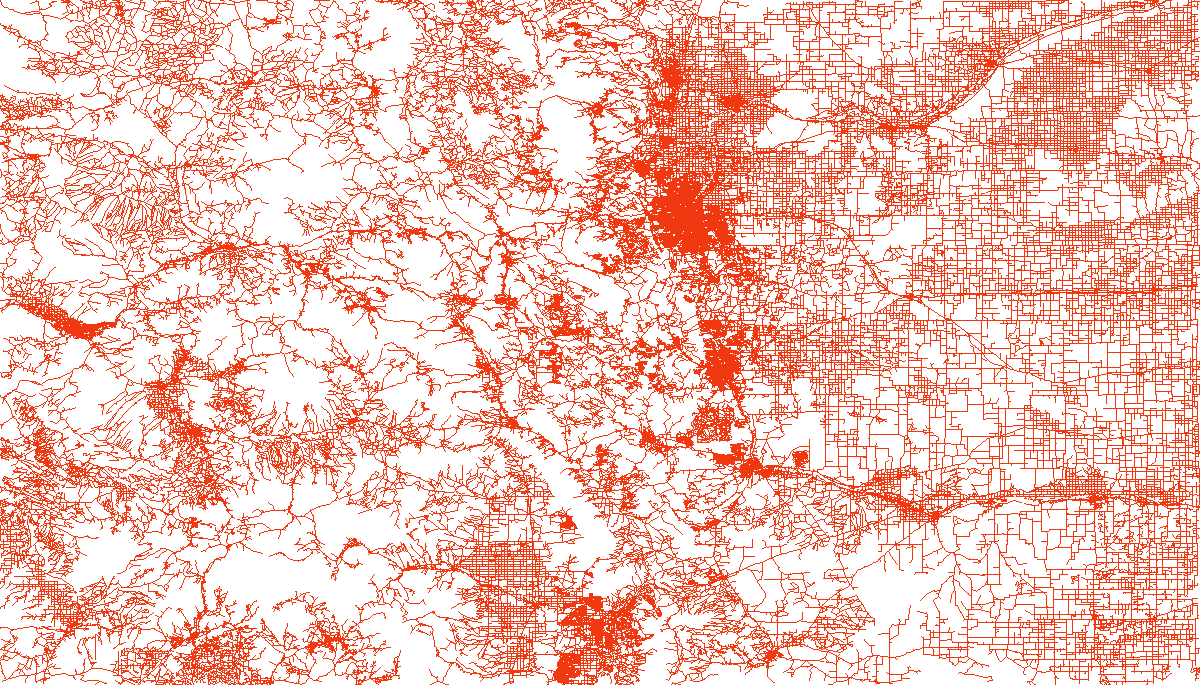
New post : Download some benchmark road networks for Shortest Paths algorithms bit.ly/3R5GSOv
#Python #networks #Parquet @DuckDB @Datashader
7
15
Datashader retweeted
21 Sep 2022
Exciting hvPlot 0.8 news: In addition to @bokeh, you can now create @matplotlib and @plotlygraphs: blog.holoviz.org/hvplot_0.8.… Compared to the default Matplotlib Pandas .plot(), hvPlot adds automatic widgets for exploring data, easy layouts, maps, datashader, and more!
3
8
Datashader retweeted

20 Sep 2022
We are very excited to announce the release of hvPlot 0.8! Discover the new features here: blog.holoviz.org/hvplot_0.8.… or check out @sophiamyang's amazing video: youtube.com/watch?v=UJtmo4i6…
2
9
24
Datashader retweeted

18 Sep 2022
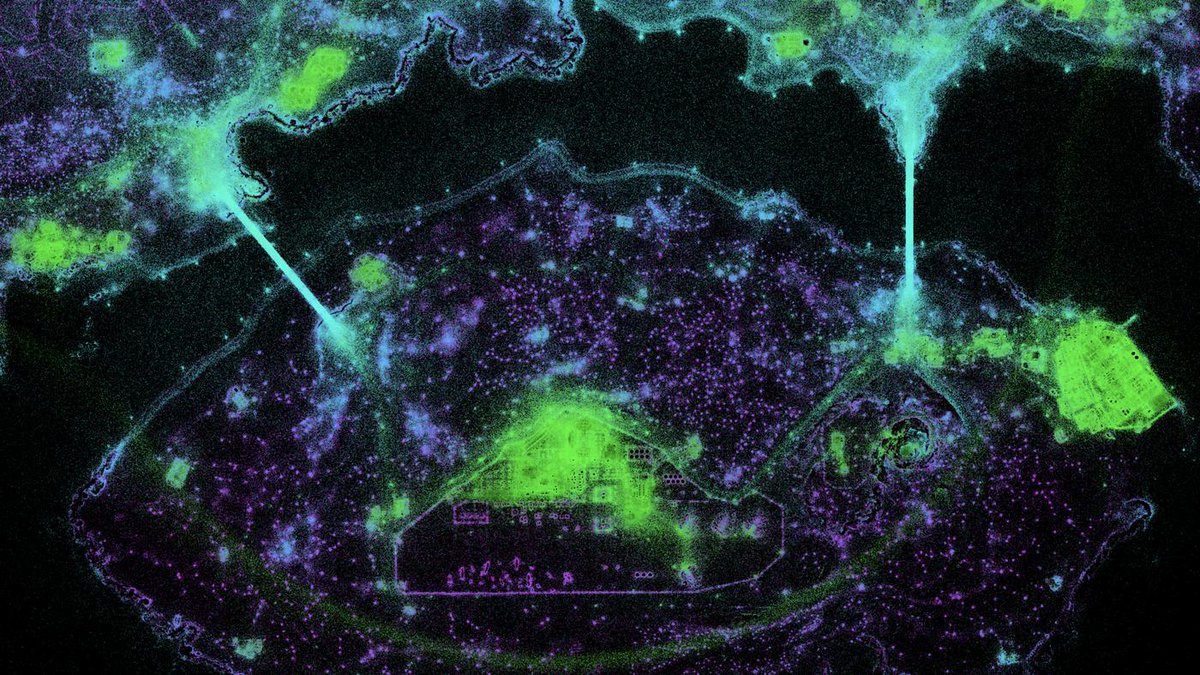
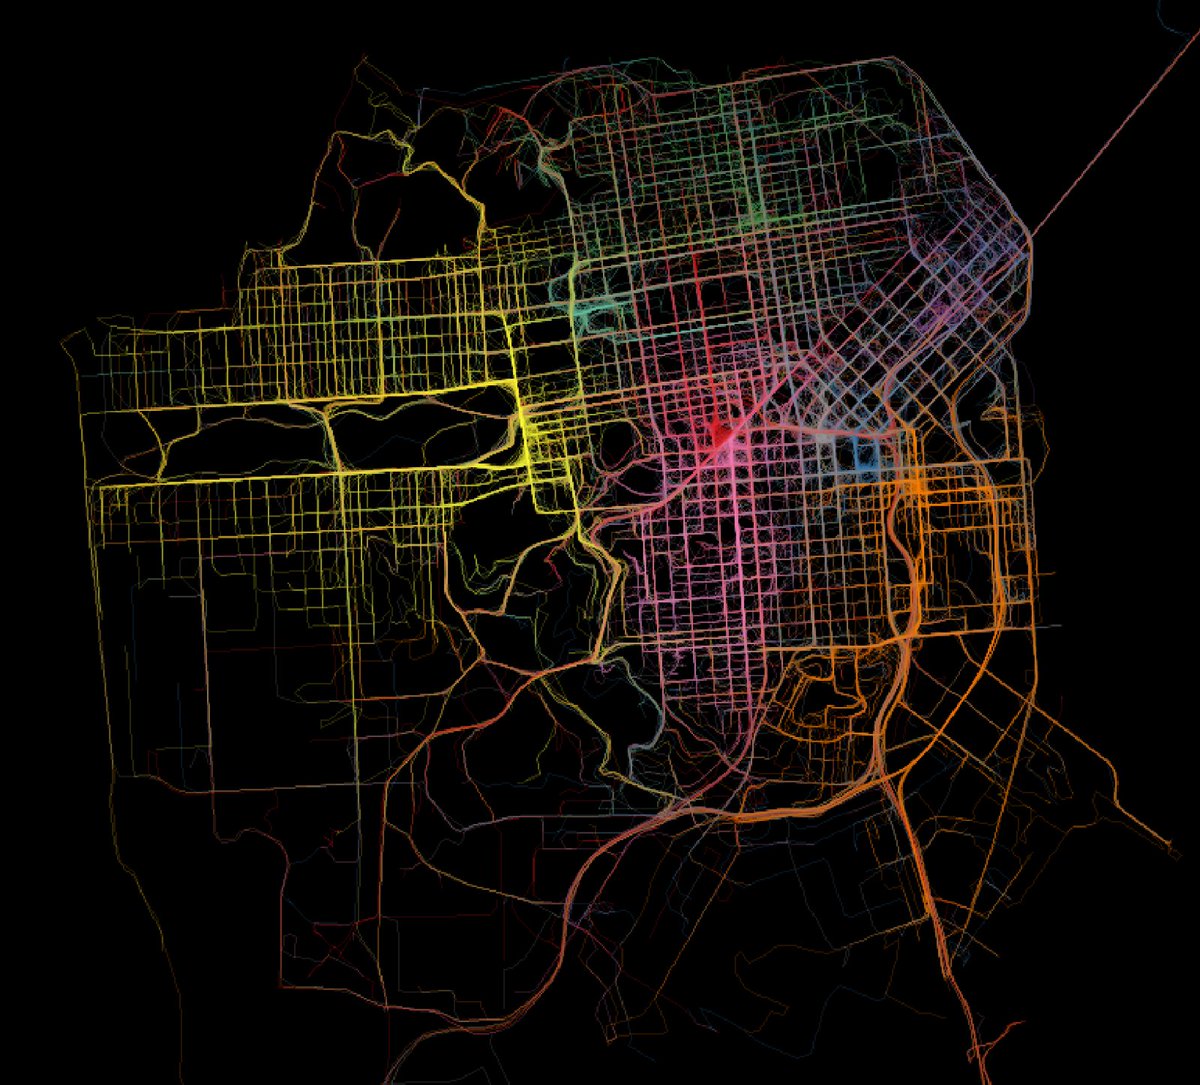
The beauty of matrix eigenvalues.
Eigen Values of 1M random matrices of form [A 1 -1; -1 B 0; 1 -1 -1]
Made in #Python using @datashader and @matplotlib
Inspired from the same viz by @BohemianMatrix
4
24
Datashader retweeted
10 Sep 2022
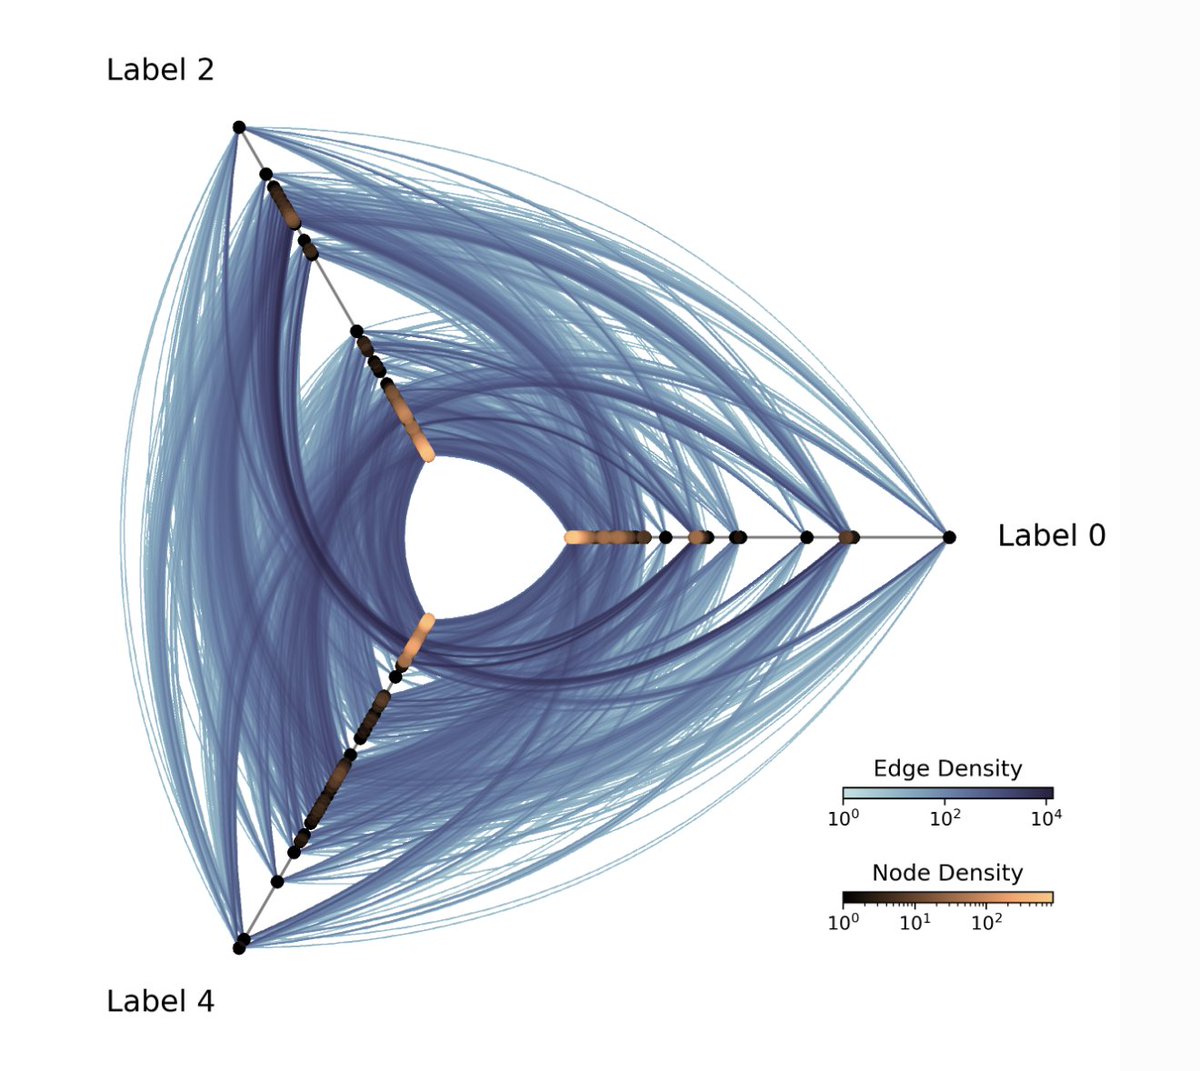
New in hiveplotlib 0.19 - @datashader with hive plots! 50,000 edges and we can still see their relative density in the figure. See the docs for more info geomdata.gitlab.io/hiveplotl…
7
13

☯️ #zen3geo v0.3.0. Now integrated with @datashader to rasterize vector 💠 points/lines/polygons to @xarray_dev grids! New walkthrough #DataPipe using @UNOSAT digitized flood 🌊 masks over #Sentinel-1 #SAR imagery at Johor, Malaysia 🇲🇾 zen3geo.readthedocs.io/en/v0…. Now go map 🗺️!
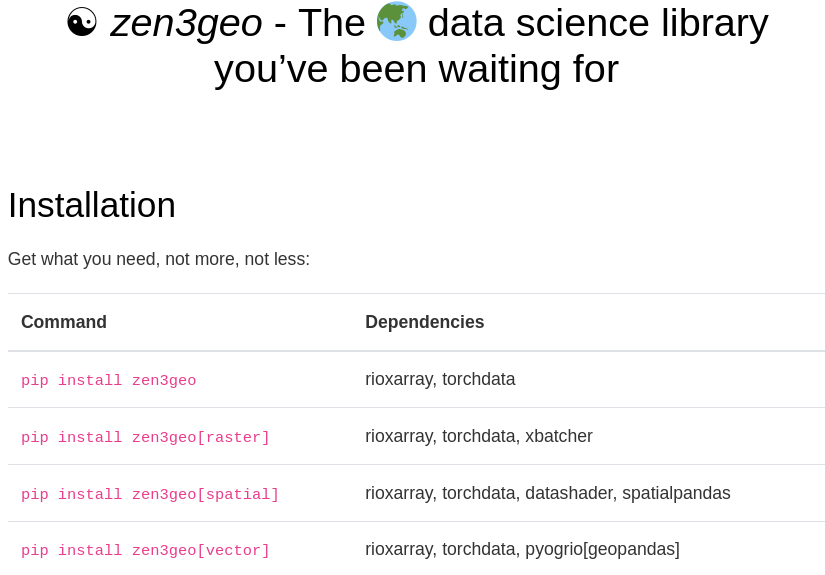
ALT Installation instructions for zen3geo, e.g. `pip install zen3geo`
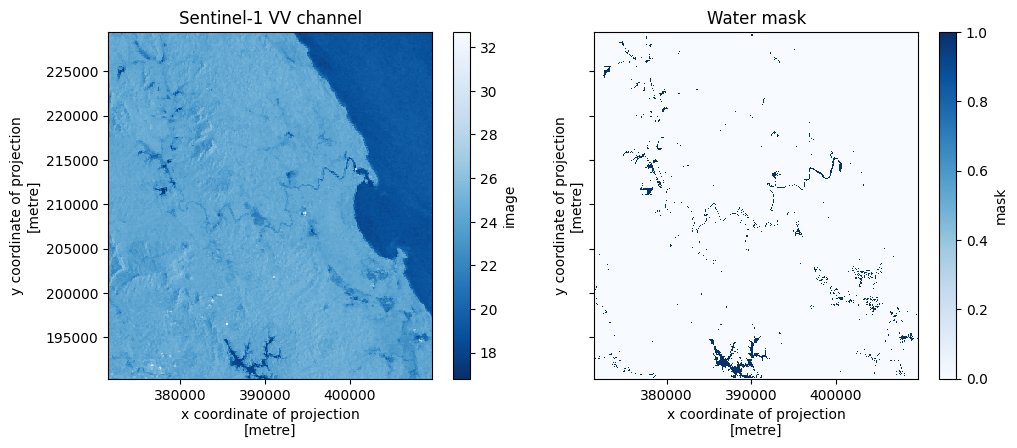
ALT Sentinel-1 VV channel image and corresponding water segmentation mask over Johor, Malaysia
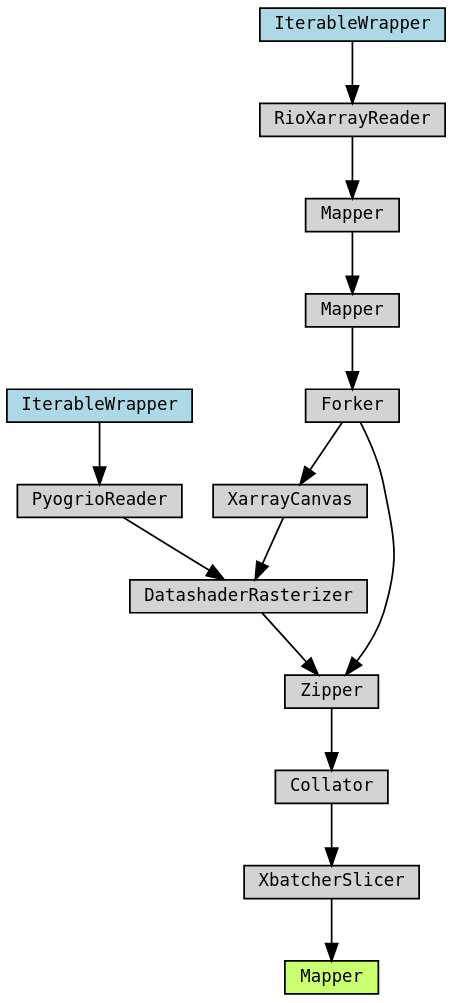
ALT @Pytorch DataPipe showing steps from Pyogrio and RIoxarray read to DatashaderRasterizer and beyond
6
20