It turns out you can do quite a lot in ten years.
An amazing round up of the more than 90 collaborations and the changes that are happening as a result.
Thank you
In our final blog the Centre’s Executive Director, Nancy Hey (@Work_Life_You) reflects on the achievements & challenges of the last decade, & looks ahead at the work still to be done: whatworkswellbeing.org/blog/…
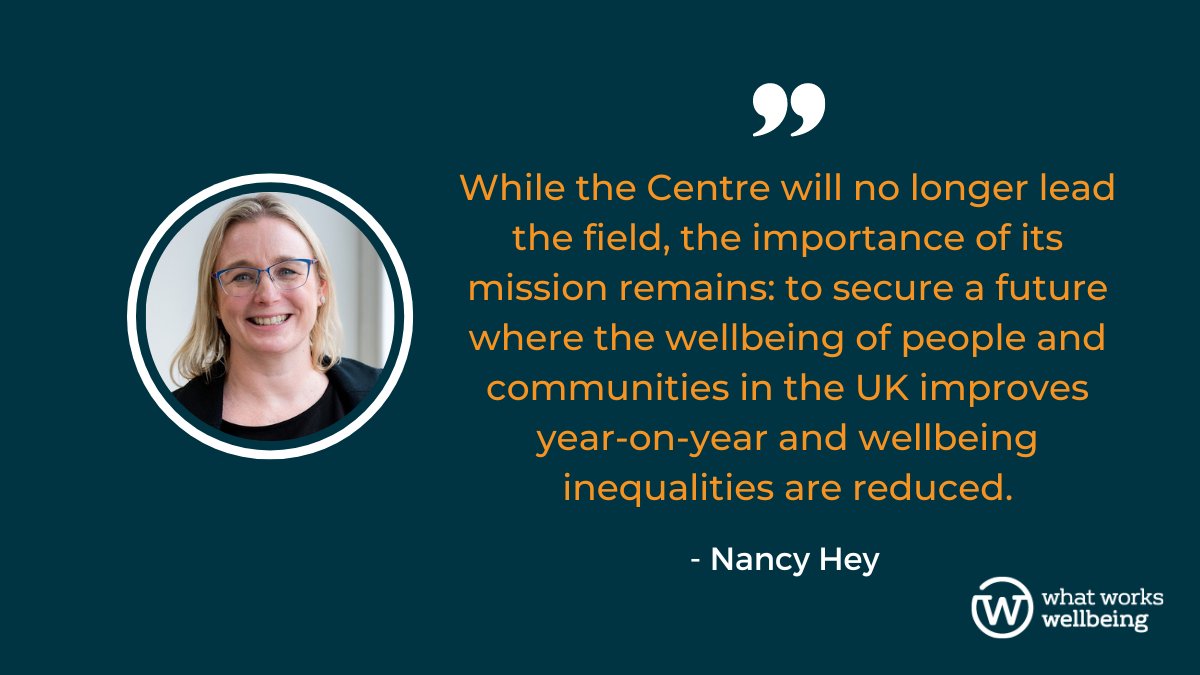
ALT A photo of Nancy Hey and a quote from her blog "While the Centre will no longer lead the field, the importance of its mission remains: to secure a future where the wellbeing of people and communities in the UK improves year-on-year and wellbeing inequalities are reduced."
⬆️ Pendle, 0.93
⬆️ Brentwood, 0.76
⬆️ Colchester, 0.74
⬇️ Nuneaton and Bedworth, -0.95
⬇️ Rushmoor, -0.96
⬇️ Cambridge, -1.00
Some areas of the UK have seen substantial increases in #wellbeing over the past decade – but others have lagged behind.👇
worldwellbeingmovement.org/u…
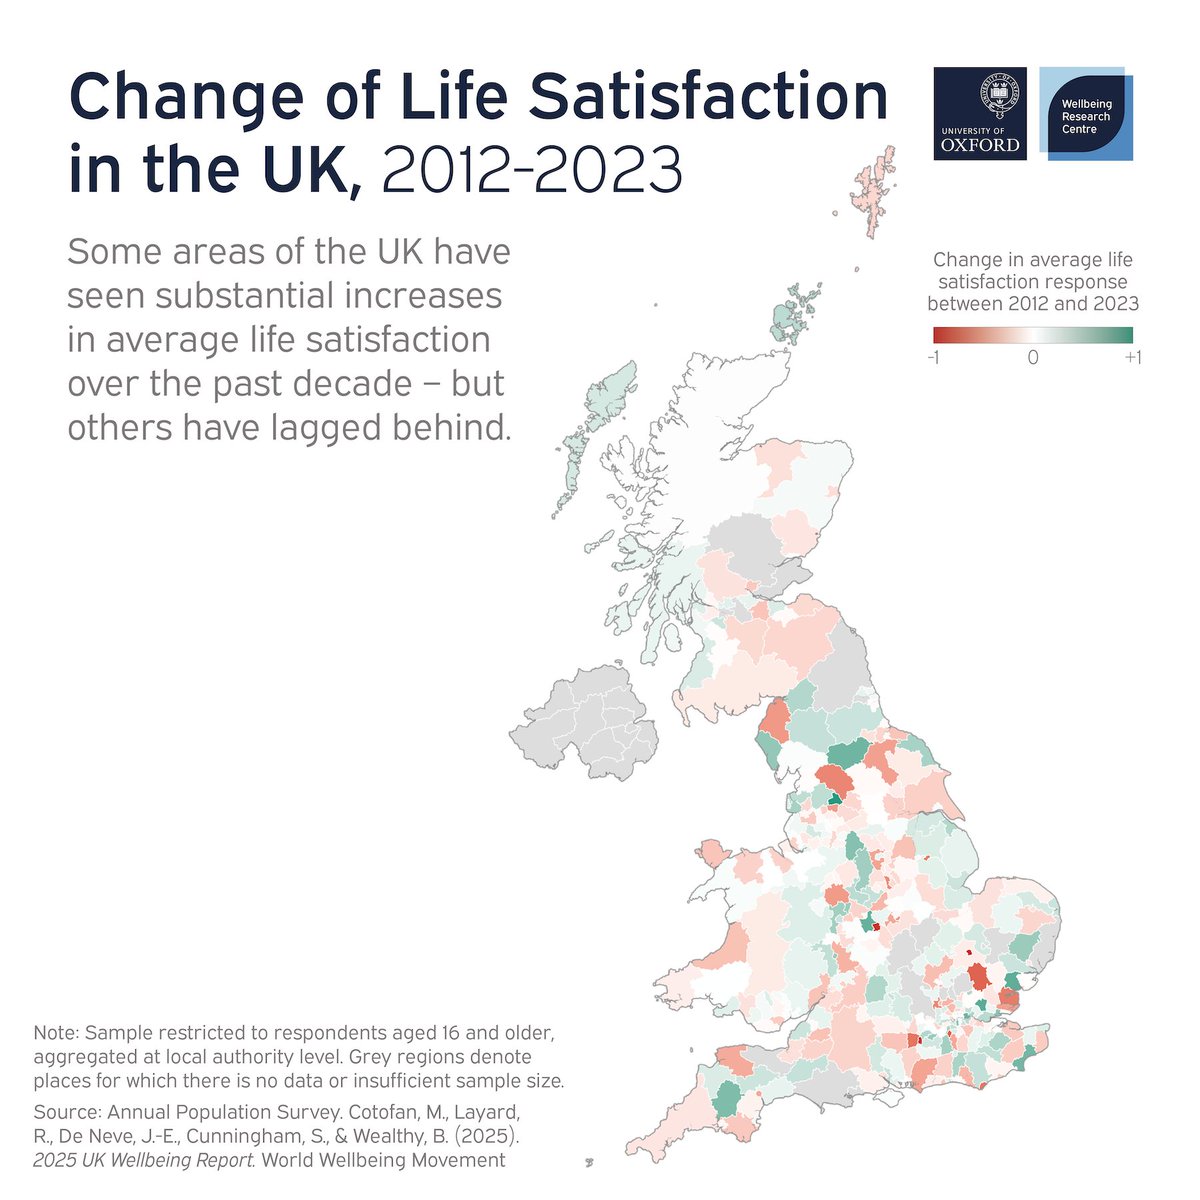
ALT Map presented under the title “Change of Life Satisfaction in the UK, 2012-2023”. Subtitle reads: “Some areas of the UK have seen substantial increases in average life satisfaction over the past decade - but others have lagged behind.”
Local authority areas in England, Scotland and Wales are coloured in various shades of red and green, with green shades to represent areas with an increase in average life satisfaction between 2012 and 2023, and red shades to indicate a decrease. Darker shades represent a larger change. Grey regions denote places for which there is no data or insufficient sample size.
The source of the graph is the Annual Population Survey, presented in the 2025 UK Wellbeing Report published by the World Wellbeing Movement, of which a full citation is provided.
We’ve completed one of the world’s largest school-based mental health trials through @EBPUnit with @UCL. Read the results from Education for Wellbeing and find out how schools can build students’ mental health and wellbeing: orlo.uk/oF5Bn
My sense is that Deep Research seems to do reasonably well if it can find an existing resource summarizing the topic it's trying to understand (a Wikipedia article, survey article, blog post...) and follow the links from that resource.
New real-time suicide data have been published by @OHID, taking us to October 2024.
National suicide rate isn’t rising - important at time of economic stress for many. No rise in men, women or any age group.
Although, needless to say, no rate is acceptable. #suicideprevention
We are so excited that #BeeWell schools have been receiving their dashboards and reports today!
250 schools took part in #BeeWell in Autumn 2024, and we can’t wait to support them to explore and respond to what young people are telling us about their wellbeing.
ALT An image of the #BeeWell logo and text that reads '#BeeWell schools receive their 2024 survey feedback this week!' and the slogan 'Making young people's wellbeing everybody's business'.
What is the meaning of life? What would you remember as bringing satisfaction, meaning, and purpose to your life? These are the modest questions that David Lagakos, Stelios Michalopoulos and I try to answer by "interviewing" over 1,400 Americans. We don't get to talk to them
Fantastic to see new impetus for #community focused research from @ESRC and delighted that @LocalTrust will be a founding partner of the new Centre for Collaboration in Community Connectedness localtrust.org.uk/news-and-s…
There's still time to apply!
We are launching an £11.5m investment with @SciTechgovuk to fund the development and management of a global evidence synthesis infrastructure.
Apply now: orlo.uk/d7qFp
Closes 12 Dec
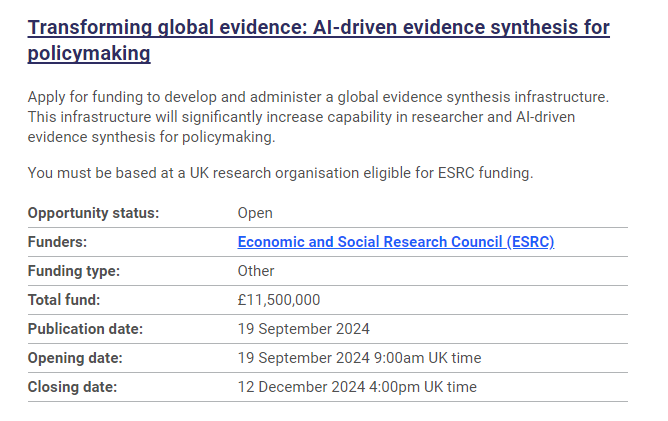
ALT Text extract from the UKRI website which reads:
Transforming global evidence: AI-driven evidence synthesis for policymaking
Apply for funding to develop and administer a global evidence synthesis infrastructure. This infrastructure will significantly increase capability in researcher and AI-driven evidence synthesis for policymaking.
You must be based at a UK research organisation eligible for ESRC funding.
Opportunity status: Open
Funders: Economic and Social Research Council (ESRC)
Funding type: Other
Total fund: £11,500,000
Publication date: 19 September 2024
Opening date: 19 September 2024 9:00am UK time
Closing date: 12 December 2024 4:00pm UK time
Happy to have contributed to this important piece of work for @OECD on selecting the shortest possible set of well-validated measures to capture the most policy-relevant aspects of affective experience. You can read the paper here - oecd.org/en/publications/mea…
Life expectancy has continued to rise in the longest-lived countries—
Record national life expectancies have been climbing for over a century.
In 1840, Swedish women had a life expectancy of 46 years — the highest of any country recorded that year. By 1921, Australia held the record at 63 years.
For most of the 20th century, Iceland, Norway, Australia, and Sweden competed for the top position before being overtaken by Japan in 1984. Hong Kong and Japan have held the records since then.
These countries didn’t merely catch up; they’ve continued to push the limits higher.
Japan added six more years to female life expectancy between 1984 and 2010, rising from 80 to 86 years.
This remarkable rise has resulted from many advances in medicine, public health, and living standards — breaking many predictions of the “limits” of life expectancy.
(This Daily Data Insight was written by @salonium.)
ALT A graph depicting female life expectancy at birth over the years, with the vertical axis representing lifespan in years, and the horizontal axis indicating years from 1840 to 2023. Various colored dots represent different countries, with Hong Kong with the highest in 2023 at 88.1 years. The graph notes that Hong Kong and Japan have held records for the past 40 years. Previously, countries like Iceland, Norway, Australia, and Sweden were among the highest. Data sources are the Human Mortality Database for 2024 and UN World Population Prospects for 2024.
In West Yorkshire, we're unlocking the power of creativity to help people live healthier, happier lives.
Because 80% of things that help us stay healthy fall outside of healthcare.
Find out how the Creative Health Hub is bringing culture and healthcare together: research.hud.ac.uk/institute…
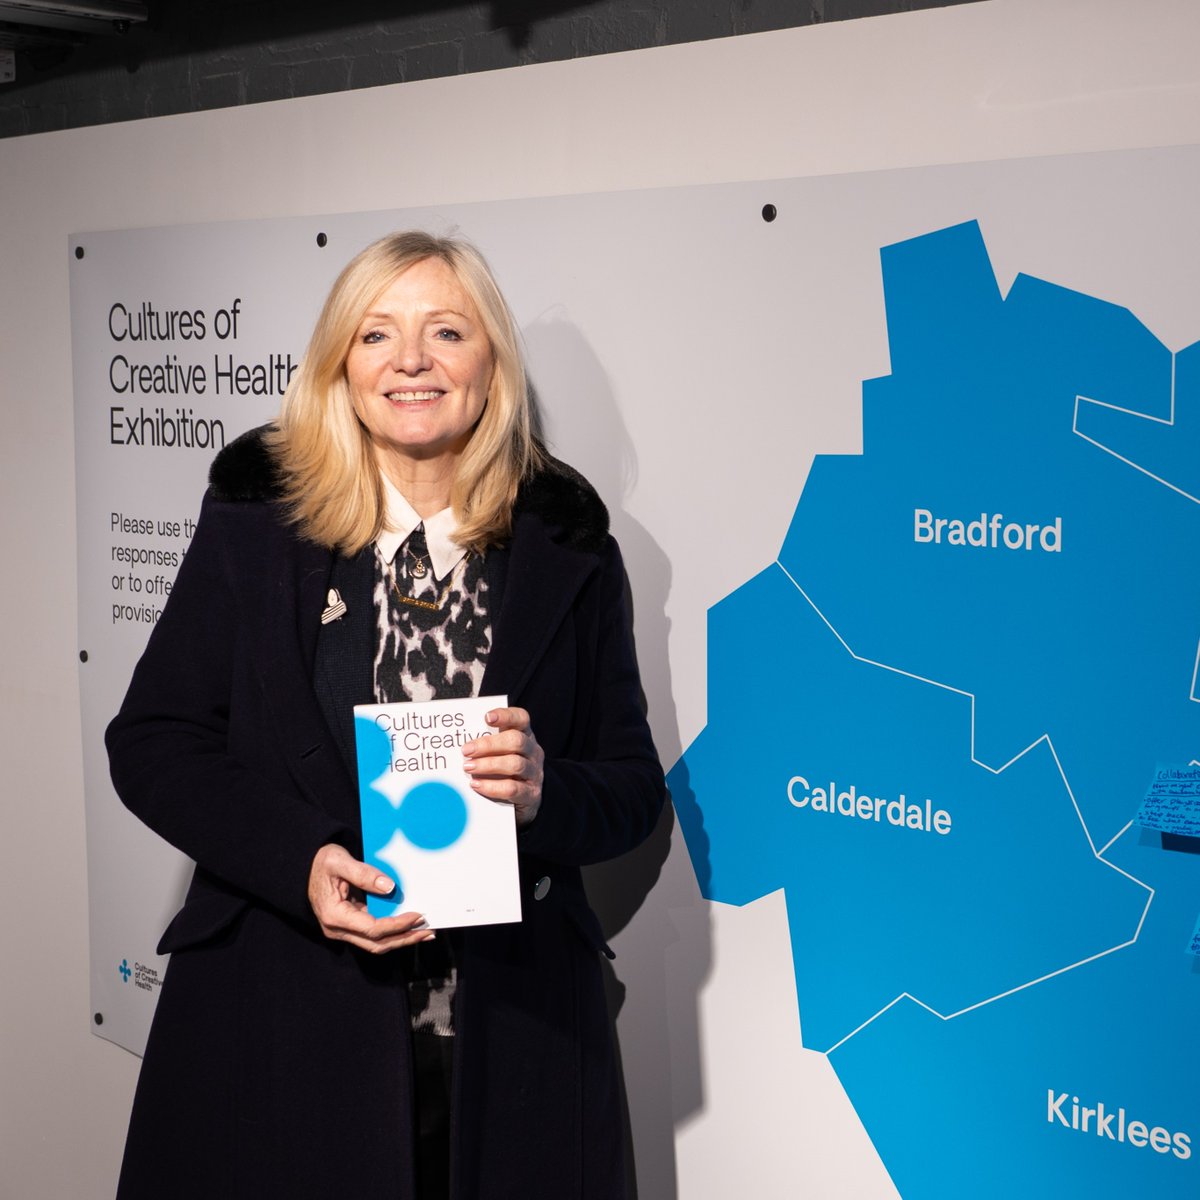
ALT Mayor of West Yorkshire, Tracy Brabin, holding a booklet that says "Cultures of Creative Health" on the front. She is stood in front of a large blue map of West Yorkshire.
Here's an alternative story to Dickens' three ghosts from A Christmas Carol: The 3 Bricklayers story about the power of purpose.
A simple version goes that a person walked past a building project and asked three workers the same question: “What are you doing?”
The first replied, “I’m laying bricks.”
The second replied, “I’m building a wall.”
And the third replied, “I’m creating a cathedral.”
ALT The Three Bricklayers story, or 3 Bricklayers Parable, is about the meaning, vision, leadership, and motivation of work.
It’s a myth that suicide rates rise at Xmas, at least in England. Though there are plenty of lonely people.
But the highest rate is at New Year. Alcohol & family conflict the likely causes.
Our study @NCISH_UKpubmed.ncbi.nlm.nih.gov/2699…
I believe such technical work is key to achieving our mission — making data easier for everyone to access and use.
But it is extremely hard to find funding for technical work.
If you’d like to support us, we would very much appreciate if you support our non-profit work: ourworldindata.org/donate
We recently made it even easier to reuse the data we provide, with two new features — upgraded data downloads & an API.
We’ve heard how helpful these are from many users — e.g., data scientists & researchers have told us how the API makes their workflows more efficient and reproducible.
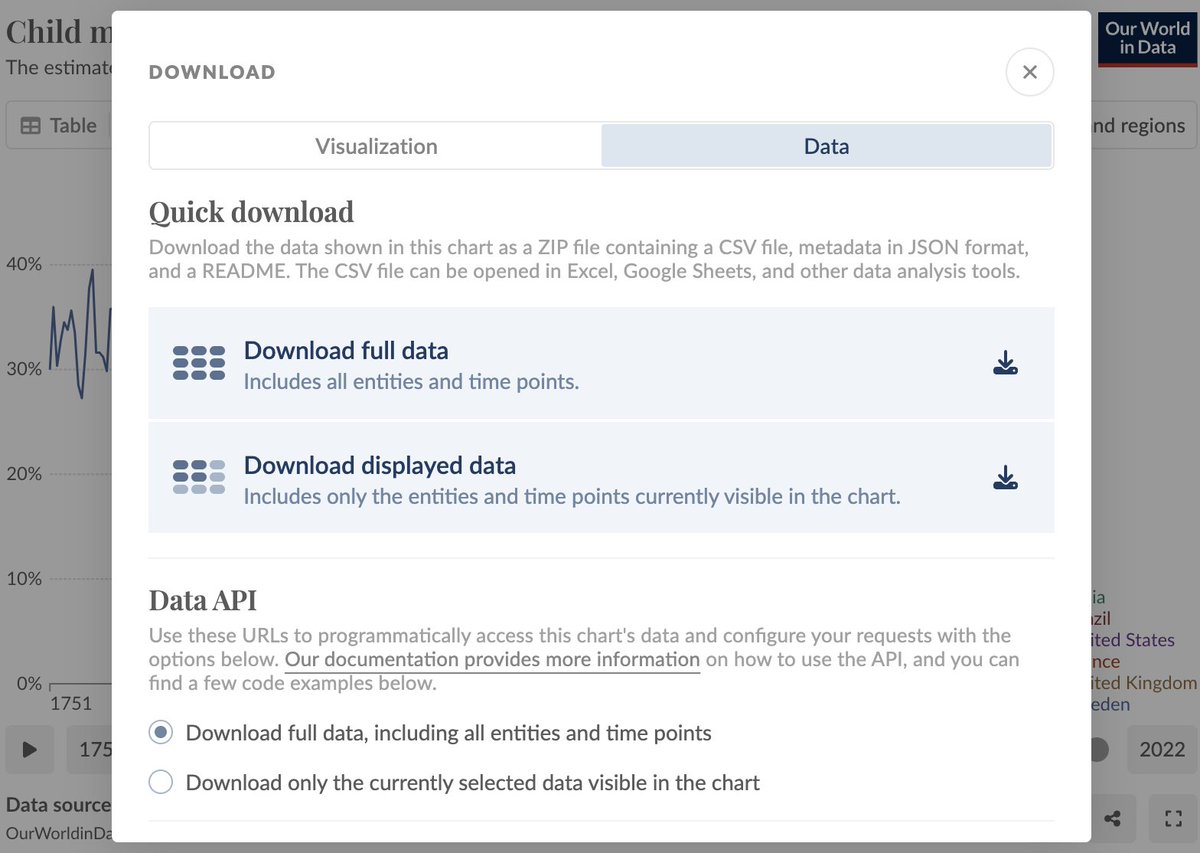
ALT Image showing new features to download data from charts on Our World in Data.
How do you have a children’s wellbeing bill without any attempt to measure their wellbeing across the country? There is a lot to welcome in the Bill but this gap is a fundamental flaw.
We published our #ActiveLives Children & Young People survey - the most comprehensive insight into the activity levels of ages 5-16 - which found that long-term upward trends since the survey started are positive, but persistent inequalities continue.
#2024InReview 📅
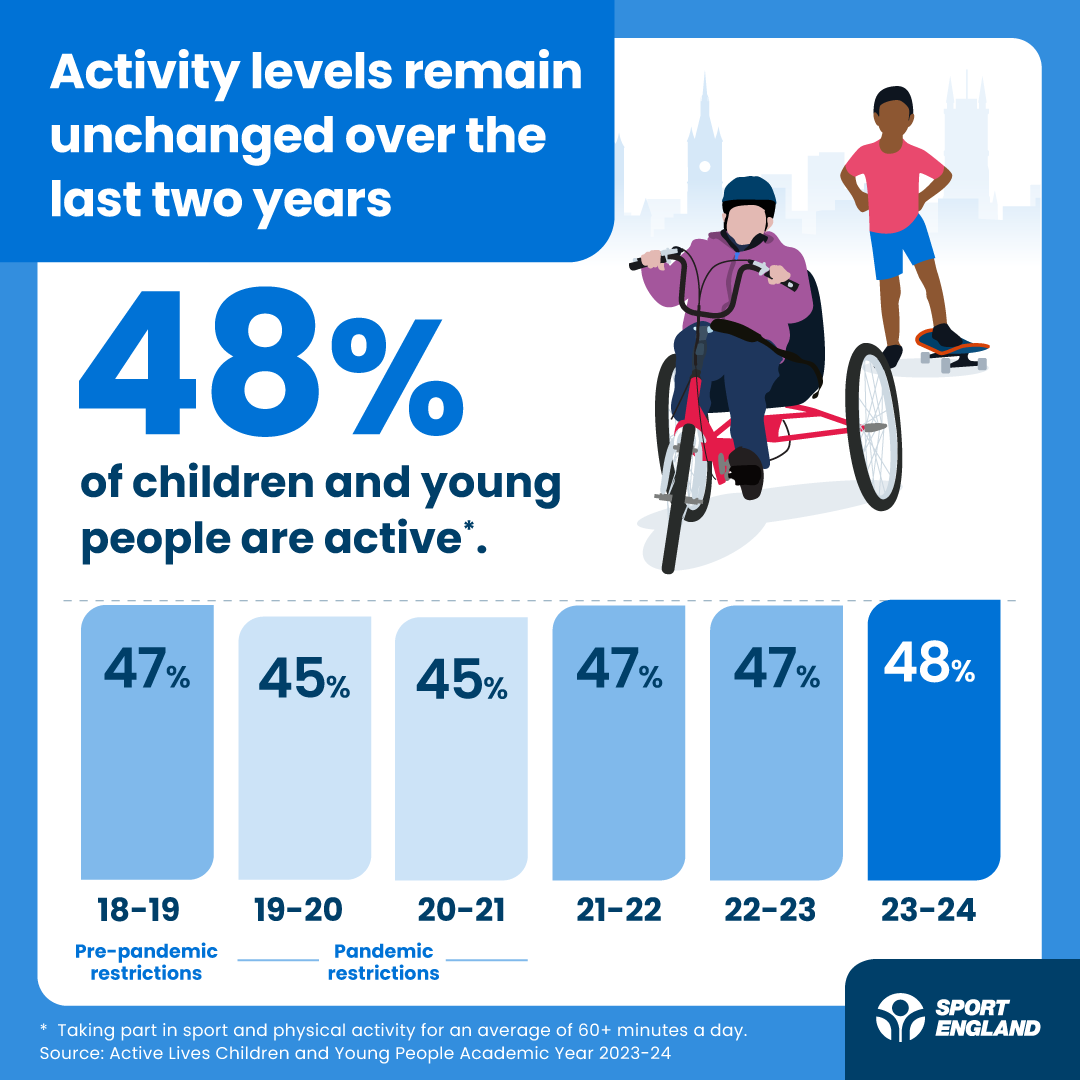
ALT Graphic showing that 48% of children remained active over the last two years. The chart compares activity levels from pre-pandemic at 47%, 45% during 2020-21 restrictions, and 48% in the 2023-24 academic year. Source: Sport England.
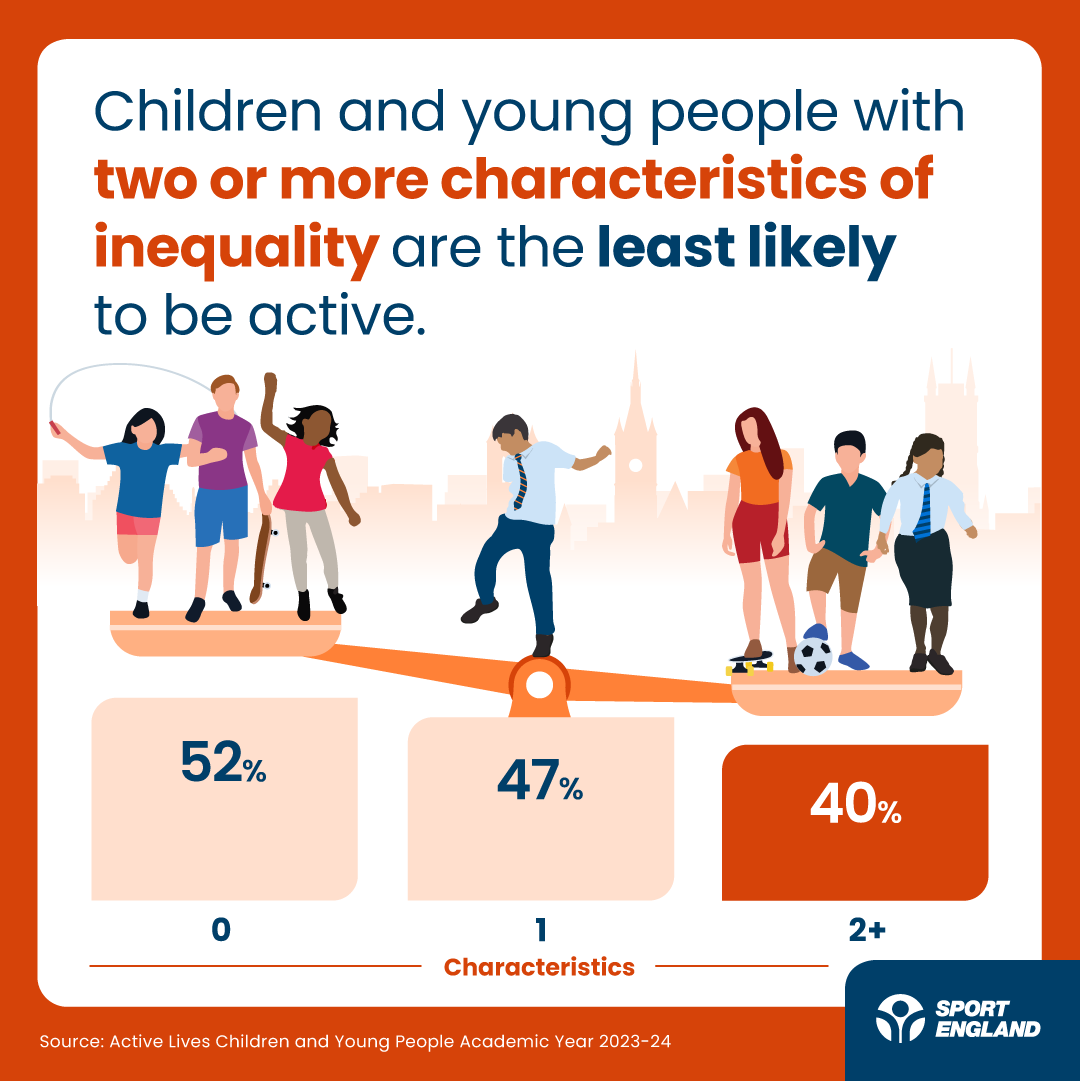
ALT Infographic by Sport England showing statistics on how children and young people with two or more characteristics of inequality are more likely to be active, against a backdrop of London landmarks. Percentages of 52%, 47%, and 40% are displayed alongside diverse groups of active individuals.
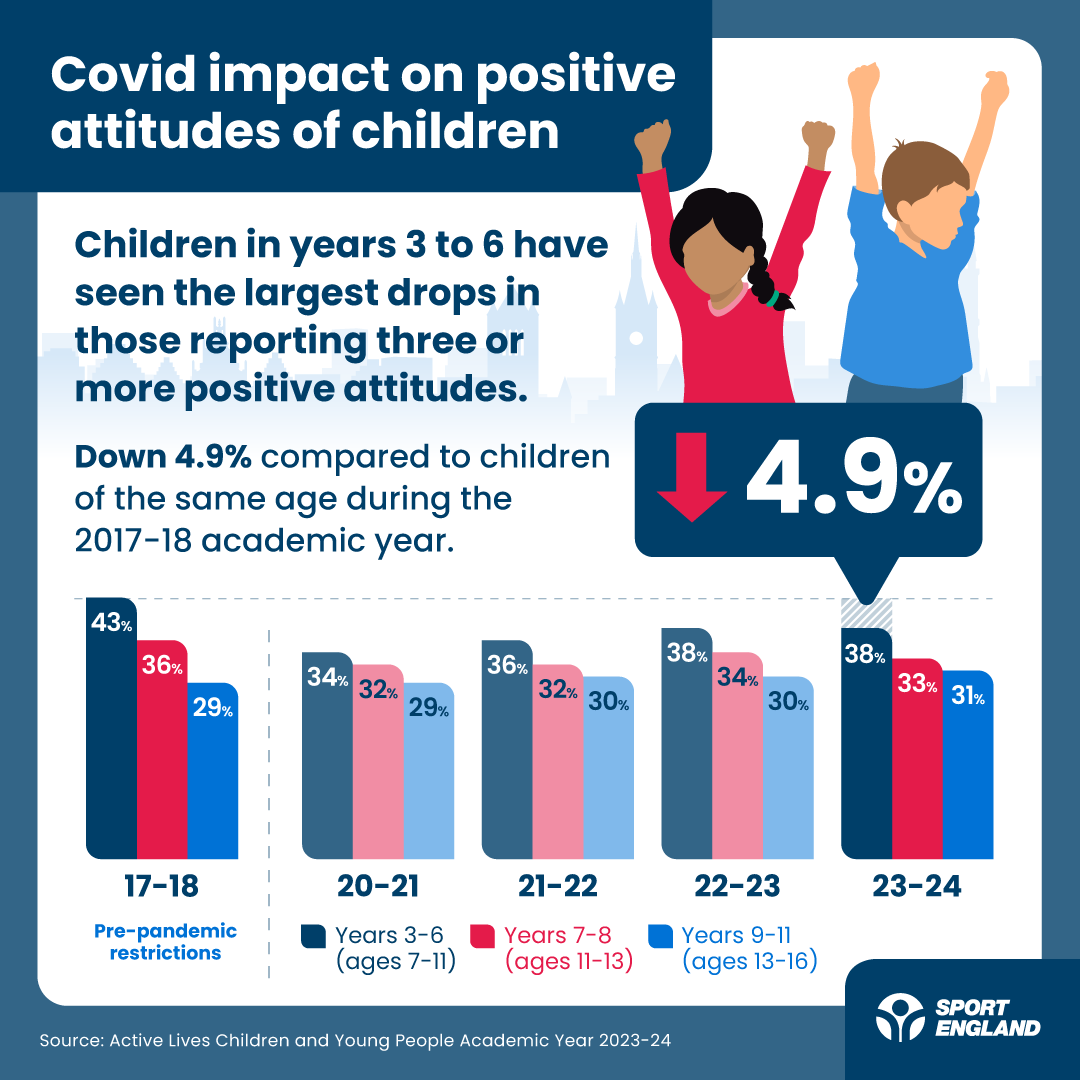
ALT Infographic titled 'Covid impact on positive attitudes of children' by Sport England showing a decline in positive attitude percentages among children in years 3 to 6 by 4.9% during the academic year 2021-22 compared to 2017-18. The infographic displays four vertical bar charts comparing pre-pandemic rates in 2017-18 to rates in 2019-20, 2020-21, and 2021-22 for age groups years 3-6, 7-8, 9-11. Each group shows a decrease, highlighted by a prominent red downward arrow indicating a 4.9% drop.
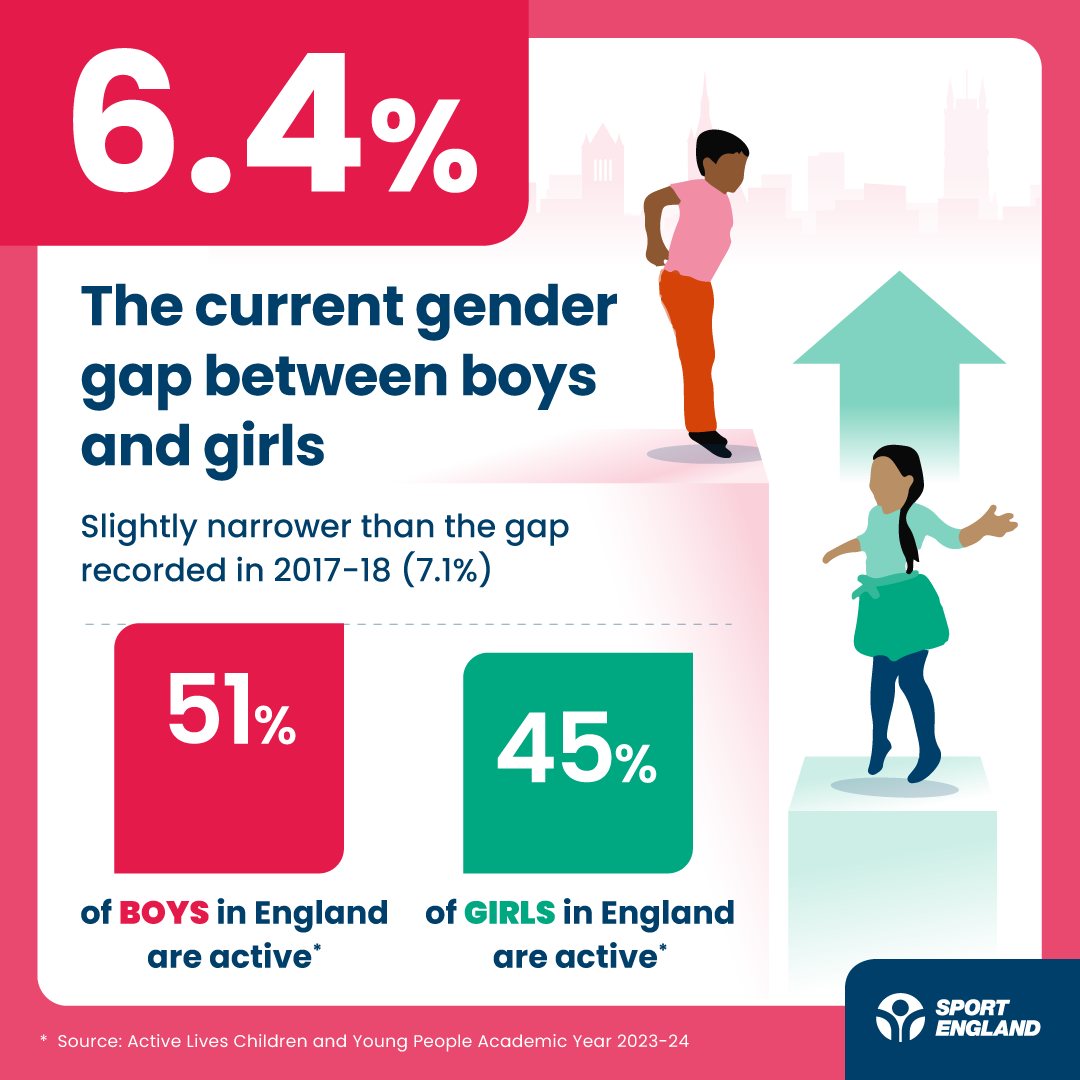
ALT Infographic by Sport England highlighting the gender gap in physical activity between boys and girls in England for the year 2023-24. The image shows two arrows with percentages: 51% of boys are active, down from 54.7%, and 45% of girls are active, up from 47.1%, indicating a current gap of 6.4%. Figures are depicted standing on each arrow to represent boys and girls.