
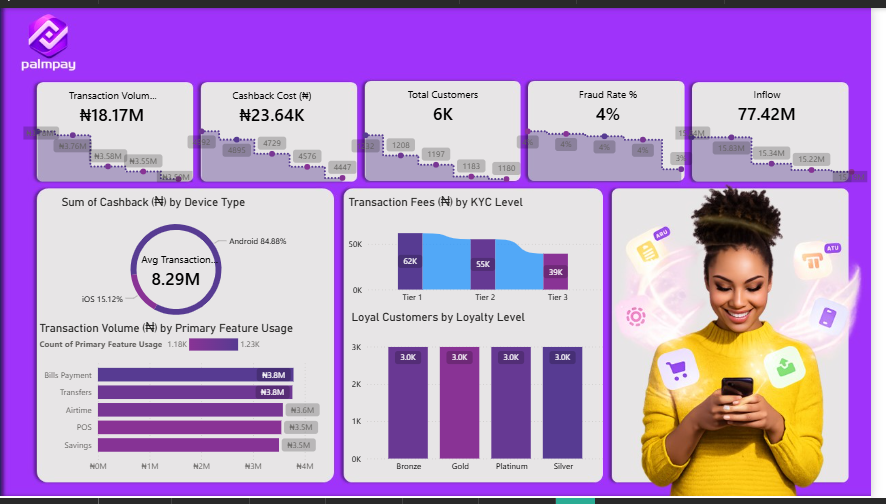
Power BI Project Spotlight: PalmPay Interactive Dashboard
One of the fintech dashboards I built recently was an interactive PalmPay Business Intelligence Dashboard designed to transform transaction data into meaningful business insights.
Working on this project gave me deeper practical experience in data visualization, dashboard design, and fintech analytics.
The dashboard focuses on helping decision-makers quickly understand:
📊 Transaction performance trends
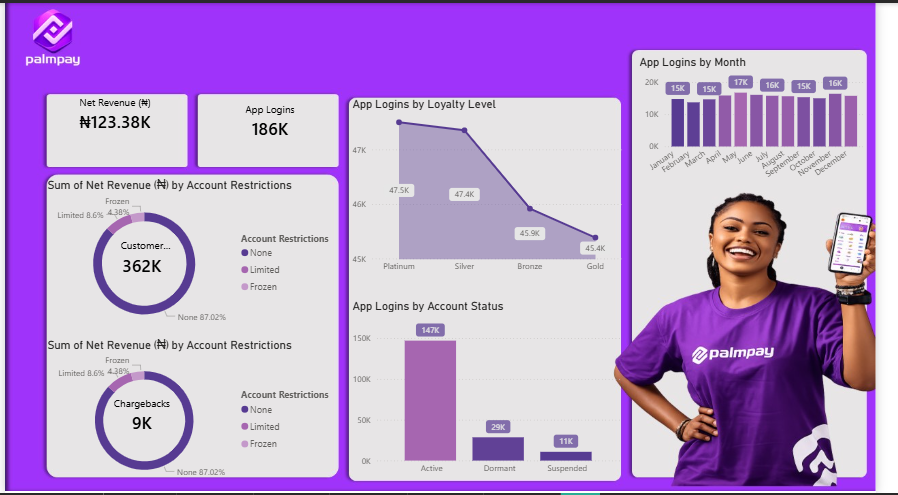
💳 Customer activity insights
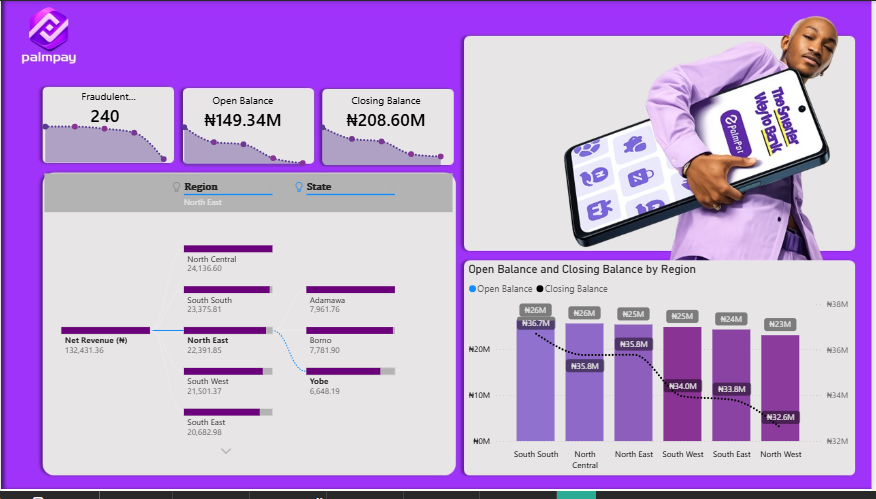
📈 Revenue movement analysis
📍 Regional performance breakdown
⚡ Interactive filtering for deeper exploration
🎯 KPI monitoring for strategic decisions
What stood out while building this dashboard was seeing how data can simplify complex financial operations into clear, actionable insights.
In the fintech space, dashboards like this are powerful because they help businesses:
✅ Monitor growth performance
✅ Identify user behavior patterns
✅ Track operational efficiency
✅ Make smarter, data-driven decisions
This project reflects what I enjoy most about data analytics:
Turning raw numbers into stories that drive action.
🔗 Explore and interact with the dashboard here:
app.powerbi.com/links/LOIRuI…
I’d appreciate your feedback on the dashboard design, insights, and overall presentation.
#PowerBI #PalmPay #FintechAnalytics #DataAnalytics #DashboardDesign #BusinessIntelligence #DataVisualization #AnalyticsProjects #PowerBIProjects #DataStorytelling
2
2
17
552
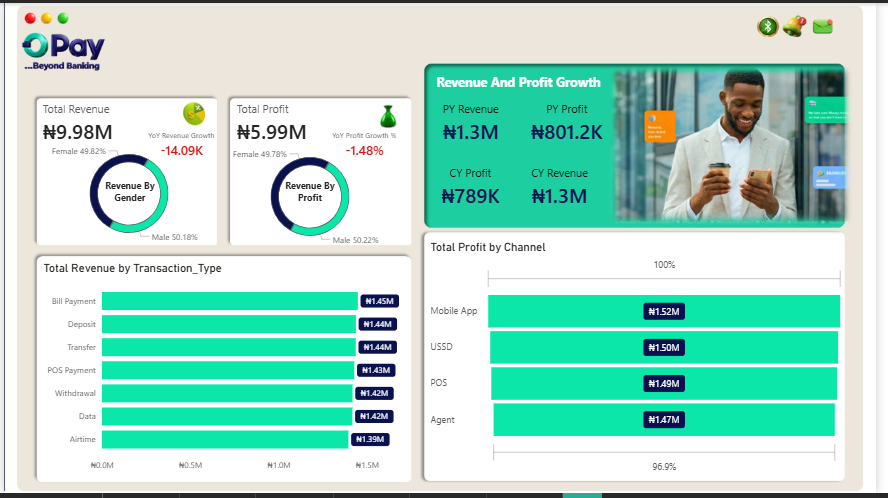
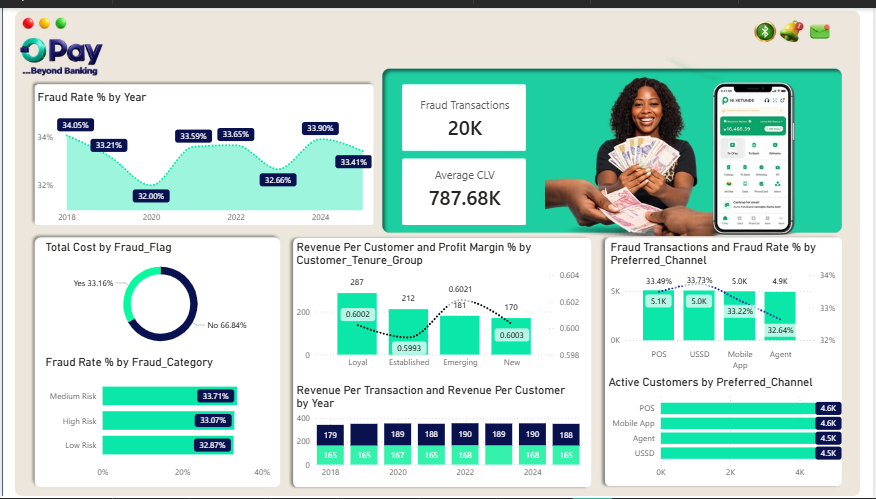
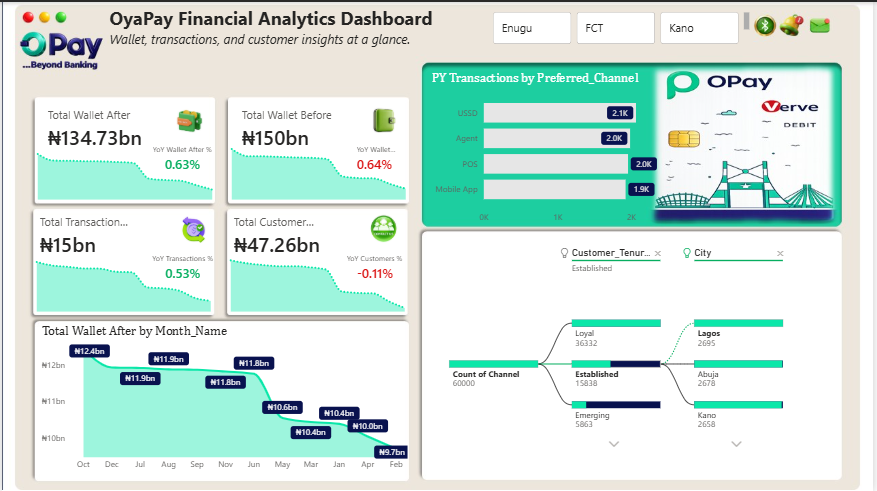
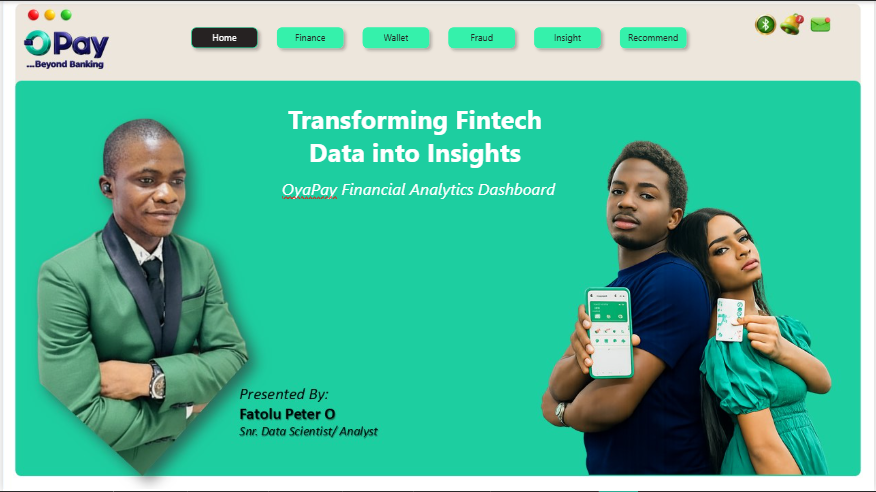
Building Real-World Data Projects: OPay Dashboard Case Study
A while ago, I built an interactive OPay Company Dashboard using Power BI — and it was one of the projects that really strengthened my data analysis and storytelling skills.
This dashboard wasn’t just about visuals…
It was about turning raw financial transaction data into clear business insights that can support decision-making in a fintech environment.
Inside the dashboard, I explored:
📊 Transaction trends over time
💰 Revenue and user activity patterns
📍 Performance insights across key segments
⚡ Interactive filters for deeper analysis
📈 KPI tracking for business performance monitoring
What makes this project powerful is how it demonstrates the real impact of data analytics in fintech — especially for platforms like OPay where millions of transactions happen daily.
💡 Key takeaway:
Data is not just numbers — it’s a story. And when properly visualized, it becomes a tool for smarter business decisions.
🔗 You can interact with the dashboard here:
app.powerbi.com/links/rhenAl…
I’d love your feedback on the design and insights 🙌
#DataAnalytics #PowerBI #OPay #Fintech #DataVisualization #BusinessIntelligence #DataScience #DashboardDesign #AnalyticsProjects #DataStorytelling
3
3
20
606

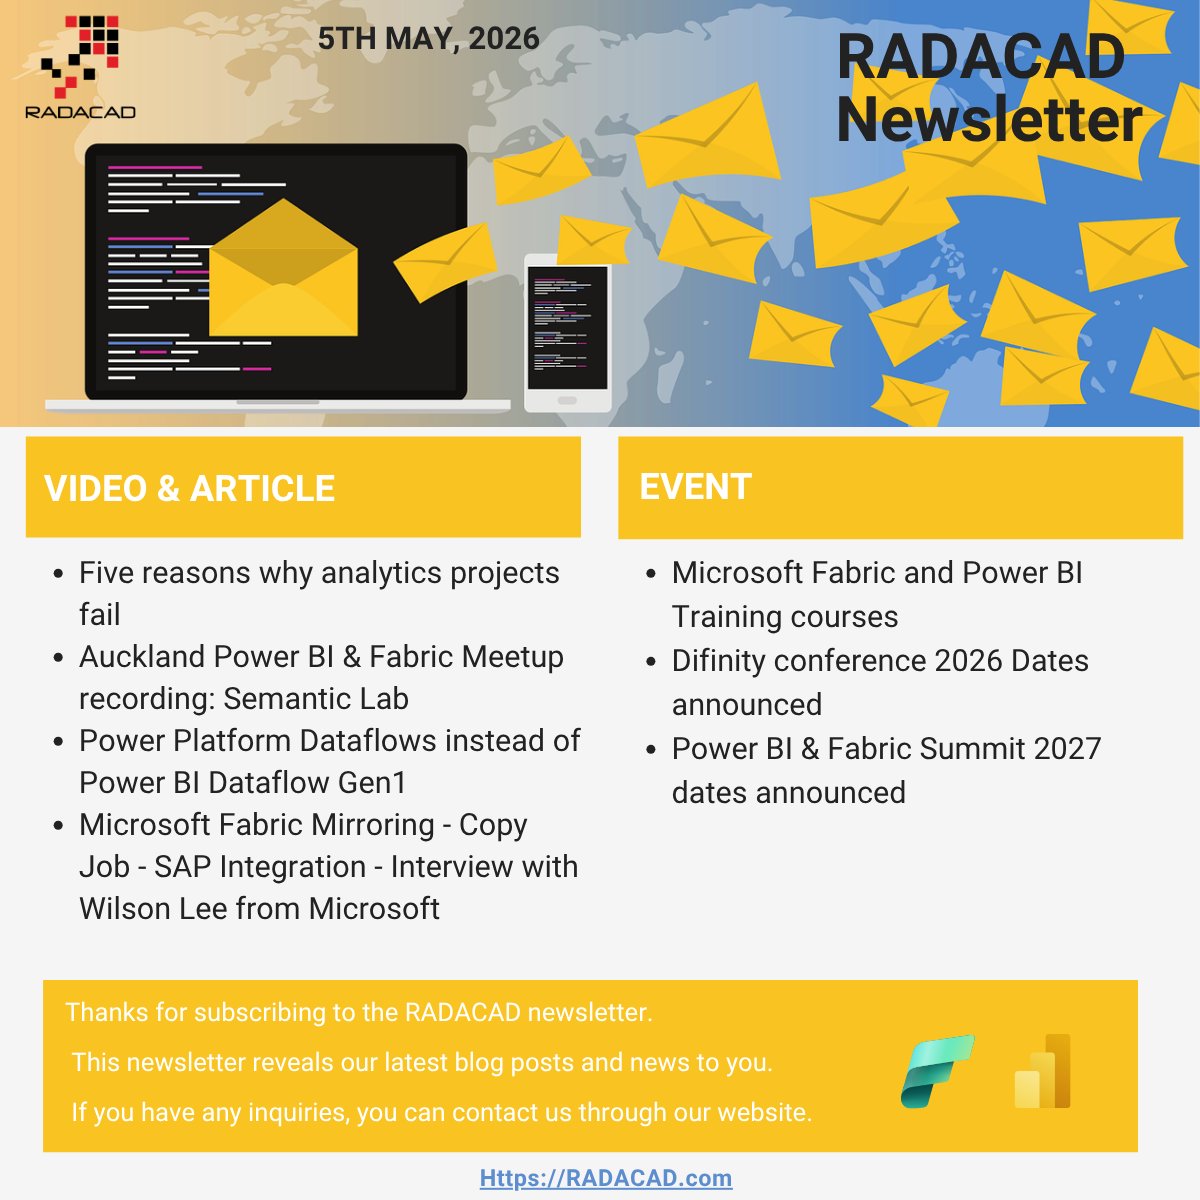
Most analytics projects don't fail because of bad data. They fail for reasons that are entirely preventable. 🚨
In the latest RADACAD newsletter, I cover exactly that — plus a full roundup of new videos, blog posts, Fabric news, and upcoming events (Summit 2027 dates are officially set!).
This month's highlights: ✅ The 5 reasons analytics projects fail (new video) ✅ Migrating Dataflows from Gen1 to Gen2 (or why Power Platform Dataflows might be your best move) ✅ Automating Microsoft Fabric with Semantic Link Labs ✅ FabCon updates: Mirroring, Copy Job, SAP Integration ✅ April 2026 Power BI & Fabric feature summaries
We send this newsletter every month — articles, videos, events, and news, all in one place.
📬 Subscribe so you never miss an edition.
👉 Read this month's edition here: radacad.activehosted.com/ind…
#PowerBI #MicrosoftFabric #RADACAD #DataAnalytics #Newsletter #DataEngineering #BusinessIntelligence #Dataflow #FabricAnalytics #MicrosoftData #DataPlatform #PowerBIDeveloper #FabCon #AnalyticsProjects #DataStrategy
2
2
78

Most analytics projects don't fail because of bad data. They fail for reasons that are entirely preventable. 🚨
In the latest RADACAD newsletter, I cover exactly that — plus a full roundup of new videos, blog posts, Fabric news, and upcoming events (Summit 2027 dates are officially set!).
This month's highlights: ✅ The 5 reasons analytics projects fail (new video) ✅ Migrating Dataflows from Gen1 to Gen2 (or why Power Platform Dataflows might be your best move) ✅ Automating Microsoft Fabric with Semantic Link Labs ✅ FabCon updates: Mirroring, Copy Job, SAP Integration ✅ April 2026 Power BI & Fabric feature summaries
We send this newsletter every month — articles, videos, events, and news, all in one place.
📬 Subscribe so you never miss an edition.
👉 Read this month's edition here: radacad.activehosted.com/ind…
#PowerBI #MicrosoftFabric #RADACAD #DataAnalytics #Newsletter #DataEngineering #BusinessIntelligence #Dataflow #FabricAnalytics #MicrosoftData #DataPlatform #PowerBIDeveloper #FabCon #AnalyticsProjects #DataStrategy

2
1
3
296

Apr 18
#Day2OfMyDataPortfolioRebuild
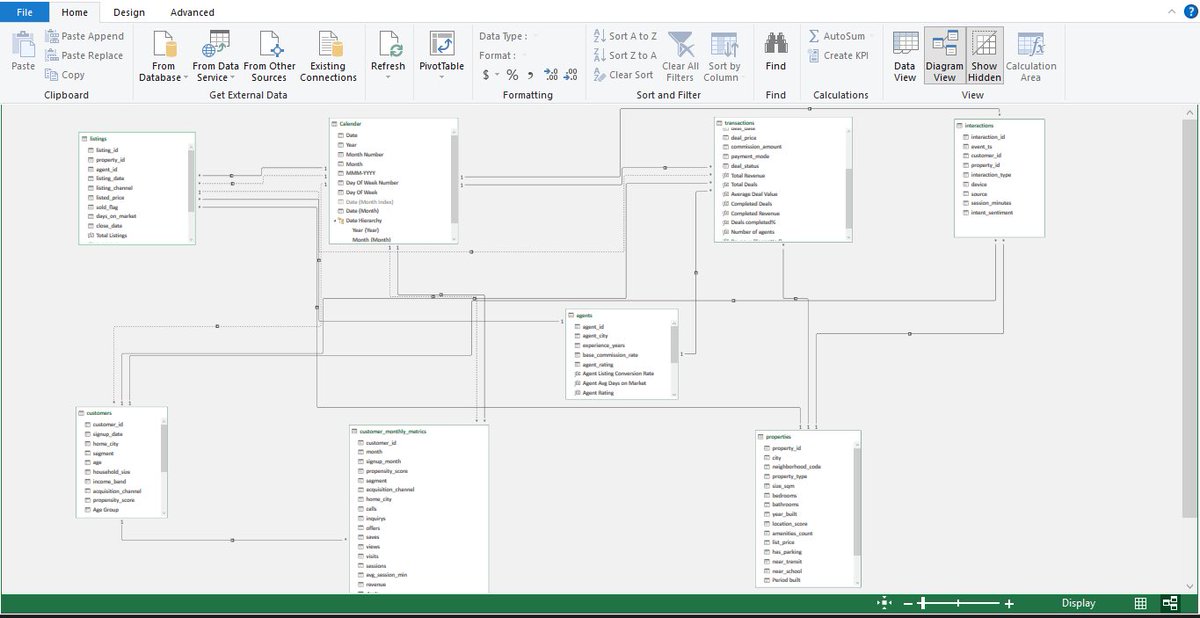
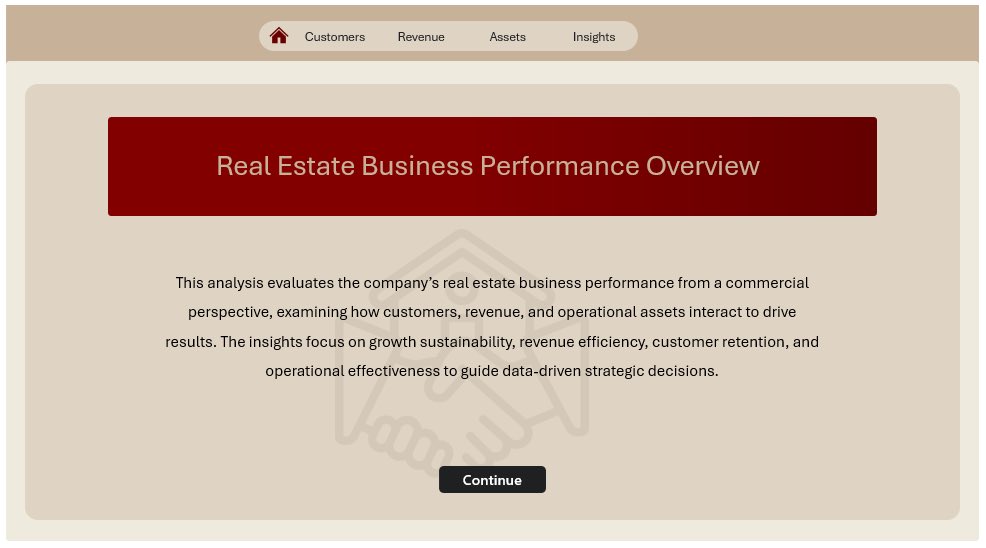
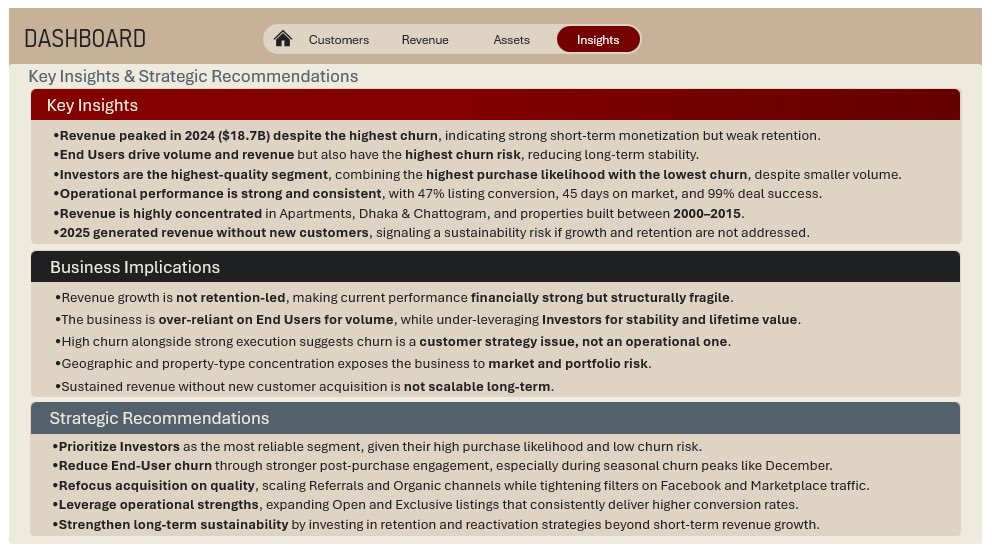
Today, I’m recapping the first project I built, a Real Estate Analysis Dashboard.
And no… real estate analysis is NOT just about property prices.
It’s about understanding:
- where value is hidden
- where money moves fast
and where opportunity actually exists
This project pushed me to go beyond charts… and build something that actually guides decisions.
Because the goal isn’t to impress with dashboards. It’s to make them useful.
If you’re building your data portfolio, this is your reminder: Don’t just show data. Show what to do with it.
Stick around for #Day3OfMyDataPortfolioRebuild
#DataAnalytics #PowerBI #DataPortfolio #RealEstate #DataStorytelling #AnalyticsProjects #BuildInPublic
4
7
38
1,512

Mar 19
We haven’t had a Community Project this month.
And if you’ve joined any of the previous ones, you already know this is not “just practice.”
We build real industry-level projects you can confidently add to your portfolio and talk about in interviews.
Now we’re stepping into the first long holiday of the year.
Perfect time to stop consuming and actually build.
I’m putting together a comprehensive HR Analytics Report using datasets that mirror real company data and tackle the exact pain points of stakeholders.
The kind recruiters and hiring managers actually respect.
If you’re serious about:
- Building a strong portfolio
- Moving from learning to execution
- Standing out in the data space
Then this is for you.
No spectators. Only builders.
Send me a DM to get the dataset and join.
#DataAnalytics #PowerBI #DataAnalyst #DataPortfolio #DataProjects #HRAnalytics #BusinessIntelligence #DataVisualization #LearnData #DataCommunity #AnalyticsProjects #SQL

2
7
283


A thread 🧵
📊 How this real estate analysis reminded me that data analysis is more than dashboards
What you see at the end is a clean set of dashboards.
What you don’t see is everything that had to work before that.
Here’s how this real estate analysis actually came together 👇
#DataAnalytics #Excel #PowerPivot #DAX #DataAnalysis #AnalyticsProjects #LearningInPublic #datafam

3
4
22
1,165

28 May 2025
Google Cloud rolls out new BigLake and BigQuery features to ease analytics projects #Technology #Business #Other #GoogleCloud #BigQuery #AnalyticsProjects
puretech.news/article?id=431…
1
2
33

25 Oct 2024
Building portfolio projects is the best thing that you can do if you are trying to land a role as a data analyst.
Let's discuss that in this thread!
#DataAnalyst #DataAnalytics #PortfolioProjects #DataScience #DataSkills #AnalyticsProjects #PracticalExperience #InterviewPrep #RecruitmentTips #DataDriven #CareerGrowth #DataAnalyticsUSA #USDataAnalyst #AnalyticsInAmerica #DataAnalyticsUK #UKDataAnalyst #BritishAnalytics #DataAnalyticsEU #EuropeanDataAnalyst #EuroDataScience

1
2
63

6 Jun 2023
In this blog, we delve into various perspectives of #ScopeCreep, exploring its positive aspects, potential drawbacks, and effective strategies for minimising its impact.
Discover more.
bit.ly/3CiAjDe
#AnalyticsProjects #PreventScopeCreep #ProjectManagement

2
30
23 May 2023
How do you make things easier for the #Stakeholders as well as yourself when kicking off an #AnalyticsProjects?
In this blog, we cover how to manage stakeholder expectations in analytics projects providing applicable solutions.
rb.gy/0b3p2
#SolutionsProvider

2
36

29 Nov 2022
I have the pleasure of teaching an #AppliedSociology doctoral course this semester at @GeorgiaStateU. The students have done tremendous work that has benefited @ShepherdCenter while they've developed new skills for #WhitePapers #PowerBIDashboards and #AnalyticsProjects
1
1
6
27 Sep 2022
What if I was to tell you that this was a good thing?
In this blog post, Ben Oastler explains why Analytics Scope Creep can be an opportunity.
bit.ly/3tmQQmh
#dataanalytics #businessproblems #analyticsprojects

2

25 Apr 2018
How Nissan Drove Users to Self-Service #Data #Analytics: informationweek.com/big-data… #customeranalytics #salesanalytics #dataanalytics #dataviz #datavisualization #selfserviceanalytics #advancedanalytics #analyticsprojects #datamanagement #tableau #bigdata #BI via @InformationWeek

1
1