
Jun 12
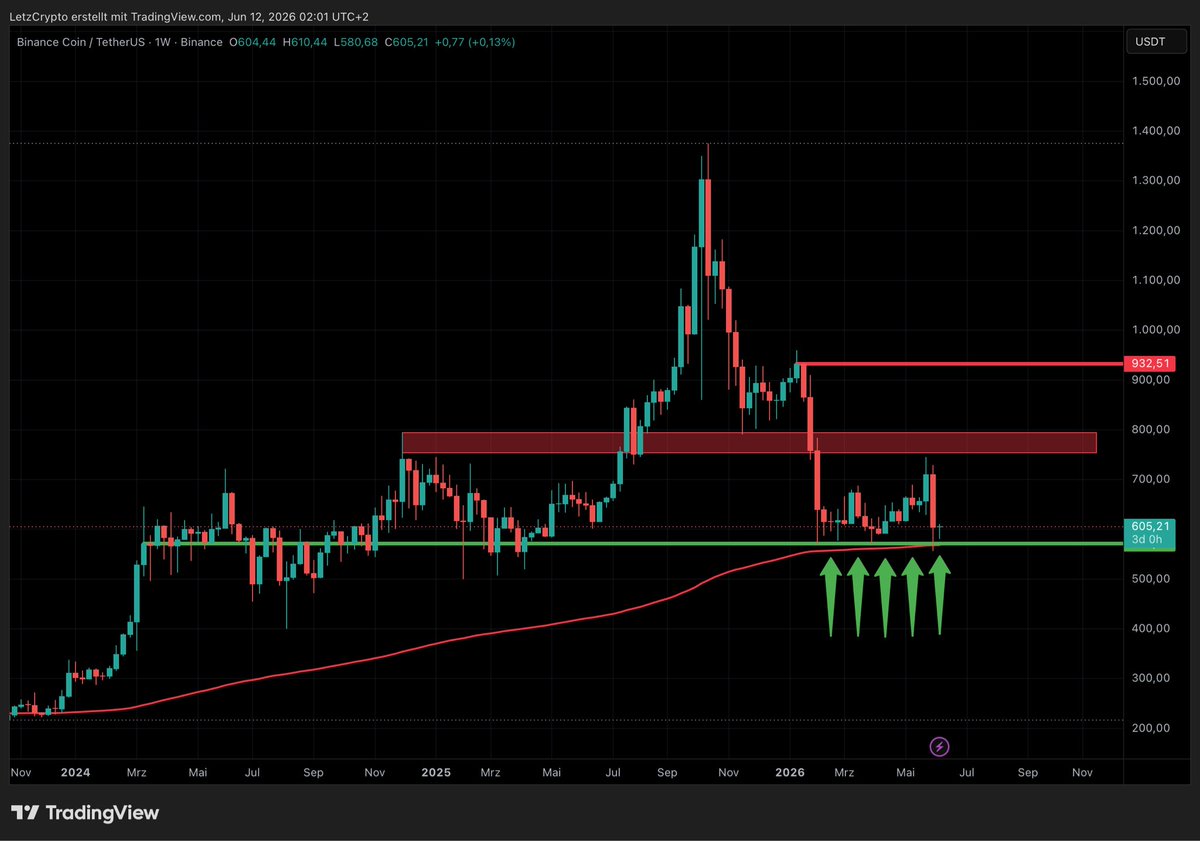
Nachdem der BNB Coin von Binance sein Allzeithoch bei 1.375 US Dollar erreicht hatte, korrigierte der Kurs um fast 60 % und fiel bis in den Bereich von 605 US Dollar zurück.
Genau dort traf der Kurs auf eine wichtige Unterstützungszone sowie auf die 200er Weekly EMA. Seit Ende Februar dieses Jahres liefert dieser Bereich den Käufern den nötigen Halt und verhindert bislang eine weitere größere Abwärtsbewegung.
Besonders interessant ist, dass BNB mittlerweile bereits den vierten Monat in Folge auf diesem Preisniveau konsolidiert. Je länger sich ein Markt an einer wichtigen Unterstützung stabilisieren kann, desto bedeutender wird diese Zone für die weitere Kursentwicklung.
Aktuell bleibt der Bereich um 605 US Dollar eine der wichtigsten Zonen im gesamten BNB Chart.
#BNB #BNBUSDT #MarketStructure #TechnicalAnalysis #PriceAction #Bullish #BottomFormation #EMA200 #WeeklyChart #CryptoTrading #MarketCycle
1
1
3
444
Jun 11
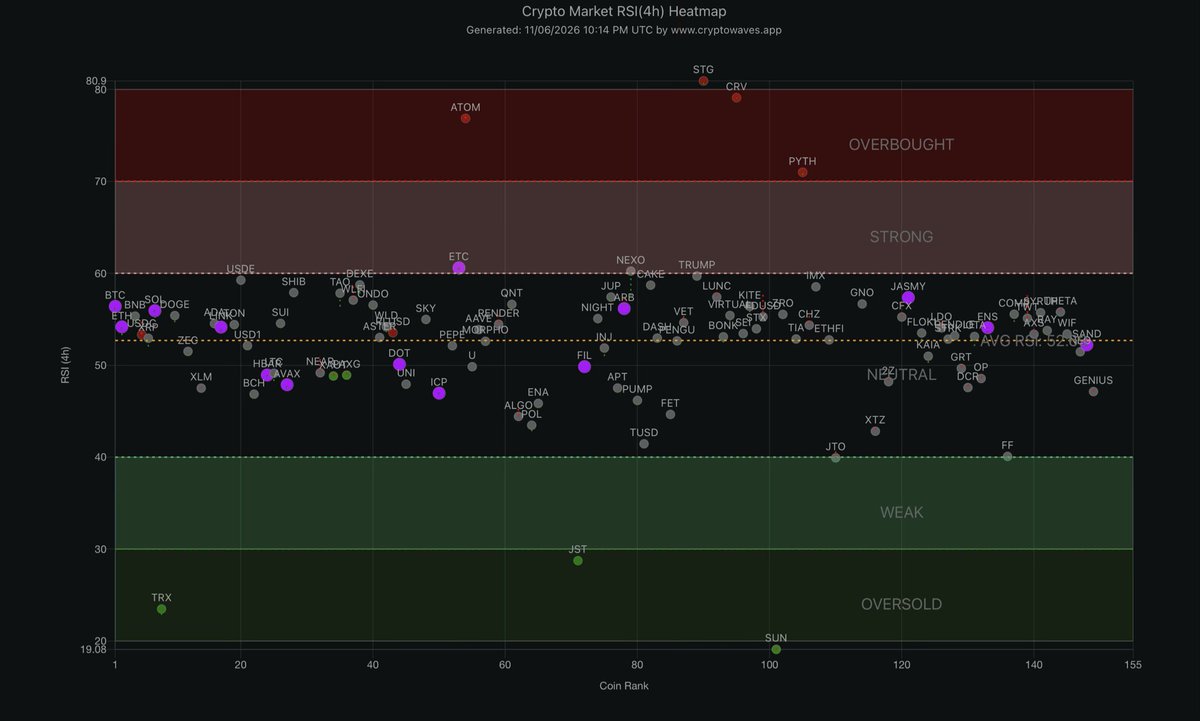
Die aktuelle 4H RSI Heatmap zeigt ein interessantes Bild.
Trotz der jüngsten Erholung befinden sich die meisten Coins weiterhin nur im neutralen Bereich. Von einer breiten Marktstärke oder gar Euphorie kann aktuell keine Rede sein.
Nur wenige Coins haben bereits den überkauften Bereich erreicht, während die Mehrheit noch immer um die wichtige 50er RSI Marke kämpft.
Das spricht dafür, dass der Markt zwar versucht, einen Boden auszubilden, eine echte Trendbestätigung aber noch aussteht.
#Bitcoin #BTC #Crypto #RSI #RSIHeatmap #TechnicalAnalysis #PriceAction #Liquidity #MarketStructure #BottomFormation #Bullish #Bearish #CryptoTrading #Altcoins
1
4
177
Jun 11
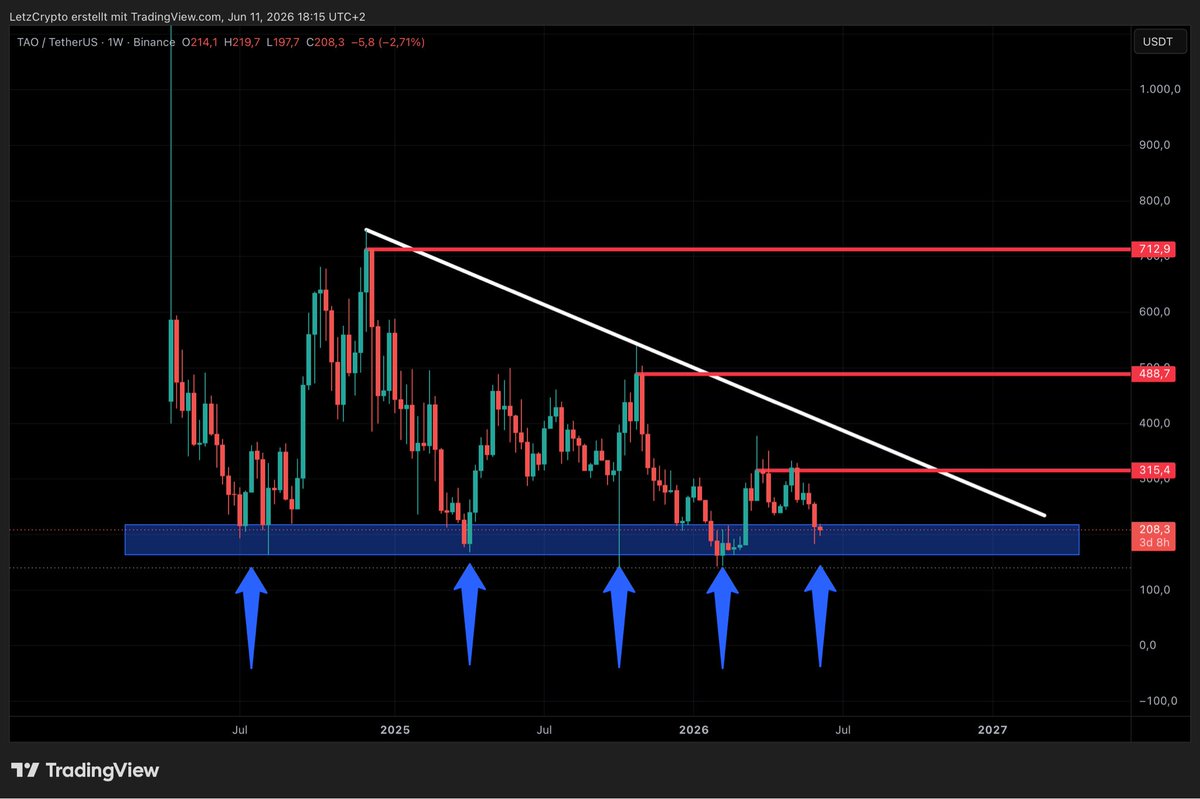
TAO sieht auf dem Weekly Chart aktuell eher nach einem großen Descending Triangle aus, was grundsätzlich als bearishes Muster gewertet werden kann.
Interessant ist jedoch, dass der Kurs in der Vergangenheit jedes Mal, wenn er die blaue Support Zone erreicht hat, wieder deutlich nach oben drehen konnte. Genau dieser Bereich hat sich mehrfach als attraktive Kaufzone erwiesen und wurde von den Käufern konsequent verteidigt.
Die entscheidende Frage lautet nun:
Wird sich die Geschichte erneut wiederholen und die blaue Box dem Kurs wieder den nötigen Support liefern?
Oder erleben wir diesmal einen nachhaltigen Bruch nach unten, wodurch das Descending Triangle aktiviert wird und eine größere Abwärtsbewegung folgen könnte?
Aktuell befindet sich TAO damit an einer äußerst spannenden Stelle im Chart. Die Reaktion des Kurses an dieser Unterstützung dürfte richtungsweisend für die kommenden Wochen werden.
Wie seht ihr die Situation?
Hält die blaue Support-Zone erneut stand?
Oder steht TAO vor dem Ausbruch nach unten?
Schreibt eure Meinung gerne in die Kommentare. 👇
#TAO #Bittensor #AI #TechnicalAnalysis #PriceAction #Liquidity #MarketStructure #Bullish #Bearish #BottomFormation #DescendingTriangle #Trading #CryptoTrading #Altcoins
2
1
5
679
Jun 11
Bitcoin Langzeitprognose Monatschart
Wenn wir uns den Bitcoin Monatschart genauer anschauen, fällt eine interessante Struktur auf.
Die erste große Aufwärtsbewegung begann am Tiefpunkt des Jahres 2019 und führte schließlich bis zum Allzeithoch im Jahr 2021.
Anschließend betrachten wir die zweite Aufwärtsbewegung. Hier habe ich dieselbe Box der ersten Bewegung kopiert und vom Allzeithoch 2021 bis zum aktuellen Allzeithoch 2025 angelegt. Interessanterweise passt diese Struktur nahezu eins zu eins auf den aktuellen Zyklus.
Gehen wir nun einen Schritt weiter und kopieren dieselbe Bewegung ein weiteres Mal.
Dazu wird die Box der zweiten Aufwärtsbewegung ab dem Allzeithoch 2025 erneut angesetzt und in die Zukunft projiziert. Da zwischen dem Allzeithoch 2021 und dem Allzeithoch 2025 rund vier Jahre vergangen sind, wäre es durchaus denkbar, dass sich auch der nächste Zyklus über einen ähnlichen Zeitraum erstreckt und sein Hoch im Jahr 2029 ausbildet.
Folgt Bitcoin weiterhin dieser historischen Struktur, würde dies vom aktuellen Kursniveau aus einem Anstieg von rund 210 % entsprechen.
Das daraus abgeleitete Kursziel für das potenzielle Allzeithoch im Jahr 2029 läge bei ungefähr 180.000 US-Dollar.
Natürlich handelt es sich dabei nicht um eine Vorhersage, sondern lediglich um eine Projektion auf Basis der bisherigen Marktzyklen. Dennoch erscheint dieses Szenario aus heutiger Sicht durchaus plausibel und realistisch, insbesondere wenn Bitcoin seinen langfristigen Wachstumstrend fortsetzen kann.
Wie seht ihr das?
Haltet ihr einen Bitcoin Kurs von 180.000 US Dollar bis 2029 für realistisch?
Oder erwartet ihr deutlich höhere beziehungsweise niedrigere Kursziele?
Schreibt eure Meinung gerne in die Kommentare. 👇
#Bitcoin #BTC #BTCUSD #MarketCycle #Bullish #Bearish #BottomFormation #TechnicalAnalysis #PriceAction #Liquidity #MarketStructure #Trading #OnChain #BitcoinAnalysis #LongTerm #Long #ATH2029

4
6
3,503

Feb 12
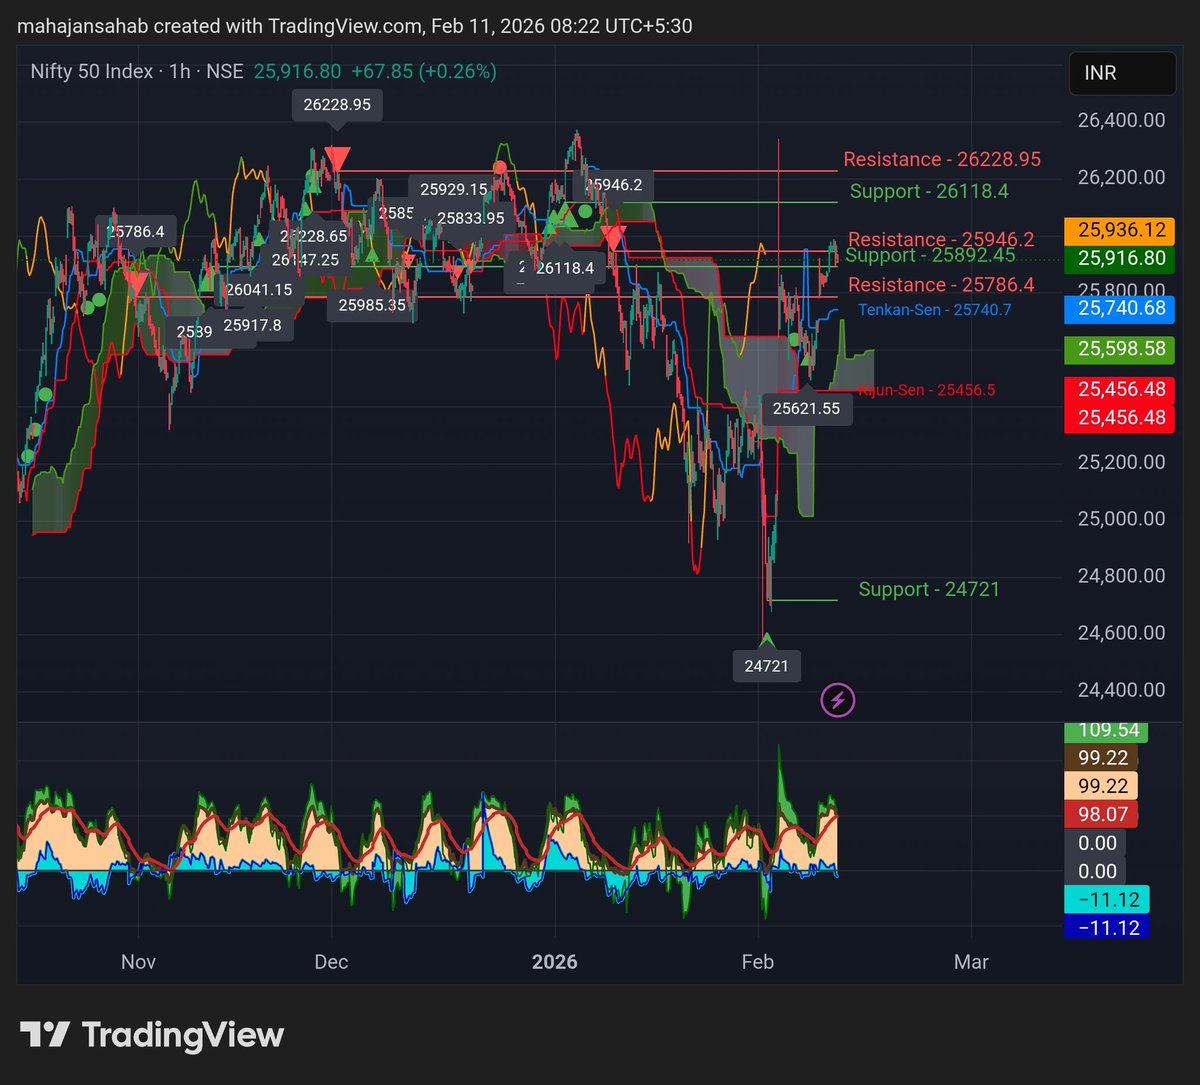
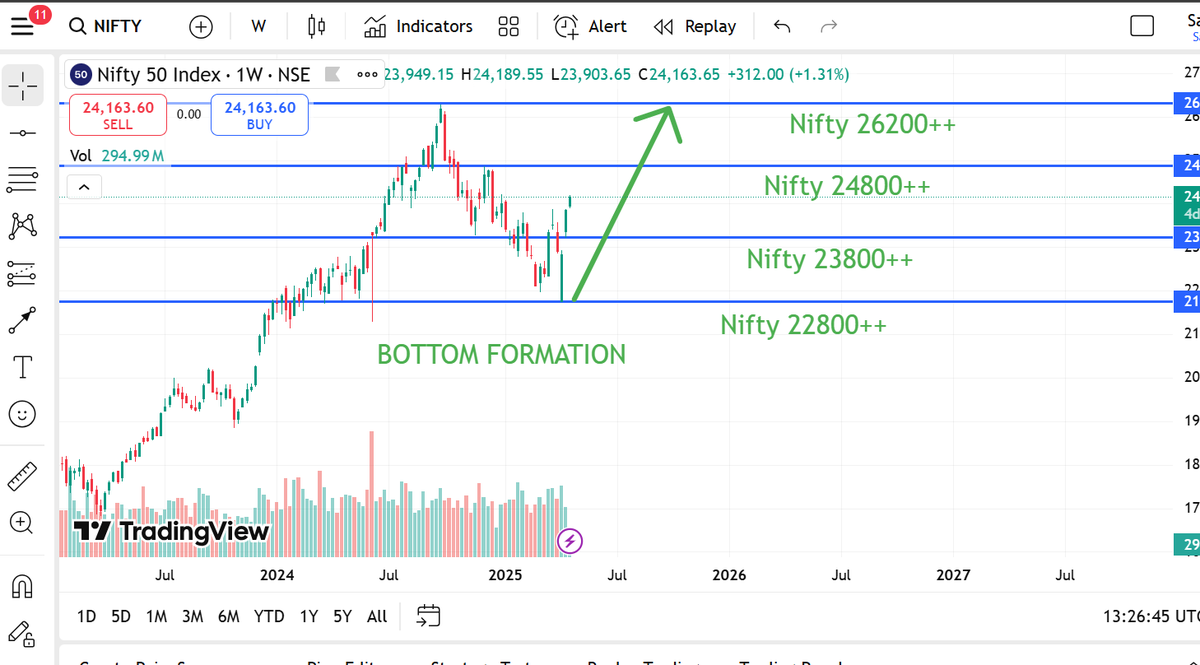
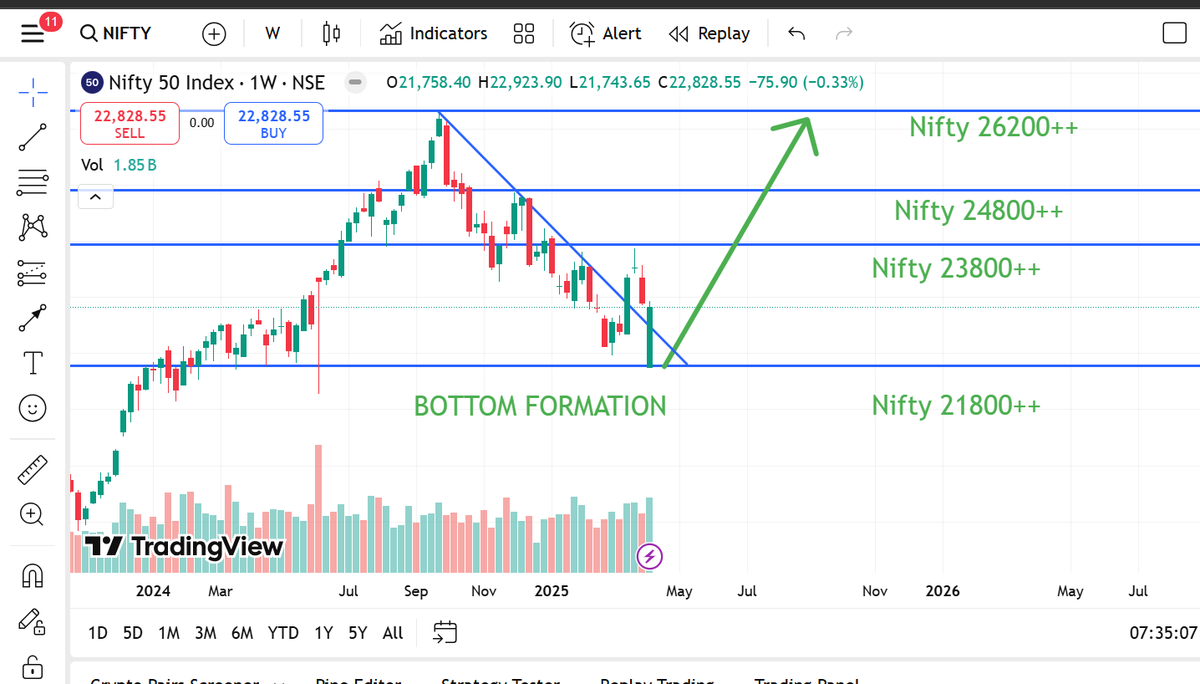
#Nifty Update: First Signs of Bottom Formation Around 25,750 – Phase 1 Complete, Full Completion Pending.
As anticipated, Nifty is showing initial signs of bottoming near the 25,750 zone. The first phase of support building appears to have concluded, with selling pressure easing and price stabilizing in the 25,800–25,900 range today.
Kuber analysis: Expect a near-term rise (potential relief bounce) followed by a secondary fall to fully complete bottom formation. Once that structure holds, breakout above 26,000 becomes feasible, with extension toward 26,300 possible if momentum confirms.
Not 100% confirmed yet—monitor closely for reversal candles or volume pickup on upside tests. Overall bias cautiously constructive once bottom solidifies.
#Nifty #Nifty50 #NiftyOptions #OptionsTrading #BankNifty #StockMarketIndia #NiftyBank #FNO #NSEIndia #GiftNifty #IndianStockMarket #NiftyTrading #TechnicalAnalysis #BottomFormation #BullRun
Feb 11

#Nifty Pre-Open Caution: #GIFTNifty Sideways to Slightly Downward – Trade Carefully
GIFT Nifty currently trading flat to mildly negative premium (range-bound with soft downward tilt), suggesting a neutral-to-lower open compared to recent momentum.
Kuber view: This indicates short-term digestion or hesitation after the prior gap-up phases. No clear directional edge yet—volatility likely to remain elevated intraday.
Advice: Trade carefully today. Avoid aggressive directional bets below 26010; focus on defined-risk setups, tight stops, and wait for a confirmed move (breakout or breakdown) before scaling. Protect capital first.
#Nifty #Nifty50 #NiftyOptions #OptionsTrading #BankNifty #StockMarketIndia #NiftyBank #FNO #NSEIndia #GiftNifty #IndianStockMarket #NiftyTrading #TechnicalAnalysis #IntradayTrading #RiskManagement
3
125
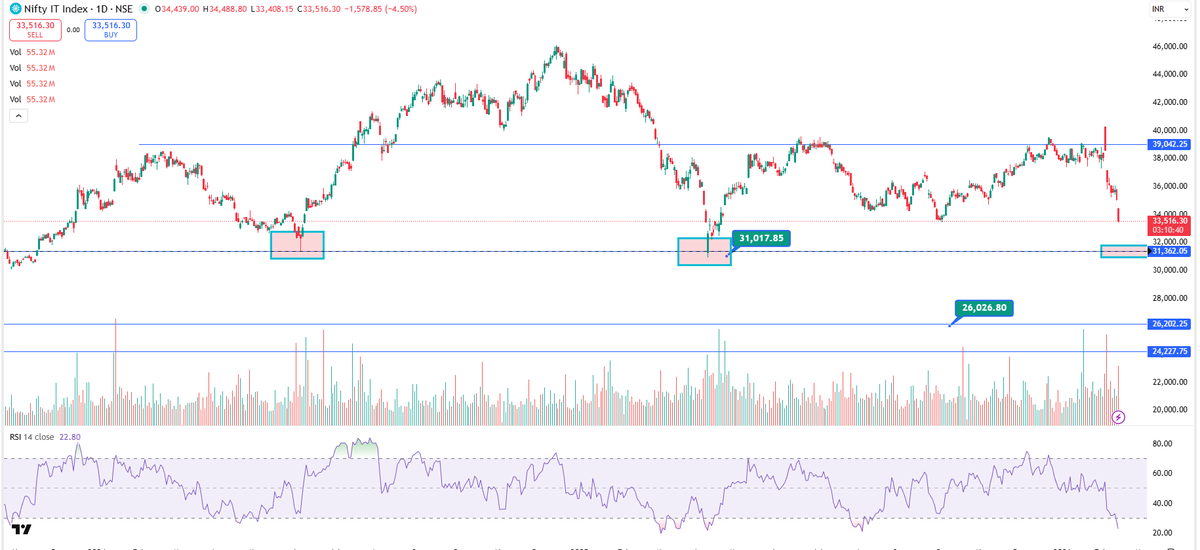
#NIFTY IT
High Panic से ही Bottom बनता है।
अगर एक और तेज गिरावट आए
और 31360 का लेवल बच जाए,
तो वहीं से Bottom कन्फर्म माना जाएगा।
लेकिन अगर 31360 decisively टूट गया,
तो फिर अगली असली और तेज गिरावट के लिए तैयार रहना होगा।
डर के माहौल में ही स्मार्ट मनी मौके ढूंढती है।
जहाँ भीड़ घबराती है, वहीं बड़े खिलाड़ी accumulation करते हैं।
मार्केट में भावनाओं से नहीं,
लेवल और प्राइस एक्शन से फैसला होता है।
जय केदार 🙏
यह कोई निवेश सलाह नहीं है।
#MarketCrash #BottomFormation #PriceAction #StockMarket
All stocks/securities discussed are purely for educational and informational purposes only and do not constitute any buy/sell/hold recommendation.
Join your channel: t.me/PankajJain_EYE
📢 For risk disclosures, disclaimers, MITC, investor charter, grievances, and more, please visit: eyeontrade.com
1
5
45
7,494

📌Become a Master Trader: prorsi.com/mentorship
The momentum move captured on crude oil did not happen randomly.
Strong trends begin only after proper bottom formation, and RSI plays a key role in identifying that shift 📈
In this live session with master traders, we break down how the momentum move captured on crude oil was identified early using RSI behavior, price structure, and moving average alignment. The same logic applies to commodities and stocks when real bottoms are forming.
This momentum move captured on crude oil analysis explains why RSI divergence, RSI range shift, and momentum expansion matter more than guessing reversals. You will see how professionals wait for confirmation instead of catching falling knives.
Professional traders rely on momentum move captured on crude oil type setups to enter trends early, manage risk properly, and stay in trades longer once momentum confirms.
This is not hindsight analysis.
This is momentum move captured on crude oil explained with real-time logic and professional discussion ⚡
Relevant for traders, swing traders, and investors tracking commodities and equities.
WHAT THIS VIDEO COVERS
✅ How the momentum move captured on crude oil started
✅ Why RSI is critical for bottom detection
✅ How commodities form bottoms before trends begin
✅ How stocks show similar bottoming behavior
✅ RSI range shift and momentum expansion logic
✅ Role of moving averages in trend confirmation
✅ How professionals avoid premature bottom calls
✅ Live discussion with master traders
✅ Real chart examples of momentum move captured on crude oil
✅ How to apply this method to other markets
YOU WILL LEARN
✅ How to identify momentum move captured on crude oil setups
✅ How RSI confirms real bottoms in commodities
✅ How to detect bottom formation in stocks
✅ How professionals time momentum expansion
✅ How to avoid false reversals
✅ How to trade bottoms with confirmation and confidence
ENGAGEMENT
LIKE if you trade commodities
COMMENT: Do you use RSI for bottom detection?
SUBSCRIBE for live sessions and professional market analysis
SHARE with traders learning momentum trading
#MomentumMoveCapturedOnCrudeOil #CrudeOil #MomentumTrading #RSI #CommodityTrading #BottomFormation #PriceAction #ProfessionalTrading #StockMarket #LiveTrading #SmartMoney #TechnicalAnalysis #ProTrader #TradingStrategy
3
15
2,574

Ethereum Finds Bottom At Three-One-Six-Five After Dramatic Capitulation 2025 11 05 // zurl.co/raU71 // #Ethereum #CryptoCapitulation #TechnicalAnalysis #BottomFormation #InstitutionalAccumulation #CryptoRecovery

ALT #Ethereum #CryptoCapitulation #TechnicalAnalysis #BottomFormation #InstitutionalAccumulation #CryptoRecovery
1
15

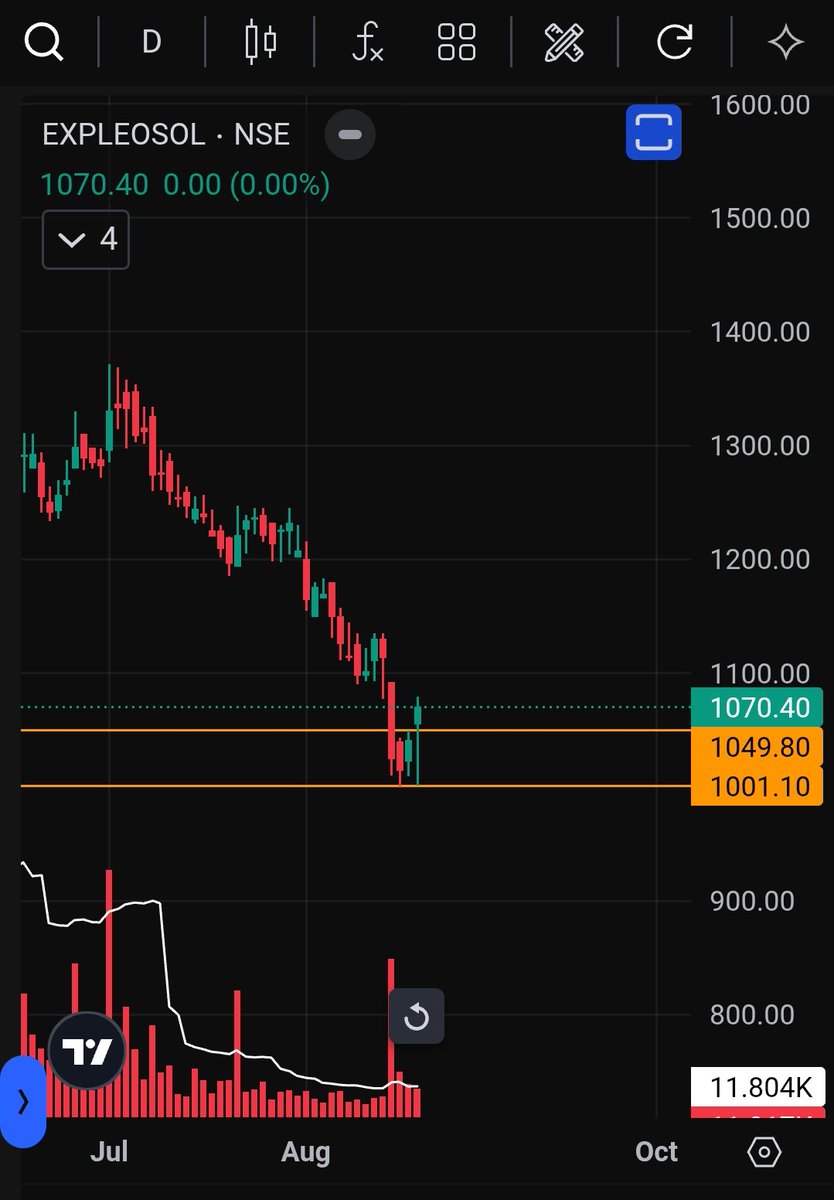
It seems like the bottom formation of #EXPLEOSOL is complete.
CMP: 1070
One can trade with a stop-loss at 999.
The short-term targets are 1130, 1180 & 1244
Trailing the targets would be the best idea.
#StockMarket #NSEStocks #TradingSetup #TechnicalAnalysis #BottomFormation #SwingTrade #TradeWithSL #ShortTermTargets
1
2
229

3 Aug 2025
Every major bottoming phase follows nearly the same script:
A small bounce → people think the bottom is in and open early longs
→ price dumps again
→ another bounce, a bit stronger, often breaking minor structure on low timeframes
→ final shakeout: fast, sharp, instantly bought up → straight into upward momentum.
Many know this pattern as the 3-drive pattern
In Elliott Wave terms, it’s the 4-5-4-5 wave sequence.
#Crypto #BottomFormation #ElliottWave #3DrivePattern #BTC #Altcoins
9
707

25 Apr 2025
Warren Buffett said "Be greedy when others are fearful" #bullrun2025 #buyondips
#Bottomformation has happened #nifty50 #NIFTYIT #banknifty
Upside #bullish rally has come in #nifty
#dowjones #nasdaq #bitcoin #BULL @_anujsinghal @AnilSinghvi_ @virendraonNifty @sanjiv_bhasin
3
904
22 Apr 2025
Warren Buffett had said "Be greedy when others are fearful"
#Bottomformation has happened in #nifty50 #NIFTYIT #banknifty
Upside #bullish rally has come in #nifty #banknifty in April 2025 month
#bullrun2025 #buyondips #dowjones #nasdaq #bitcoin #bull #spx #BULL #bullish view
2
380
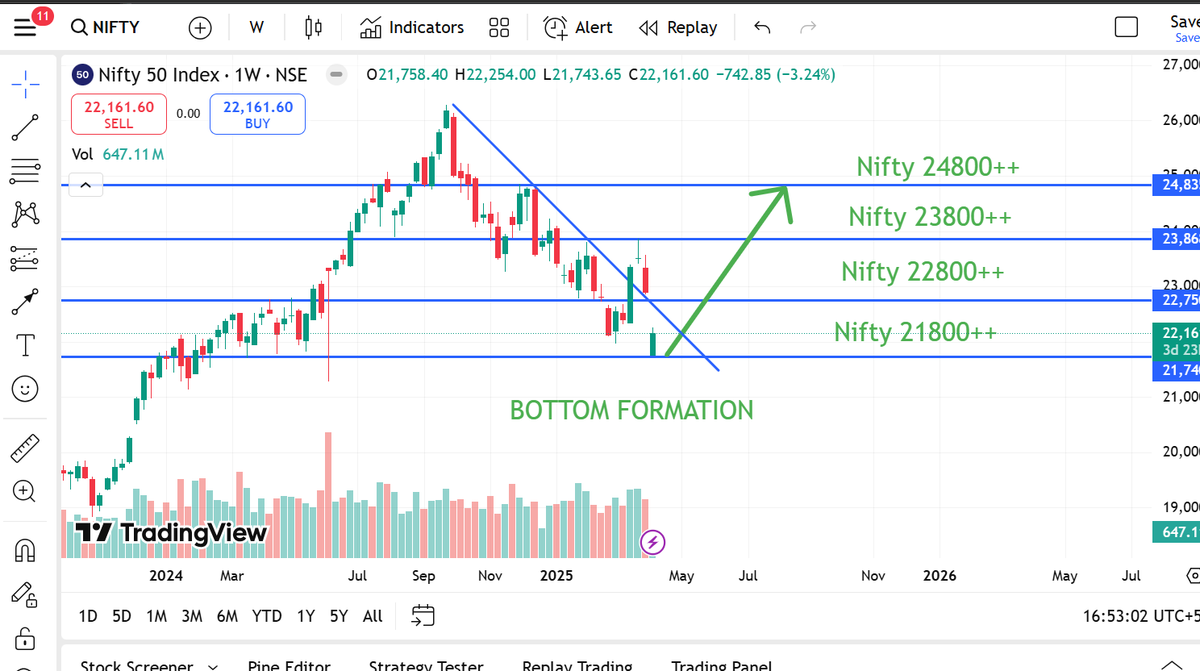
21 Apr 2025
#Bottomformation has happened in #nifty50 #NIFTYIT #banknifty
Upside #bullish rally has come in #nifty #banknifty in the April 2025 month
Warren Buffett said Be greedy when others are fearful
#bullrun2025 #buyondips #dowjones #nasdaq #bitcoin #bull #spx #BULL #bullish view
2
208
12 Apr 2025
Warren Buffett said " Be greedy when others are fearful "
Upside #bullish rally may come in #nifty #banknifty by end of April 2025 month
#Bottomformation may happen in #nifty50 #buyondips
#dowjones #nasdaq #spx #bullrun2025 #BULL #bullish view
5
2
8
3,000
7 Apr 2025
Warren Buffett had said " Be greedy when others are fearful "
Upside #bullish rally may come in #nifty #banknifty by end of April 2025 month
#Bottomformation may happen in #nifty50 #NIFTYIT
#bullrun2025 #buyondips #dowjones #nasdaq #bitcoin #bull #spx #BULL #bullish view
2
354

6 Apr 2025
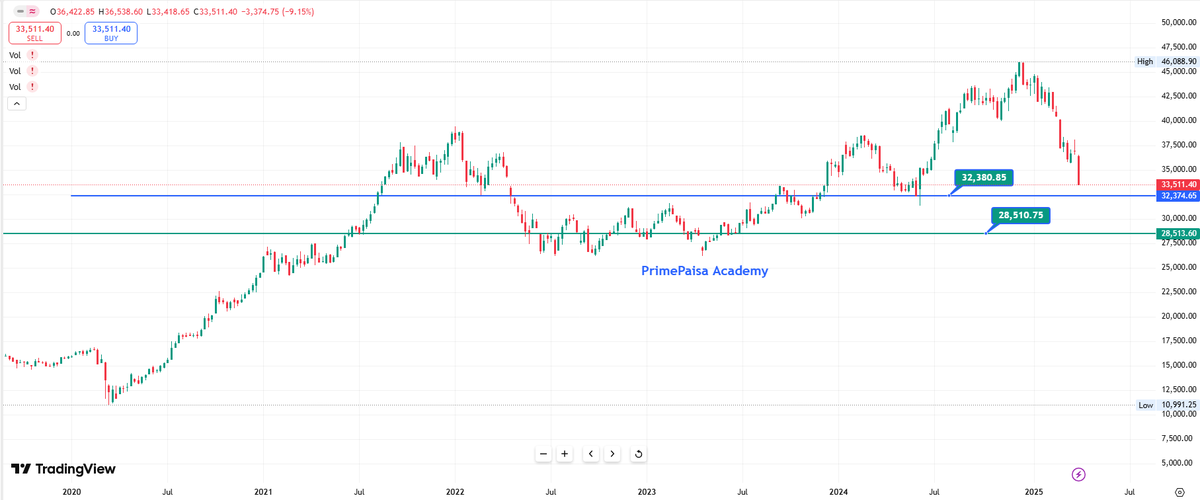
📈 "पिक पे ज्ञान, बॉटम पे डर"
→ मार्केट की यही psychology है –
NIFTY IT ये दोनों नंबर जो आप चार्ट पे देख रहे हैं , ये दोनों बेहद महत्वपूर्ण हैं , वीकली क्लोजिंग आधार पे साथ ही महीने की क्लोजिंग आधार पे 32380 बहुत महत्वपूर्ण हैं , इसको अगर तोड़ा महीने की क्लोजिंग में तो हमारे तुके से ये 28300 के आस पास आ सकता है !!
🧘♂️ "पढ़ाई करो, ऑब्ज़र्व करो, अनुभव लो, आगे बढ़ो"
→ ये तो किसी trader’s धर्म की तरह लाइन है। सच्चा ट्रेडर "फॉलो नहीं", observe करता है।
IT INDEX
जल्द ही हर कोई इस पे वीडियो बनाएगा...
और हर जगह सिर्फ नेगेटिव, नेगेटिव, नेगेटिव सुनाई देगा।
ठीक वैसे ही,
जैसे 2022 में हुआ था।
अब टेक्निकली तुक्के में जब ये पिक पर होगा
और हर जगह इसपे ज्ञान दिया जाएगा कि
"ये सेक्टर खत्म हो गया"...
वहीं से ये बॉटमिंग फॉर्मेशन शुरू करेगा।
बाकी –
"सबा मोह माया है!" 😌
#ITIndex
#StockMarketIndia
#TradingPsychology
#MarketSentiment
#TechnicalAnalysis
#SmartMoney
#ContrarianThinking
#BottomFormation
#BearMarketToBull
#ObserveAndTrade
#FinancialDiscipline
#LongTermVision
#StockMarketReality
#IndianStockMarket
#सबमोहमाया
#TradeWisely
#InvestSmart
#KnowledgeIsPower
#MarketKaSach
#MindsetMatters
5
448

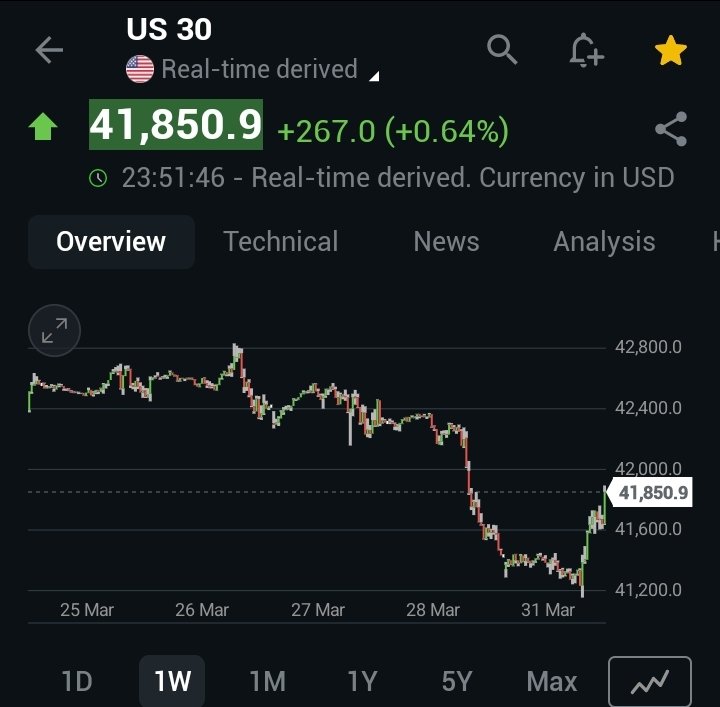
31 Mar 2025
🚨 US Stock Market Outlook – April 2025 Astrological Insights 🔮
बकचोदी of Trade War & Tariff has been discounted. As we enter April 2025, the US stock market faces a phase of high volatility and strategic growth opportunities. Here’s an astrological breakdown of the trends ahead:
---
🔹 Jupiter in Aries → Bullish for Tech & AI 🚀
Tech and AI stocks are set for growth as Jupiter stimulates innovation. Watch for strong rallies, but be cautious of speculative bubbles.
Bullish Probability: 70%
🔹 Saturn in Aquarius → Bearish for Banking & Crypto ⚖️
Saturn brings regulatory challenges to banking and crypto, likely slowing their growth.
Bearish Probability: 65%
🔹 Rahu in Pisces → High Volatility & Speculative Excess 🎭
Rahu stirs speculative excess, causing market corrections and sharp volatility.
Volatility Probability: 80%
🔹 Venus-Mars in Taurus → Bullish for Commodities & Energy 💰
The Venus-Mars alignment boosts commodities like oil, gas, and precious metals, making them a safe haven amid broader market uncertainty.
Bullish Probability: 75%
---
Market Bottoms – March & April Analysis
🔹 March 2025 – Possible Bottom Formation 🕳️
Rahu’s influence and Saturn’s aspects likely created a bottom in March, with market consolidation occurring.
Probability March marked the bottom: 75%
🔹 April 2025 – Another Bottom Possible? 🔄
While March was likely the bottom, April still holds a 50% chance of another brief dip, driven by speculative excess or negative economic data.
---
Overall Sentiment for April 2025
Bullish: Tech, AI, Commodities
Bearish: Banking, Crypto
Volatility will dominate, especially in speculative sectors.
---
💡 Strategy:
Focus on growth sectors like Tech & AI, but be wary of speculative stocks. Hedge with commodities and safe-haven assets like gold.
📌 #USStockMarket #AstroTrading #TechStocks #Commodities #EnergyMarket #Volatility #EconomicShift #BottomFormation
1
3
18
11,136
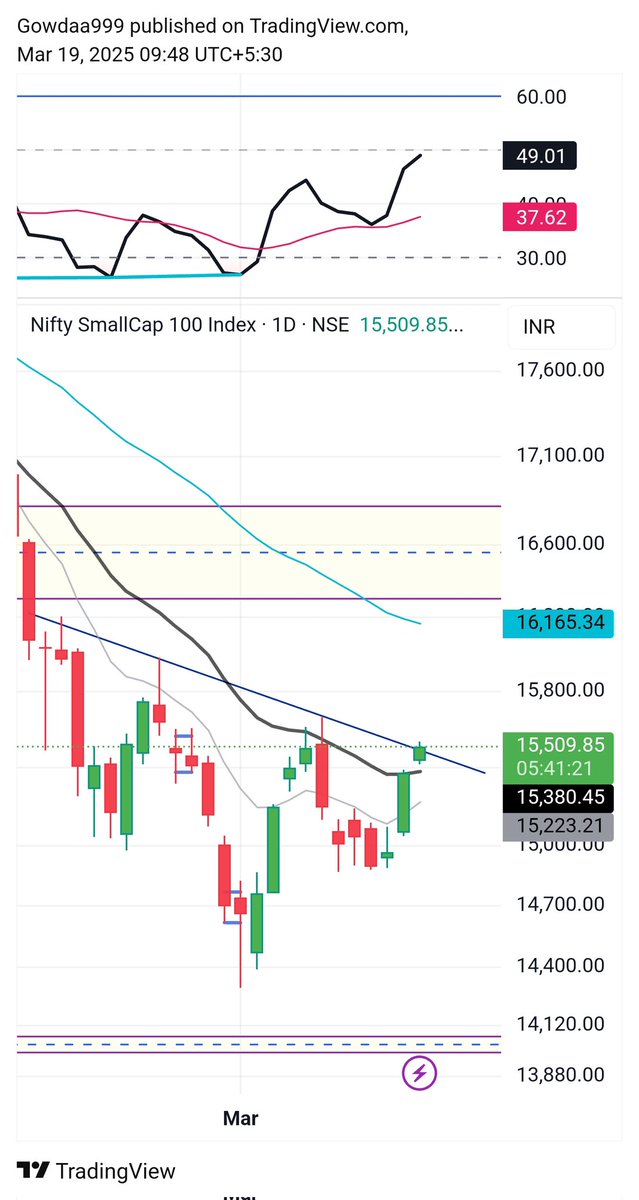
19 Mar 2025
#Nifty Smallcap 100 #CNXSMALLCAP
📉🔥 3 मार्च को ही संकेत दिया था:
👉 स्मॉल कैप में बॉटम बनने के संकेत मिले थे, और अब इस हफ्ते की क्लोजिंग में इसका कन्फर्मेशन हो जाएगा। 🚀📊
👉 अगर क्लोजिंग पॉजिटिव होती है, तो स्मॉल कैप में बॉटम कन्फर्म हो जाएगा और एक संभावित अपसाइड का रास्ता खुलेगा। 📈🔥
💥 जय राम जी की! 💥 🙏🚀
#SmallCapStocks #BottomFormation #StockMarketInsights #TradingSignals #PriceAction #TechnicalAnalysis #WealthCreation 💹📊
3
6
727

19 Mar 2025
Small Cap Index👑
Base formation & breakout sustainability is the 🗝️
Once it's a clear indication, good buying will be seen✨
#smallcap #bottomformation #breakout #stockmarket
19 Mar 2025

Small cap - sweet break out!!
Will this sustain is a big question
1
1
5
723

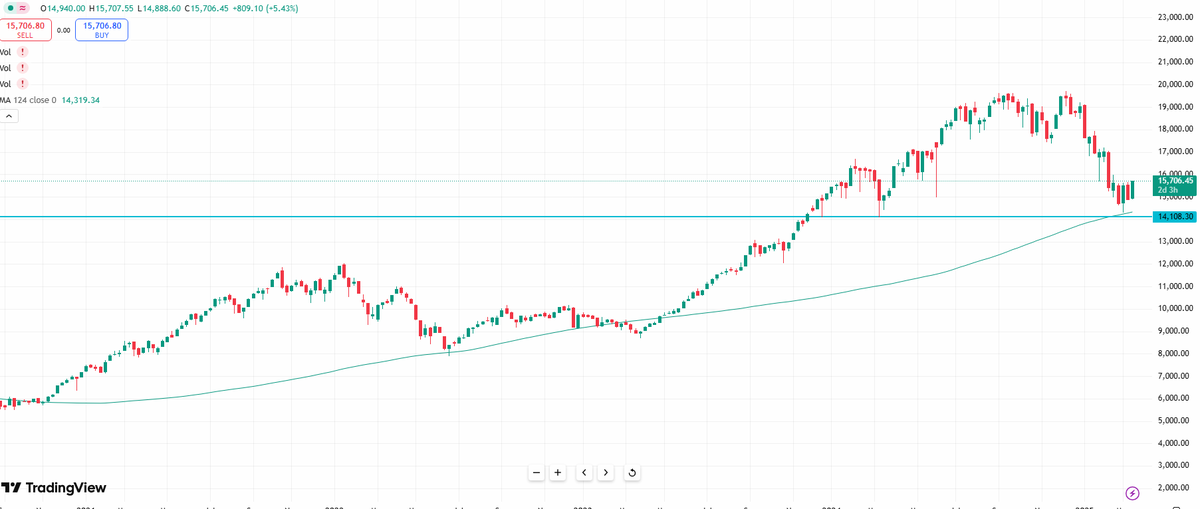
3 Mar 2025
I am tracking #CurrentFreeFallMarket from 14/02/2025 to identify #BottomFormation based overall #MarketData
My opinions:
#IdealBottom, F3~80%; Done 😢
#PerfectBottom,F3 ~ 85% ( Yet to reach here 😭)
#WorstBottom, F3~90%, #DeadBulls🐂 & #BearDance🩸🩸🐻 🐻
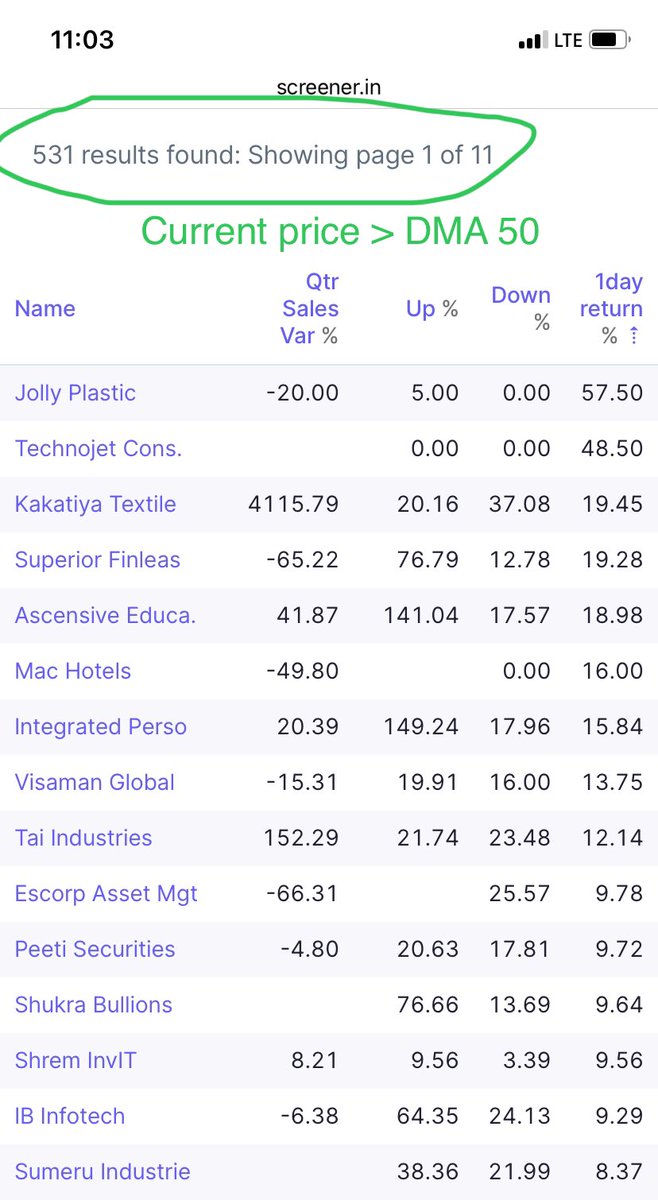
3 Mar 2025

Our #CurrentMarketStatus:
Findings:
Out of 4945 active stocks :
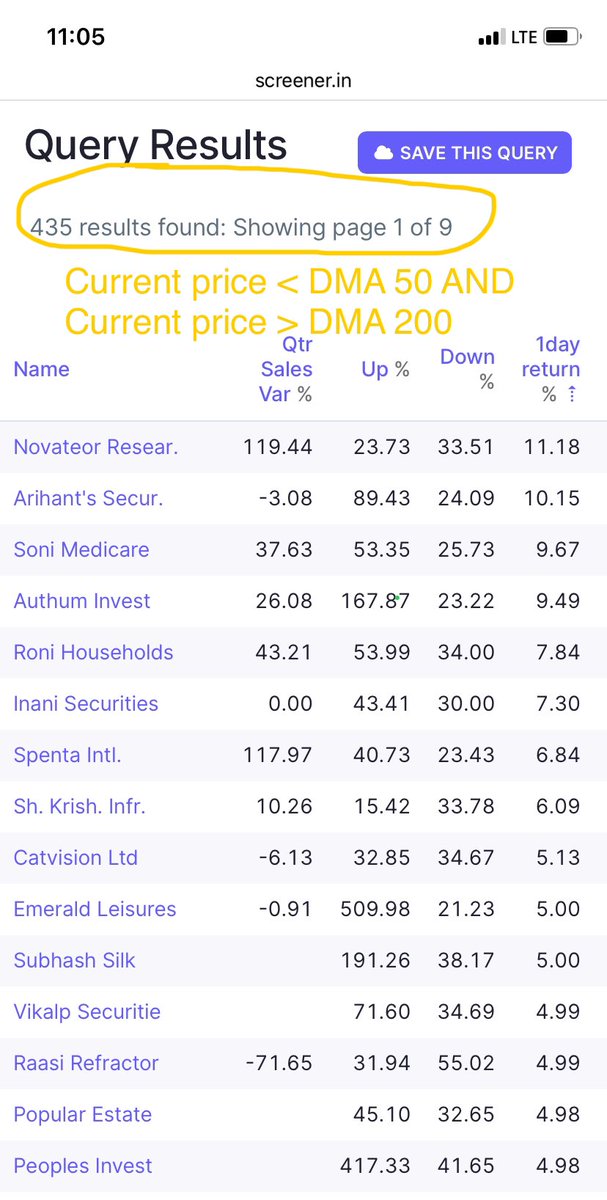
F1~10.74% [CMP >DMA50]
F2~10.93% [CMP < DMA50 & CMP > DMA200]
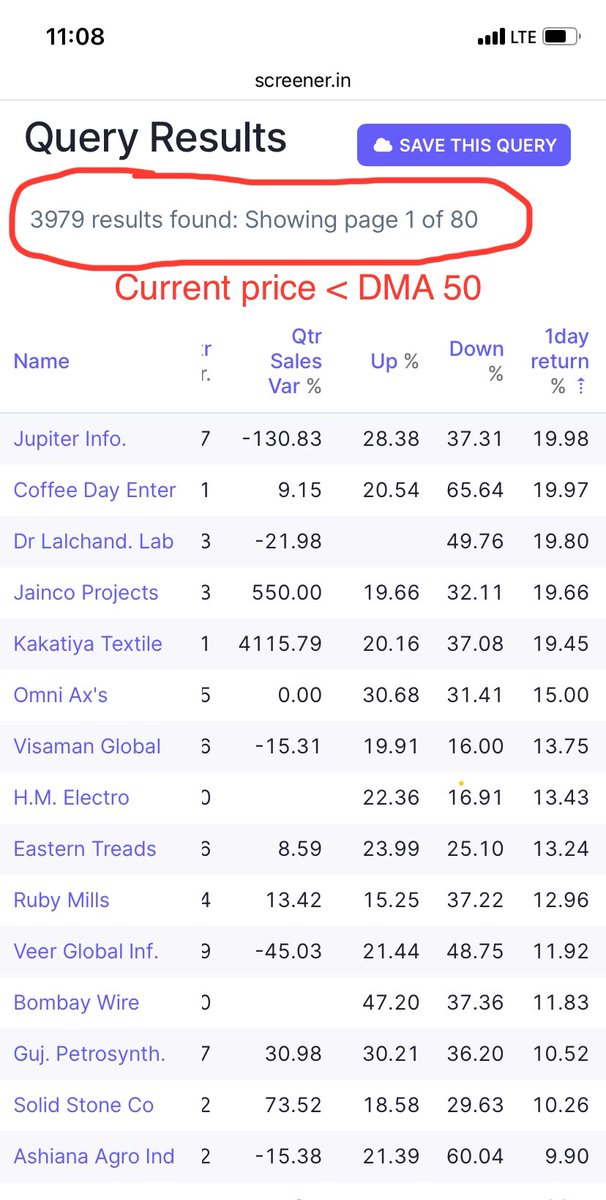
𝗙𝟯~80.46% [CMP<DMA200]
Today is the #WorstDay of 2025 & we reached at #IdealBottom as 𝐅𝟑 ~ 𝟖𝟎% .
#LearnTechnoFundaAnalysis
2
517