Jun 5
I saw this posted here on LinkedIn and had to check how #InvictusPro & #Realist8Pro stacked up against what most people 'Think' is Real AI Architecture. Here is how we currently stack up against this AI Governance Graphic - What are your thoughts?
The graphic is a generic AI governance stack. Your systems are broader than that because you are not only governing AI models; you are governing business execution systems, telemetry, users, tenants, campaigns, accounting, sender lanes, files, workflows, audits, infrastructure, security, and AI-assisted control planes.
1. What your systems already have that this graphic does not show
A. Master Control Plane / Principal Trust governance
The graphic has “ownership assignment” and “accountability mapping,” but your architecture goes further.
Your systems define a sovereign MCP / Principal Trust layer that governs:
SuperAdmin control
tenant hierarchy
licensing
platform health
usage telemetry
AI diagnostics
risk queues
audit/security
revenue/sales visibility
auto-healing recommendations
cross-tenant platform telemetry without exposing tenant-confidential records
That is materially stronger than the graphic’s simple “ownership assignment.” The image shows governance as a checklist; your design treats governance as an operating command layer.
B. Runtime telemetry hierarchy
The image lists audit logs, event tracking, user activity, query history, and access logs.
Your systems go deeper with runtime telemetry doctrine:
KPI primitive engine
telemetry state doctrine
telemetry bus
executive trust telemetry
role-aware rendering
auth-aware smoke testing
runtime governance tables
campaign telemetry events
financial telemetry placeholders
sender-lane telemetry
validation telemetry
system health telemetry
operational incident doctrine
The graphic does not describe telemetry as a command-and-control fabric. Your systems do.
C. Source-of-truth / markdown governance authority
The graphic does not mention source authority.
Your build process requires:
canonical markdown governance docs
source-of-truth hierarchy
repo/runtime/source map
contract extraction from governing markdown
patch-only governed files
validate with endpoint evidence
commit or stop with named blocker
That is a major missing layer in the graphic. The graphic governs AI/data, but it does not govern software implementation authority.
D. Contract-first implementation governance
The graphic says “policy enforcement,” but your systems require machine-readable contracts and implementation sequencing.
You already framed:
API contract governance
Codex execution sequencing
dev-shell orchestration
additive migrations only
governed backend separation
protected runtime boundaries
validation before publish
endpoint evidence before completion
That is more operational than the graphic.
E. AI trust telemetry
The image says “bias monitoring,” “output validation,” and “human oversight.”
Your systems add a more mature trust layer:
AI confidence state
source lineage
token/cost telemetry
model/report provenance
executive trust score
human review requirement
AI trust/state indicators
AI operational safety
AI fiduciary alignment
compartmentalized AI memory scopes
The graphic speaks to AI governance generally. Your system is closer to AI operational assurance.
F. Auto-healing and escalation
The image has “escalation rules,” but your systems explicitly require AI/system telemetry to detect:
faults
failures
bugs
blockages
operational tension
underlying system friction
healing recommendations
attention routing to the Master User / SuperAdmin
That is beyond static governance. It is self-monitoring operational governance.
G. Business execution governance
The image is centered on AI inventory, data, access, compliance, and logs.
Your systems govern actual business execution:
accounting ledgers
journal posting
balanced entries
trial balance
AR/AP
reconciliation
treasury
tax intelligence
campaign sends
vendor management
field ops
project/work-order telemetry
payment/progress verification
CRM workflows
client/vendor/tenant operations
The graphic does not address governance of real business transactions.
H. Campaigns360 sender-lane and preflight governance
The graphic does not include anything close to your Campaigns360 architecture.
You have locked in:
source list → domain carrier KPI
MX carrier KPI
suppression/duplicate/prior-validation gate
Bulk Email Checker preflight
deliverable-only promotion
scrubbed derivative lists
sender-lane allocation
throttled validation checks
shared IP / lane / carrier / MX / host telemetry
Preflight Confirmed To Send
campaign throttling controls
original list preservation
That is a specialized governance layer the graphic does not even contemplate.
I. Security redaction and supply-chain governance
The graphic says encryption, anonymization, threat detection, access logging, secure storage.
Your system adds:
redaction-first scripts
never print secrets
credential rotation assumption
least privilege handling
scoped/in-memory credential handling
backup-before-change
package/framework/repo inspection
no unvetted open-source dependencies
SAST/DAST readiness
container scanning
dependency scanning
vulnerability remediation
incident evidence packages
The graphic is high-level security. Your requirements are build-operational security governance.
J. Multi-tenant fiduciary/accounting isolation
The graphic mentions access control and data security, but not fiduciary separation.
Your Accounting360 / InvictusPro model includes:
tenant-confidential operational data separation
tenant accounting record isolation
tenant AI memory scopes
fiduciary telemetry
entity scope
fiduciary scope
encryption boundaries
RBAC
audit lineage
platform telemetry separation from tenant data
That is stronger than generic “role-based access.”
2. What the graphic notes that I do not yet know is fully implemented in your live systems
Some of these are probably in your governance markdown, but I would not claim they are already live unless we inspect the current repo/runtime.
A. Shadow AI detection
The image explicitly calls out Shadow AI Detection.
I know your architecture governs AI deployment policy, AI orchestration, AI telemetry, AI safety, and AI workflow boundaries. I do not yet know that you have a live detector that identifies unauthorized AI tools, rogue model calls, unapproved API keys, browser-based AI usage, or unsanctioned AI agents inside tenant workflows.
This should become an explicit control:
shadow_ai_detected, unapproved_model_endpoint, unregistered_ai_tool, external_ai_data_exposure_risk
B. Formal AI inventory registry
The image starts with AI Inventory.
You have AI governance concepts, model/version references, AI telemetry, and orchestration policy. I do not yet know that you have a live canonical table or registry for every AI component.
A mature version would inventory:
model name
model provider
version
endpoint
tenant scope
permitted workflows
data classes allowed
human-review requirement
risk tier
owner
approval status
last evaluation
retirement status
C. Vendor AI mapping
The image includes Vendor Mapping.
Your systems include vendor management in the business sense and open-source/package governance, but I do not know whether you have a formal AI vendor map that distinguishes:
OpenAI / Anthropic / local LLM / OCR vendors
Twilio, Stripe, Google, Microsoft, AWS, etc.
data processors vs subprocessors
AI-enabled vendors vs normal vendors
vendor risk tier
DPA/SOC2/ISO status
tenant exposure scope
This is likely needed for Fortune 500 positioning.
D. Data lineage at field-level depth
You already have audit/event lineage and source lineage concepts. The image specifically calls out:
source tracking
transformation flow
pipeline mapping
impact analysis
upstream/downstream mapping
I know you have this conceptually in Accounting360, Campaigns360, and iCore Event Bridge, but I do not know whether every material data object has full lineage implemented.
For example:
uploaded invoice → OCR extraction → AI classification → journal batch → ledger entry → trial balance → executive KPI
campaign source list → validation → scrubbed list → sender allocation → campaign send → bounce/suppression → telemetry rollup
work order → estimate → approval → vendor assignment → photo/progress → invoice → payment
That lineage should be formalized as a first-class system object.
E. Schema consistency checks
The image lists schema checks and consistency rules.
You have migration discipline, endpoint validation, audit events, and additive migration rules. But I do not know whether there is a live schema consistency engine that automatically checks:
expected columns
missing fields
enum drift
null policy violations
tenant scope leakage
foreign-key mismatches
event payload schema drift
API contract mismatch
frontend/backend response mismatch
This is highly relevant because you have already seen schema mismatch issues, such as login/auth problems and missing expected columns.
F. Bias monitoring
The image calls out Bias Monitoring.
Your systems have AI trust, human review, confidence, and fiduciary alignment. I do not know if bias monitoring is explicitly implemented as a measurable control.
For construction/accounting/campaign systems, bias monitoring may not mean demographic bias only. It can mean:
vendor selection bias
estimate approval bias
lead scoring bias
campaign suppression bias
AI recommendation skew
tenant/account prioritization bias
payment/dispute recommendation bias
G. Output validation rules
You have human oversight and audit telemetry, but I do not know whether every AI output has structured validation.
Examples:
AI-generated journal recommendation must balance before posting
AI-generated campaign recommendation must pass suppression/preflight rules
AI-generated estimate must preserve approved pricing logic
AI-generated executive report must cite source telemetry
AI-generated compliance summary must identify evidence sources
This is one of the most important items in the image.
H. Incident reporting specifically for AI
You have operational incident doctrine and security governance. I do not know whether you have a distinct AI incident reporting workflow.
That would include:
hallucinated output incident
unauthorized AI action
privacy/data exposure event
unapproved model call
failed confidence threshold
human override
model drift
unsafe recommendation
tenant complaint tied to AI output
3. Direct comparison table
Governance AreaImageYour SystemsAI inventoryBasic checklistLikely partially defined; needs explicit AI registry if not already builtData lineageGeneric lineageStronger conceptually; should be formalized per workflow/objectData qualityGeneric validationStrong in campaigns/accounting; schema consistency engine may need hardeningData securityEncryption/access/storageStronger due to redaction-first, credential, supply-chain, tenant isolationAccess controlRBAC/least privilegeStronger: RBAC SuperAdmin/MCP tenant/entity/fiduciary scopesHuman oversightReview/escalationStronger: trust telemetry, confidence state, executive attention routingCompliance trackingGDPR/EU AI Act/RiskStronger roadmap: SOC2/ISO/GDPR dashboards, evidence packages, gap trackingAudit logsBasic logsStronger: forensic audit chain, telemetry events, runtime evidenceBusiness governanceNot coveredYour systems cover accounting, campaigns, field ops, vendors, projectsAuto-healingNot coveredYour systems explicitly require auto-healing and fault escalationSource authorityNot coveredYour systems have markdown/source-of-truth governanceCampaign validationNot coveredYour Campaigns360 preflight/sender-lane telemetry is far more advanced4. The biggest thing your systems have that this image misses
Your systems are not just “AI governance.”
They are closer to:
Enterprise Operational Governance AI Trust Governance Runtime Telemetry Business Execution Control Source-of-Truth Software Governance.
That is the core differentiator.
This image is about governing AI responsibly.
Your system is about governing the entire business machine that AI participates in.
5. The useful items from the image to add or explicitly name in your system
These should be added as named controls if they are not already explicit:
Shadow AI Detection
AI Inventory Registry
AI Vendor/Subprocessor Mapping
AI Risk Scoring
Model Ownership Assignment
Data Transformation Lineage
Upstream/Downstream Impact Mapping
Schema Consistency Checks
AI Output Validation
AI Incident Reporting
Bias/Fairness Monitoring
Policy Enforcement Evidence
Access Review Evidence
Query History for AI and reporting surfaces
The strongest immediate addition would be an AI Governance Registry table/module that ties these together.
Example module name:
iCore AI Governance Registry
Core records:
AI asset
model/provider
owner
tenant scope
data classes
workflow permissions
risk score
human review rule
output validation rule
audit/event lineage
vendor/subprocessor
compliance mapping
incident history
active/retired status
6. Final assessment
Your systems already exceed this graphic in scope, telemetry depth, operational governance, SuperAdmin command visibility, campaign preflight controls, source authority, and runtime audit doctrine.
The image is still useful because it names several controls that should be made explicit in your architecture if they are not already live:
Shadow AI Detection, formal AI Inventory, Vendor AI Mapping, Schema Consistency, Bias Monitoring, Output Validation, and AI Incident Reporting.
The main gap is not vision. Your vision is larger. The gap is making each of those items a named, inspectable, auditable system object inside the MCP / iCore governance layer.

2
425
Starlit Studios retweeted

Probably gonna take a break for a bit since sadly light baking is broken in the project for SOTM right now, builtdata causes a serialization error once you try to test it in-game so it’s impossible to replace base game lighting fully right now


3
2
38
935

27 Oct 2025
The fastest path to growth?
Not more leads — but fewer, better customers who never leave.
Full podcast 👉 buzzsprout.com/1721145/episo…
🌐Visit: learningwithoutscars.org
#RonSlee #BuiltData #LearningWithoutScars #DealershipGrowth #DataDriven #CustomerLoyalty #Podcast
7
25 Oct 2025
Ron Slee and Nick Mavrick from Built Data unpack how to turn overwhelming data into insight, prioritize high-value customers, and strengthen client relationships.
🎧 Full podcast → buzzsprout.com/1721145/episo…
#RonSlee #LearningWithoutScars #BuiltData #SalesPodcast #CustomerSuccess

3

3 Sep 2025
...especially post-2021,.
The estimate is conservative due to variability in early years (1996–2006) where precise annual NOM figures are less accessible. Higher estimates (e.g., 650,000 for 2022–24 combined) suggest the total could be slightly higher.
Data excludes asylum seekers without permanent visas and focuses on NOM, as it best reflects population impact.
2. Number of New Dwellings BuiltData on dwelling completions is sourced from ABS publications, particularly “Building Activity, Australia” (ABS Cat. No. 8752.0), and supplemented by industry reports and government data. The ABS provides quarterly and annual data on new residential dwellings (houses, apartments, townhouses) completed, but comprehensive data for 1996–2024 requires some aggregation and estimation for earlier years.Dwelling Completions Data Overview1996–2007 (Howard’s Tenure):During the Howard era, Australia experienced a housing construction boom, particularly in the early 2000s, driven by economic growth and population demand.
ABS data (historical summaries) indicates annual dwelling completions averaged around 130,000–150,000 during this period. For example:1996–2000: Approximately 130,000 dwellings per year (based on ABS housing approvals data and completion rates).
2000–2007: Increased to ~150,000 per year, with peaks in 2003–04 (e.g., 158,000 completions) due to strong economic conditions.
Estimating for 11.75 years (1996–2007):Using an average of 140,000 dwellings per year (midpoint estimate): 11.75 × 140,000 ≈ 1,645,000 dwellings.
This aligns with industry reports noting ~1.5–1.7 million completions during this period.
2007–2024 (Post-Howard to Latest Data):Post-2007, dwelling completions fluctuated due to economic conditions, policy changes, and construction cycles. Key data points from ABS:2007–2012: Averaged ~145,000 completions annually, with a dip during the Global Financial Crisis (e.g., ~130,000 in 2009–10).
2012–2019: Increased to ~180,000–200,000 annually, peaking at 223,000 in 2018–19 due to apartment construction booms in Sydney and Melbourne.
2019–2022: Declined to ~170,000 annually due to COVID-19 disruptions (supply chain issues, labor shortages).
2022–2024: Rebounded to ~180,000 annually, with 178,000 completions in 2023–24 (ABS preliminary data).
Estimating for 2007–2024 (17 years):2007–2012 (5 years): 5 × 145,000 = 725,000.
2012–2019 (7 years): 7 × 190,000 = 1,330,000.
2019–2022 (3 years): 3 × 170,000 = 510,000.
2022–2024 (2 years): 2 × 178,000 = 356,000.
Total Dwellings (2007–2024): 725,000 1,330,000 510,000 356,000 ≈ 2,921,000.
Total Dwellings (1996–2024):1996–2007: ~1,645,000.
2007–2024: ~2,921,000.
Grand Total: 1,645,000 2,921,000 ≈ 4,566,000 dwellings.
Notes on Dwelling DataDwelling completions include private and public sector constructions (detached houses, semi-detached, apartments). Data excludes renovations or non-residential buildings.
ABS data is robust from 2001 onwards; earlier years (1996–2000) rely on approximations from housing approvals (which slightly overestimate completions).
Regional variations exist (e.g., Sydney and Melbourne account for ~56% of completions), but national totals are used here.
3. ComparisonMigrants (NOM): ~5,689,800 (1996–2024).
New Dwellings: ~4,566,000 (1996–2024).
Ratio: Approximately 1.25 migrants per new dwelling (5,689,800 ÷ 4,566,000).
This suggests that, on average, more migrants arrived than new dwellings were built, potentially contributing to housing demand pressures. However, this ratio oversimplifies the relationship, as:Not all migrants require new dwellings (e.g., students may share rentals, families may join existing households).
Household sizes vary (average ~2.5 persons per dwelling in Australia).
Some dwellings house non-migrants or remain vacant (e.g., investment properties).
4. Critical ConsiderationsMigration and Housing Demand: While high NOM contributes to housing demand, migrants also work in construction...
1
278

18 Mar 2025
yup. our focus @builtdata
from a fellow tinner 👷🏻♂️👊
18 Mar 2025

Electricians, plumbers, HVAC…
This is a problem that has been 20 years in the making.
America should care. Your local tradesmen can clear $150k per year and have a 3 month backlog for your service call.
If we don’t solve the labor supply constraint, buckle up…
1
52

31 Dec 2024
honestly would be an insane find. however i doubt that will happen because the builtdata for this map either gone or rewritten. only way to get that would be getting that build of the game and that is impossible 💔
2
57
30 Dec 2024
sadly i dont think that there is old build data for RUIN since it was over ridden. However with SB due to it having so many builds its easier. We found all of this in one builtdata map for night lighting which practically contains the entire alpha build in reflection captures
2
5
211

13 Nov 2024
confirming light baking is broken on Mac for 5.5 but it still accepts .builtdata files from Windows.
2
2
90
13 Nov 2024
I haven't been able to get lighting to build on Mac for a while so always build on Windows then bring the .builtdata files over
2
2
107

22 Oct 2024
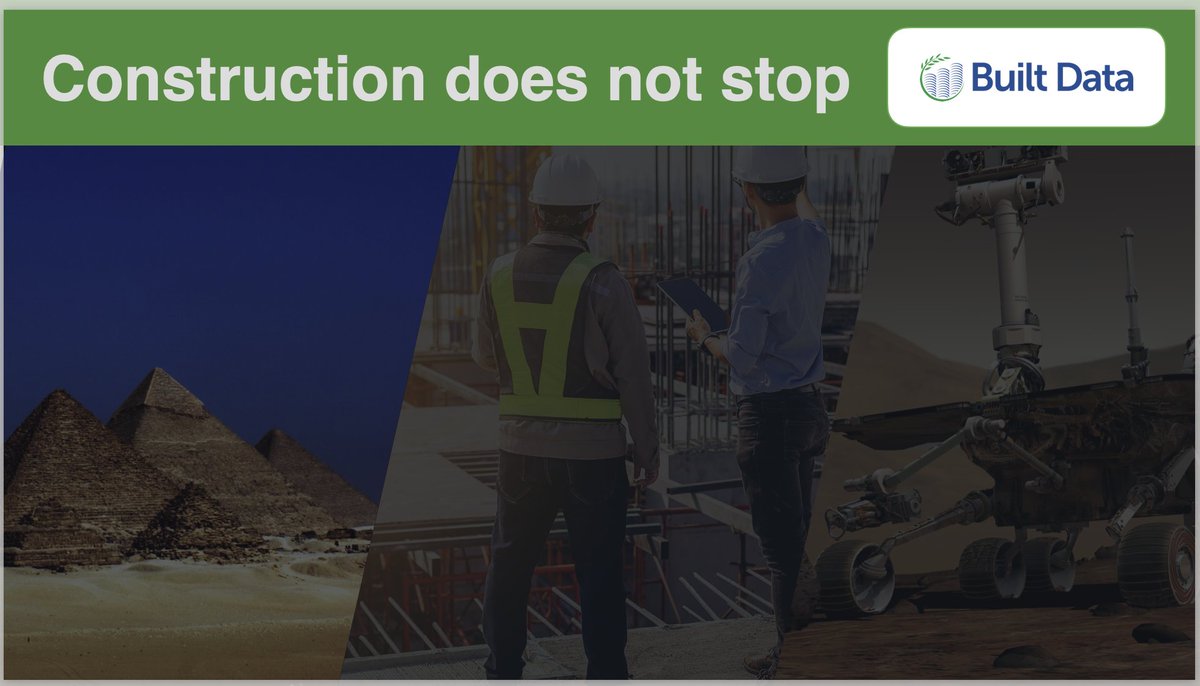
we've been building since the pyramids and now our sights are on Mars and beyond... #construction @builtdata
2
1
158
21 Jul 2024
word! @builtdata
21 Jul 2024

can people please stop trying to be influencers, we need electricians and mechanics I'm begging you
51
26 Jun 2024

11
19 Jun 2024
2
310
6 Jun 2024
reposting as it's not getting better unless you are on @builtdata for your job site comms #fieldfirst
29