
30 May 2025
Dear data analyst if you’re mostly using Excel, Power BI, and SQL go with a Windows laptop (like HP). It’s more compatible, cost-effective, and built for the job. MacBooks are great, but not always the best fit for data analysis workflows.
🤝
#DataAnalystTips


7
7
46
2,556

22 Nov 2024
When you work as a data analyst, often you will have issues with the data types of variables.
And this is why effective data cleaning is important.
𝗟𝗲𝘁 𝗺𝗲 𝗲𝘅𝗽𝗹𝗮𝗶𝗻 𝘆𝗼𝘂:
• Suppose you are in the EDA phase after cleaning and pre-processing data and you forgot to check or correct the data types.
• So, you might not be able to perform operations as numeric variables are stored as string data types.
• This will create a lot of issues and you won't be able to perform operations and analyze the data until you store data as correct data types.
• So, when you will have to correct data types eventually, why don't focus on it initially?
So, focus on correcting data types as a data analyst.
Enjoy. Follow for more!
#DataAnalytics #DataAnalysis #BusinessInsights #AdHocAnalysis #AutomationInAnalytics #DataAnalystTips #AnalyticsCommunity #ProcessOptimization #GlobalDataAnalytics #WorldwideInsights #AnalyticsCommunityGlobal #DataAnalystWorldwide #AdHocRequests #USDataAnalytics #DataInsightsUSA #AnalyticsCommunityUSA #DataAnalystUSA #AutomationUSA #UKDataAnalytics #DataAnalysisUK #InsightsUK #AnalyticsCommunityUK #AdHocRequestsUK #EuropeDataAnalytics #DataInsightsEurope #AnalyticsCommunityEurope #DataAnalystEurope #AutomationEurope #SingaporeDataAnalytics #InsightsSingapore #AnalyticsSG #DataAnalystSingapore #AdHocRequestsSingapore
2
34
21 Nov 2024
You will be performing a lot of joins in your career as a data analyst.
Also, Joins are really important in SQL and you should practice and master them.
Let's discuss the difference between inner join and left join as you will be using them often as a data analyst.
𝗜𝗻𝗻𝗲𝗿 𝗝𝗼𝗶𝗻: It retrieves rows that are common in both tables.
𝗘𝘅𝗮𝗺𝗽𝗹𝗲:
SELECT e.emp_id , s.salary
FROM employees as e
INNER JOIN salary as s using(emp_no)
𝗟𝗲𝗳𝘁 𝗝𝗼𝗶𝗻: It retrieves all the rows from the left table and common rows from the right table. It shows null in the right rows when there is no match.
𝗘𝘅𝗮𝗺𝗽𝗹𝗲:
SELECT e.emp_id , s.salary
FROM employees as e
LEFT JOIN salary as s using(emp_no)
Enjoy. Follow for more!
#SQL #DataAnalytics #DataAnalysis #SQLJoins #InnerJoin #LeftJoin #SQLLearning #DataSkills #TechSkills #DataAnalystTips #GlobalDataAnalytics #WorldwideDataInsights #SQLGlobal #AnalyticsCommunityGlobal #DataAnalystWorldwide #USDataAnalytics #LearnAnalyticsUSA #SQLSkillsUSA #DataAnalystUSA #AnalyticsCommunityUSA #UKDataAnalytics #SQLUK #LearnDataToolsUK #BritishDataAnalyst #AnalyticsCommunityUK #EuropeDataAnalytics #SQLSkillsEurope #DataInsightsEurope #EuropeanDataAnalyst #AnalyticsCommunityEurope #SingaporeDataAnalytics #SQLSingapore #LearnSQLSG #AnalyticsInSingapore #DataInsightsSG
3
30
9 Nov 2024
You must have heard data doesn't lie but do you know it is not a complete statement?
See the complete statement 👇
Enjoy. Follow for more!
#DataDoesntLie #DataIntegrity #DataQuality #DataCleaning #DataTransformation #CompleteData #DataInsights #DataDriven #DataAnalytics #DataAnalyst #ProductAnalyst #BusinessAnalyst #DataSpecialist #DataAnalystTips #AnalyticsCareers #DataScienceCommunity #DataJobs #DataAnalyticsUSA #DataAnalystUSA #DataCareersUK #DataAnalyticsUK #DataAnalystEurope #AnalyticsJobsEU #GlobalDataAnalyst #DataProfessionals #AnalyticalSkills #Insights #DataCleaningTips #QualityData #Analytics #TechCareers #BusinessIntelligence #FollowForInsights
1
2
35
20 Oct 2024
I have mentioned multiple times that, as a data analyst, you need to generate actionable insights to help solve business problems.
But a lot of the time, those actionable insights are not that easy to generate.
Let's discuss that in this thread.
#DataAnalysis #DataAnalytics #DataAnalyst #BusinessAnalysis #BusinessAnalytics #BusinessAnalyst #DataInsights #BusinessProblemSolving #ActionableInsights #DataDrivenDecisions #DeepDataAnalysis #DataPatterns #HistoricalDataAnalysis #AdvancedAnalytics #DataStrategy #VariableSelection #BusinessIntelligence #AnalyticsInAction #DataAnalystTips #SolveWithData #InsightfulAnalysis #USDataAnalytics #UKBusinessData #EuropeDataAnalysis #USEconomyInsights #UKDataProfessionals #EuropeBusinessAnalytics #DataAnalysisUS #DataScienceUK #AnalyticsInEurope #GlobalBusiness #TechInEurope #UKAnalytics #USEconomy #AnalyticsEurope #DigitalTransformation
#USDataExperts #UKDataCareers #EuropeDataProfessionals #USBusinessIntelligence #UKTechInsights #EuropeTechAnalysis
#USMarketAnalysis #UKMarketInsights #EuropeEconomicTrends #USAIandData #UKBigData #EuropeanDataScience
3
4
88
15 Oct 2024
While working as a data analyst, it is very important for you to understand the stakeholders requirements as everything depends upon it.
Let's understand this in this thread
#DataAnalytics #DataAnalyst #StakeholderEngagement #ClientCommunication #DataDrivenInsights #StakeholderRequirements #BusinessAnalysis #DataStrategy #DataAnalystTips #ActionableInsights #DataMeetings #EffectiveCommunication #AnalystLife #DataScience #DataConsulting #TechIndustry #DataInsights #USDataAnalytics #DataJobsUSA #USADataProfessionals #DataCareersUSA #DataScienceUSA #USBusinessAnalysis #UKDataAnalytics #DataJobsUK #UKDataScience #DataProfessionalsUK #UKTechJobs #UKBusinessAnalysis #EuropeDataAnalytics #DataJobsEurope #EUDataScience #DataProfessionalsEU #EuropeTechJobs #EUDataInsights #EuropeBusinessAnalysis
1
1
4
105
14 Oct 2024
Being a data analyst, when you get a dataset or get an access to the data from a client, don't rush to decide key metrics without understanding the data in detail.
Let's discuss it in this thread.
#DataAnalytics #DataQuality #DataAnalystTips #DataDrivenDecisions #MetricsMatter #DataInsights #DataAnalysisProcess #DataScience #DataUnderstanding #DataPreparation #USDataAnalytics #DataJobsUSA #USADataScience #DataProfessionalsUSA #UKDataAnalytics #DataJobsUK #UKDataScience #DataProfessionalsUK #EuropeDataAnalytics #DataJobsEurope #EUDataScience #DataProfessionalsEU
1
2
47
20 Sep 2024
Today, in our Power BI Series, Let's discuss about various kinds of views that are available to you.
As a data analyst, you should be aware about them to use them effectively to perform operations on data, understand relationship among tables and to generate effective visualizations.
So, We have 3 different views available in Power BI and these are:
1) Report View
2)Table View
3) Model View
Now, Let's discuss each one of them.
1) Report View: So, as the name suggests, this view allows you to create reports and in simple terms, here you can create visuals, apply filters and can create measures as well. You can select among various visuals including bar chart, column chart, funnel chart, treemap, cards and a lot more. Also, now you will se a Microsoft Copilot icon which will allow you to use benefits of co-pilot in your Power BI desktop to create reports and dashboards.
2) Table View: It allows you to access all your tables that are available in your database (if you connect via DBMS such as MySQL or PostgreSQL). Here, you can create new columns, measures and much more. You can also use DAX formulas here to create new columns and measures. The main difference between Table View and Power Query is that, Table views shows you the data that is currently present in your model while in Power Query, you need to apply the changes selecting the option "Close and Apply" or "Apply", then the model gets updated.
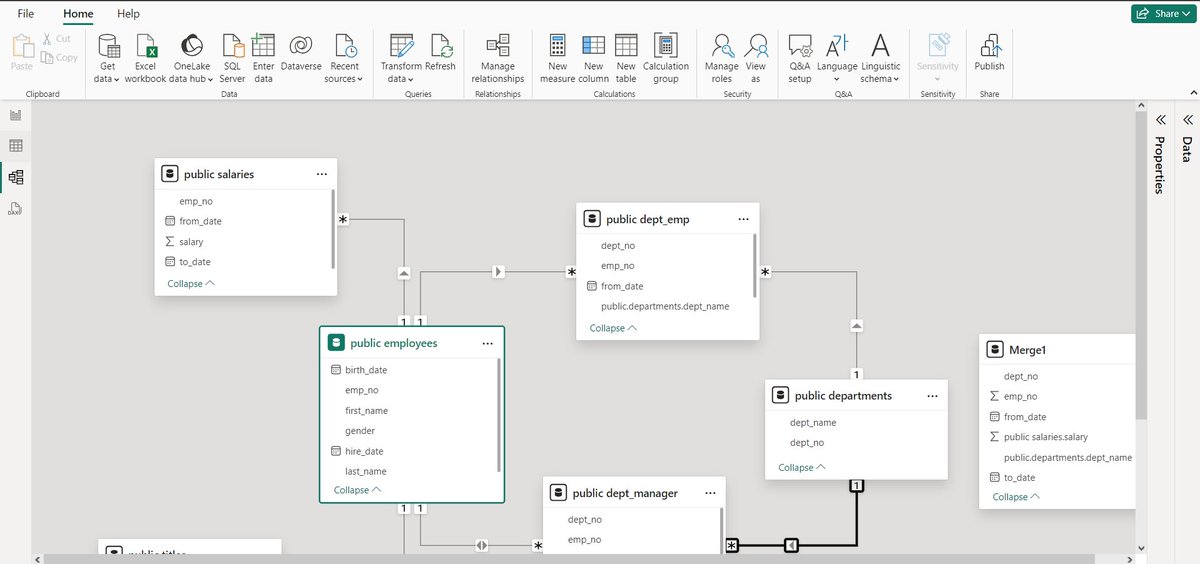
3) Model View: This view shows you the relationship among different tables and with which relationship they are connected (one-one, one-many and more). Here, you can see which column is used as a link between two tables, you can alter the relationship between them and more. Also, as a data analyst, you should be cautious to modify the relationship, specially "Cross Filter direction" as it can create a lot of errors if they are not used correctly.
#PowerBI #PowerBIViews #ReportView #TableView #ModelView #BusinessIntelligence #DataVisualization #DataModeling #DAX #DataTransformation #DataOperations #DatabaseManagement #PowerQuery #DataRelationships #TechSolutions #BIExpert #DataAnalysis #DigitalTransformation #AnalyticsLife #DataAnalystTips #TechUS #TechUK #TechEurope #BusinessDecisions #PowerBIDesktop #DataIntegration #DataEfficiency #BigData #USBusiness #UKBusiness #EuropeTech
10
697

As a Data Analyst, learn the basic of Business Analyst role, it may come handy when you get on the job... #DataAnalystTips
1
8
511