
20 Oct 2024
I have mentioned multiple times that, as a data analyst, you need to generate actionable insights to help solve business problems.
But a lot of the time, those actionable insights are not that easy to generate.
Let's discuss that in this thread.
#DataAnalysis #DataAnalytics #DataAnalyst #BusinessAnalysis #BusinessAnalytics #BusinessAnalyst #DataInsights #BusinessProblemSolving #ActionableInsights #DataDrivenDecisions #DeepDataAnalysis #DataPatterns #HistoricalDataAnalysis #AdvancedAnalytics #DataStrategy #VariableSelection #BusinessIntelligence #AnalyticsInAction #DataAnalystTips #SolveWithData #InsightfulAnalysis #USDataAnalytics #UKBusinessData #EuropeDataAnalysis #USEconomyInsights #UKDataProfessionals #EuropeBusinessAnalytics #DataAnalysisUS #DataScienceUK #AnalyticsInEurope #GlobalBusiness #TechInEurope #UKAnalytics #USEconomy #AnalyticsEurope #DigitalTransformation
#USDataExperts #UKDataCareers #EuropeDataProfessionals #USBusinessIntelligence #UKTechInsights #EuropeTechAnalysis
#USMarketAnalysis #UKMarketInsights #EuropeEconomicTrends #USAIandData #UKBigData #EuropeanDataScience

3
4
88
3 Oct 2024
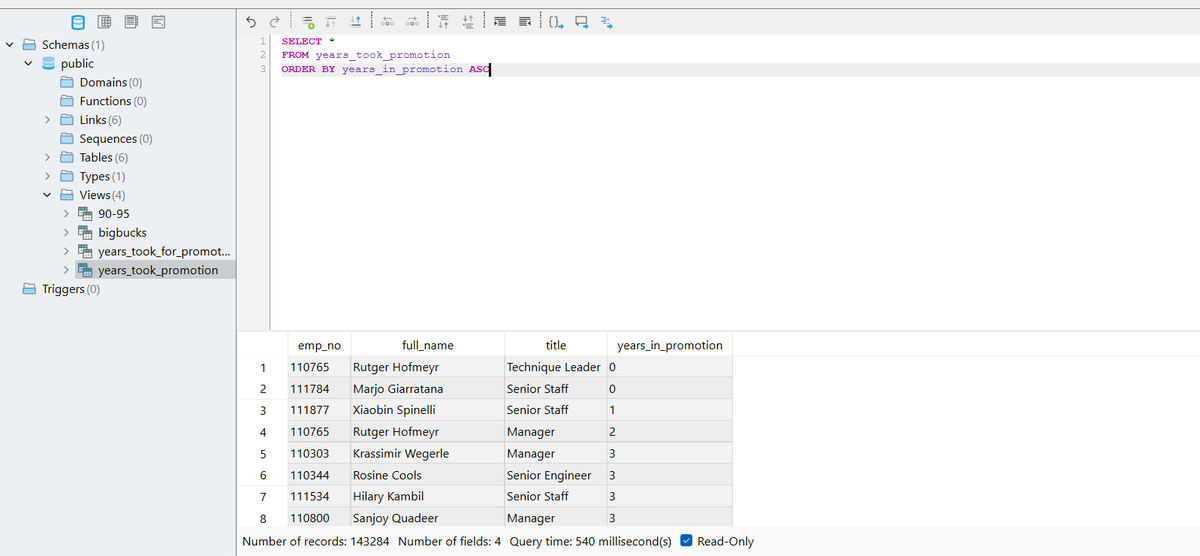
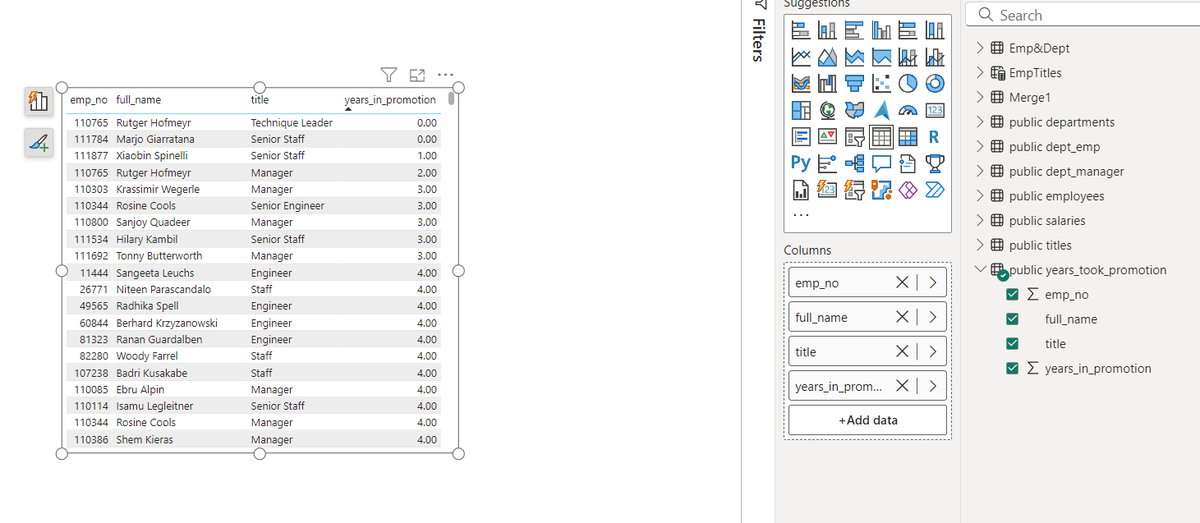
Continuing our 𝗣𝗼𝘄𝗲𝗿 𝗕𝗜 series, let's discuss how you can work around operations or functions that are not easily available in 𝗣𝗼𝘄𝗲𝗿 𝗕𝗜.
Let's consider an example for this, consider you want to use 𝗟𝗔𝗚(), 𝗟𝗘𝗔𝗗() window function in Power BI but actually you don't have any direct 𝗗𝗔𝗫 𝗳𝗼𝗿𝗺𝘂𝗹𝗮 to implement this.
You can use multiple 𝗗𝗔𝗫 𝗳𝗼𝗿𝗺𝘂𝗹𝗮𝘀 to get your way around but I personally thing that it is not efficient specially when you are connected to a database and you can write SQL queries in your database.
Also, this solution is effective only when you have access to the database and can write query to it.
𝗦o, 𝘄𝗵𝗮𝘁 𝘆𝗼𝘂 𝗰𝗮𝗻 𝗱𝗼 𝗶𝘀:
• Create a materialized view in SQL using LAG(), LEAD() or whatever function you don't have in Power BI.
• Now, load the data using direct query and you will find the view that you created there like table.
• Then you can use that view as table and visualize the data that you want.
I attached some screenshots where I created view in SQL and then loaded the data into Power BI and visualized it using a table.
#PowerBI #SQL #DAX #WindowFunctions #LAGFunction #LEADFunction #MaterializedView #DatabaseIntegration #DirectQuery #PowerBIWorkaround #DataAnalytics #BusinessIntelligence #DataVisualization #TechSolutions #DataModeling #PowerBIExpert #AdvancedAnalytics #DataEfficiency #TechUS #TechUK #TechEurope #USBusiness #UKBusiness #EuropeTech #DigitalTransformation #BIInnovation #SQLQueries #DataAnalyst #PowerBIDesktop #DatabaseManagement #BigData #BusinessDecisions #DataScienceUK #DataScienceUS #EuropeanTech #DataDrivenUK #DigitalEconomyEU #DataInsightsEurope #DataAnalysisUS #TechCommunityUS #TechInnovationUK #DataScienceEurope
1
29
24 Jul 2024
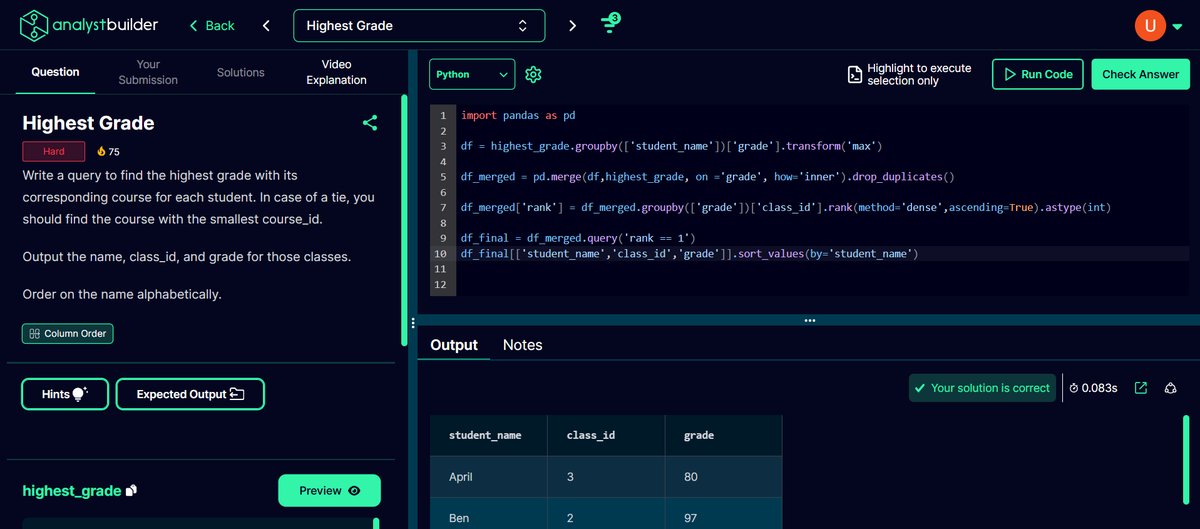
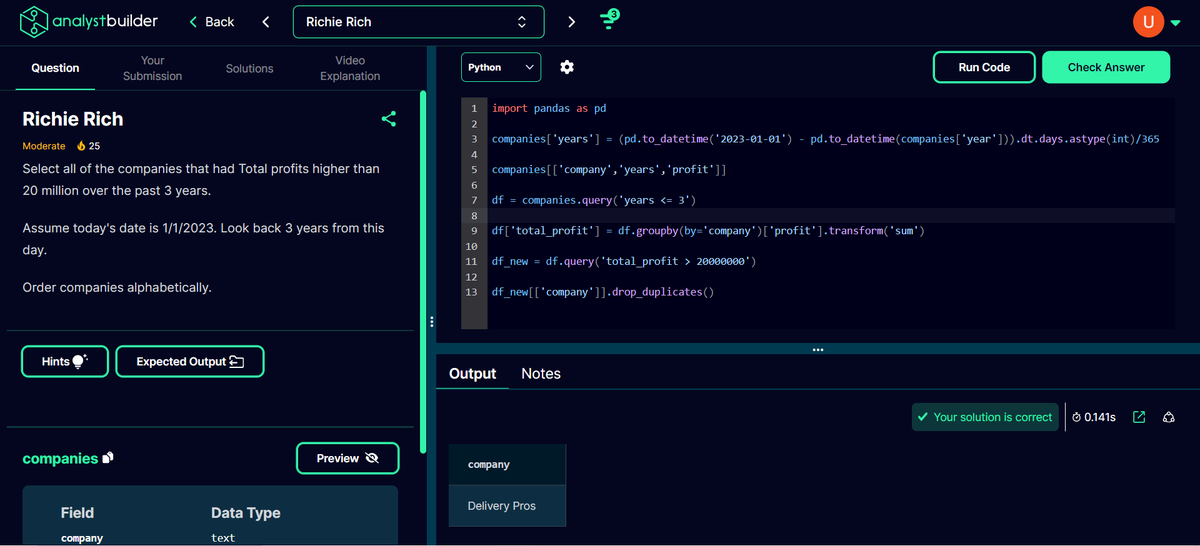
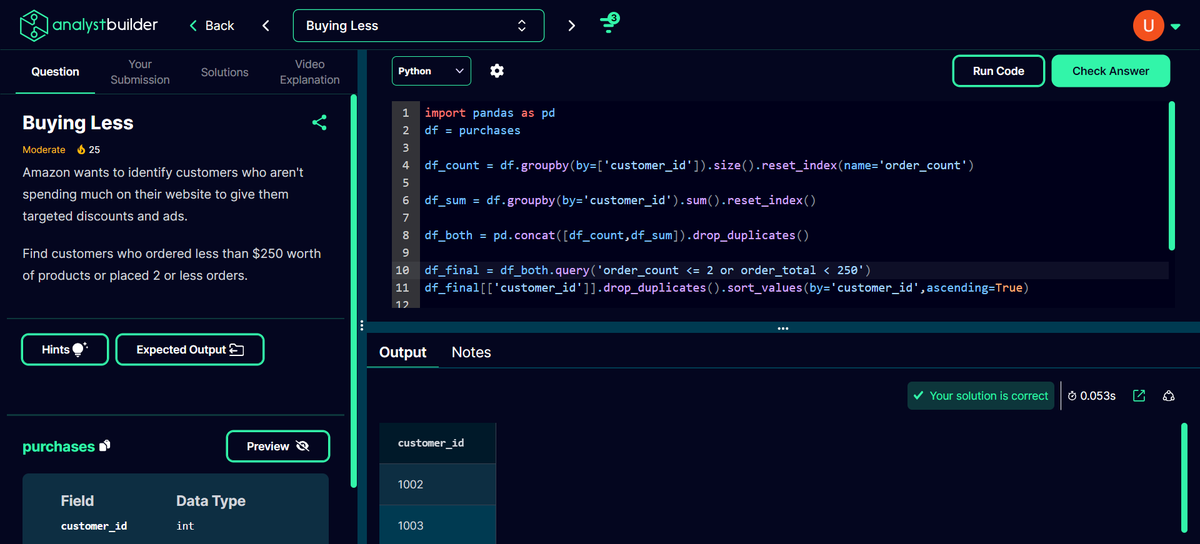
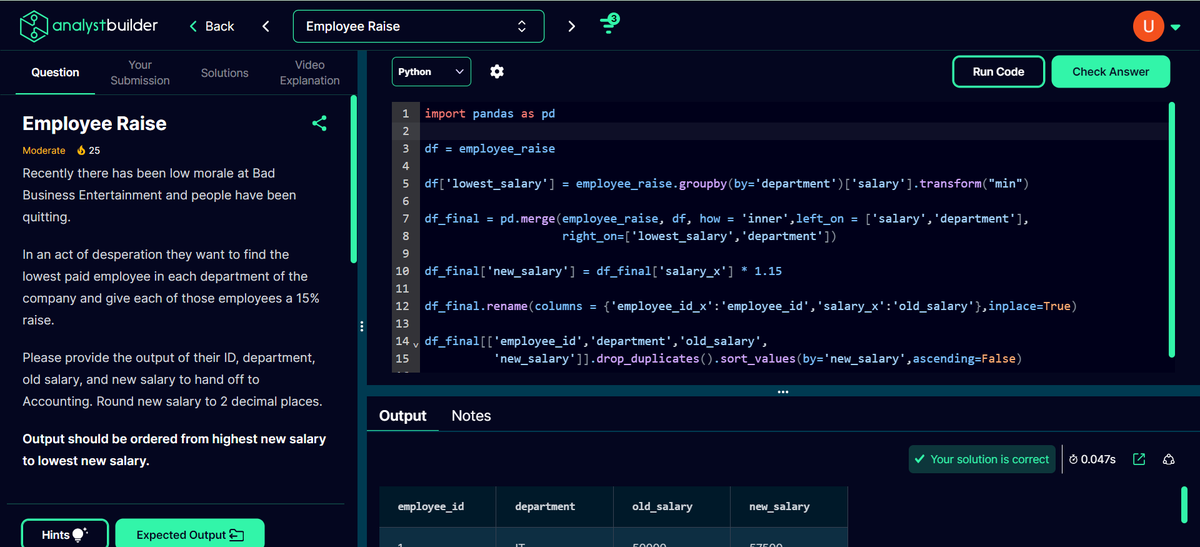
I solved this hard category question from @Analyst_Builder in Python. @Analyst_Builder is the platform of @Alex_TheAnalyst and I really enjoyed solving this question.
The question asked to get the highest score of student across various courses. And if the maximum score is same then we need to select the marks with smallest course id.
Now, Let's discuss how I solved it:
-- Firstly, I created a dataframe "df" to get the maximum score of each student from the original dataframe and to get that I grouped dataframe according to "student_name" and then used "transform" function to get "maximum" grades.
-- Then I created another dataframe named as "df_merged" and stored the merged data between original dataframe and "df" by using inner join. This allowed me to get the effective and required maximum marks of student along with other columns like "student_name", "class_id" and "grades".
-- Then I created a "rank" column in "df_merged" dataframe where I grouped the data according to grade and then performed "dense rank" operation on "class_id". This allowed me to first group the data with grades (I was having maximum grades already" and with dense rank on "class_id", I was able to rank then according to smallest "class_id" when grades were same.
-- Then I created last dataframe named as "df_final" where I used ".query()" to select only those rows that have "1" as rank.
-- Then I displayed the required columns and sorted them by "student_name".
#DataAnalyst #python #pandas #AnalystBuilder #mysql #postgresql #sql #mysql #CTE #windowfunction #BusinessAnalyst #sql #dataanalysisus #techjobsus #BusinessIntelligence #BI #BusinessAnalytics #USJobs #USA #USHiring #USCompanies #AmericanBusiness #USTech #FinTech #HealthcareAnalytics #RetailAnalytics #MarketingAnalytics #Networking #ProfessionalDevelopment #CareerGrowth #IndustryInsights
1
6
1,353
16 Jul 2024
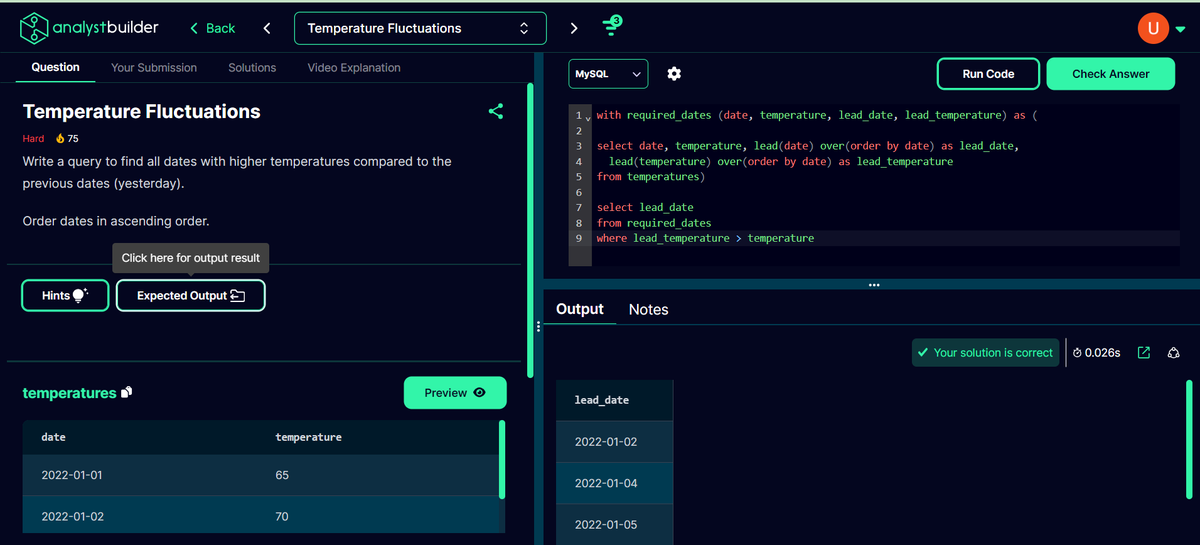
I solved this hard category question from @Analyst_Builder in MySQL which is a platform of @Alex_TheAnalyst. I really enjoyed solving it.
The question asked to output the dates when temperature was higher than previous day.
Let's discuss how I solved it:
-- I used "LEAD()" window function to get the temperature and date of the next row from the current row as saved it as 'lead temperature' and 'lead temperature respectively'
-- I also selected current date and temperature so that I can compare them in next steps.
-- Now I created a CTE named 'required_dates' where I included all the columns namely - 'date', 'temperature', 'lead_date', 'lead_temperature'
-- Then I used the query and selected 'lead_date' and included filtering where 'lead_temperature > temperature'
#DataAnalyst #sql #mysql #CTE #windowfunction #BusinessAnalyst #python #pandas #sql #dataanalysisus #techjobsus #BusinessIntelligence #BI #BusinessAnalytics #USJobs #USA #USHiring #USCompanies #AmericanBusiness #USTech #FinTech #HealthcareAnalytics #RetailAnalytics #MarketingAnalytics #Networking #ProfessionalDevelopment #CareerGrowth #IndustryInsights
2
59
8 Jul 2024
I solved this hard category question from @Analyst_Builder which is the platform of @Alex_TheAnalyst. In this question, I had to calculate running total of points for each gender.
Now, let's discuss how I solved it:
-- I simply used the window function to calculate the sum of points.
-- I then partitioned the data inside window function according to gender as we want to calculate the running total of points separately for each gender.
-- Then I used "order by" inside window function according to the gender and date so that the points gets added according to each day and gender.
-- Then I ordered the result according to gender and day in ascending order.
#DataAnalyst #PowerBI #PowerQuery #BusinessAnalyst #python #pandas #sql #dataanalysisus #techjobsus #BusinessIntelligence #BI #BusinessAnalytics #USJobs #USA #USHiring #USCompanies #AmericanBusiness #USTech #FinTech #HealthcareAnalytics #RetailAnalytics #MarketingAnalytics #Networking #ProfessionalDevelopment #CareerGrowth #IndustryInsights #DataAnalysis #DataScience #BigData #DataAnalytics #DataDriven #RemoteWork #RemoteJob #WorkFromHome #WFH #RemoteCareer #RemoteOpportunity #DigitalNomad #GlobalTalent #USStartups

3
147
7 Jul 2024
Today, Let's discuss why should you learn python as a data analyst and it's potential use cases.
You should learn python as a data analyst because it provides several advantages and let me mention a few:
-- Being a general-purpose programming language, it can be used to solve various problems or challenges that a data analyst faces such as cleaning, manipulating, aggregating data and a lot more.
-- Massive number of libraries allows data analysts to choose the desired way to solve a problem or approach a task such as you have multiple libraries for data visualization such as bokeh, matplotlib, seaborn, plotly and a lot more.
-- It allows you to perform all the required tasks at one place and you don't need to context switch between multiple technologies/tools for various tasks such as SQL cannot visualize data and you need to use visualization tools to achieve that but with python you can perform SQL tasks using pandas and visualization tasks using plotly, matplotlib etc.
Python potential use cases in data analysis:
-- Creating automation scripts that can be used to solve recurring issues such as cleaning a dataset, performing specific type of reporting and much more.
-- It efficiently allows us to access data with APIs using libraries such as "requests".
-- It allows data analysts to get required data using web scraping libraries such as BeautifulSoup.
-- It also allows us to perform various statistical analysis such as hypothesis testing, regression analysis and more using libraries such as SciPy.
This is similar to scratching the surface if we discuss about the potential of python and I will discuss about it more in my future posts.
#DataAnalyst #PowerBI #PowerQuery #BusinessAnalyst #python #pandas #sql #dataanalysisus #techjobsus #BusinessIntelligence #BI #BusinessAnalytics #USJobs #USA #USHiring #USCompanies #AmericanBusiness #USTech #FinTech #HealthcareAnalytics #RetailAnalytics #MarketingAnalytics #Networking #ProfessionalDevelopment #CareerGrowth #IndustryInsights #DataAnalysis #DataScience #BigData #DataAnalytics #DataDriven #RemoteWork #RemoteJob #WorkFromHome #WFH #RemoteCareer #RemoteOpportunity #DigitalNomad #GlobalTalent #USStartups
1
51
6 Jul 2024
Let's discuss what Power Query is, how you can use it and why you should learn it as a data analyst. In this post, I will discuss Power Query from high level as I want to ensure that it's easier for everyone to understand it.
Power Query: It is a Microsoft technology that allows you to integrate/connect multiple data sources, manipulate and transform the data. It is present in various Microsoft products such as Power BI, Dataverse, Excel and more.
In this post, I will discuss specifically about Power Query in Power BI Desktop.
How you can use Power Query in Power BI desktop as a data analyst:
To use Power Query:
-- Click on data tab
-- Select the dataset
-- Right click ---> Edit Query
Why should you use Power Query as a data analyst:
-- It allows you to split columns in really easy way by selecting the specific character as a separator such as comma (,), space ( ) and more.
-- It allows you to replace values and merge/append queries to work with multiple queries so that it can be managed in efficient manner.
-- It has a lot more features such as pivot tables, data type detection, scientific calculations, merge columns and a lot more.
-- It also supports M language to create new columns etc.
-- As a data analyst, all these tasks are very important, and Power Query allows options and features to perform all these tasks and much more than that.
This is just Power Query 101 as I didn't want to overwhelm someone who might just have been introduced to Power BI or data analysis generally.
#DataAnalyst #PowerBI #PowerQuery #BusinessAnalyst #python #pandas #sql #dataanalysisus #techjobsus #BusinessIntelligence #BI #BusinessAnalytics #USJobs #USA #USHiring #USCompanies #AmericanBusiness #USTech #FinTech #HealthcareAnalytics #RetailAnalytics #MarketingAnalytics #Networking #ProfessionalDevelopment #CareerGrowth #IndustryInsights #DataAnalysis #DataScience #BigData #DataAnalytics #DataDriven #RemoteWork #RemoteJob #WorkFromHome #WFH #RemoteCareer
#RemoteOpportunity #DigitalNomad #GlobalTalent #USStartups
1
2
75
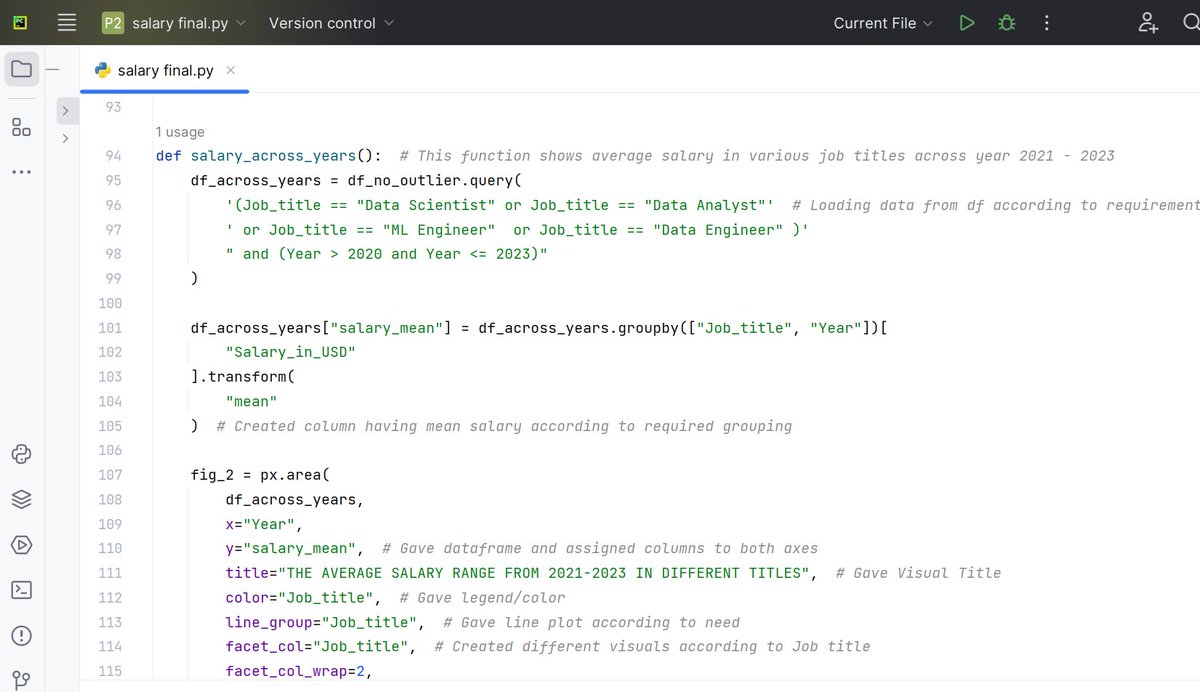
5 Jul 2024
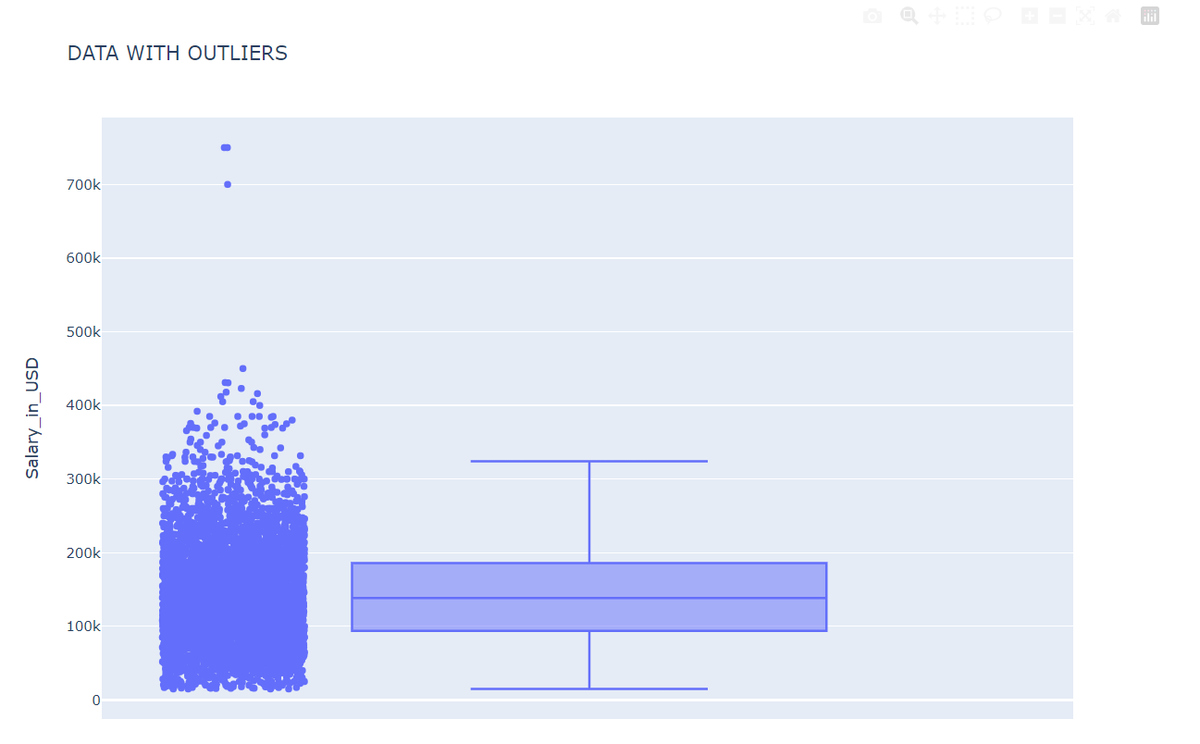
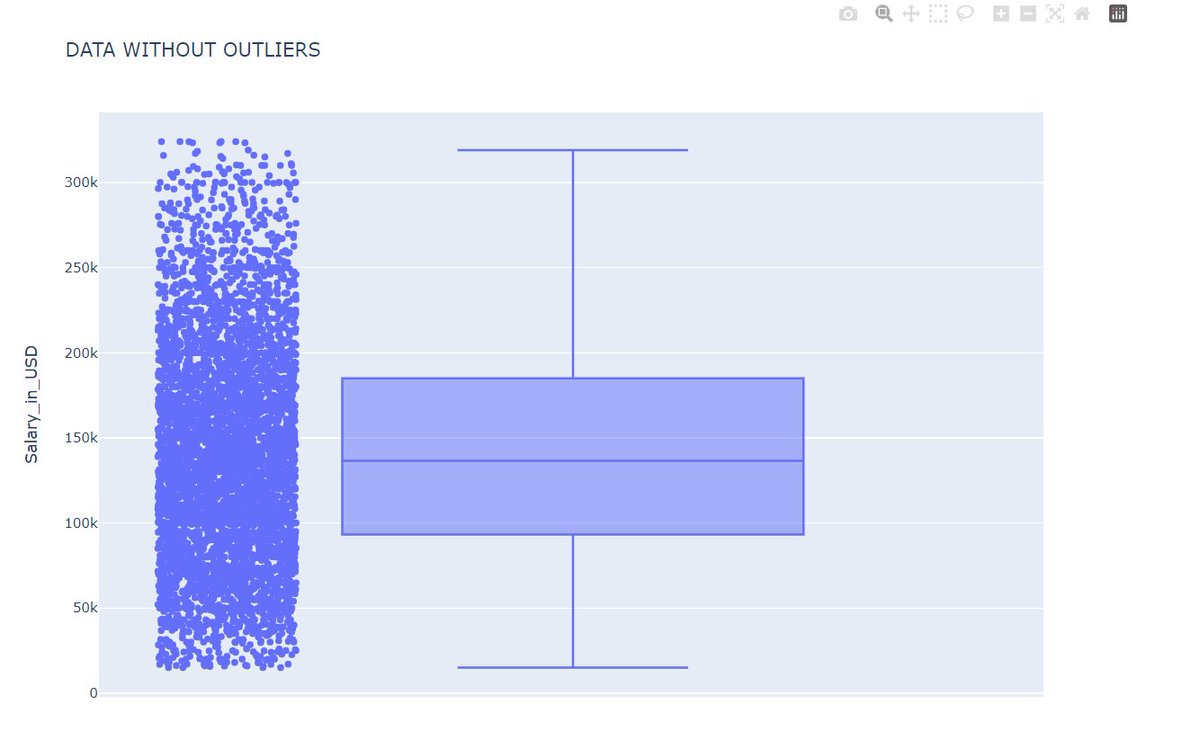
Today, Let's discuss what Outliers are, what impact they cause on data analysis and how you should approach them as a data analyst.
Outliers:They are simply the values/data points in the dataset that different significantly than the other data points/values.
Impact of Outliers on data analysis:
They can skew the result of analysis such as mean will have different value than the actual mean which will not be accurate.
This will lead to ineffective analysis, and we will not be able to generate precise insights and eventually, there won't be any actionable contribution to the solution of the problem that the company was facing.
Example: Consider outlier free datapoints from a sample that is salary of junior data analysts in US -
55000 USD
50000 USD
68000 USD
77000 USD
90000 USD
Mean of this sample: 68000 USD
Now, the datapoints with outliers for salary of junior data analysts in US -
55000 USD
150000 USD
68000 USD
77000 USD
90000 USD
Mean of this sample: 88000 USD
We can clearly see that the mean of outlier included sample was way more than the sample without outliers.
How should you approach the outliers:
Now, outliers are not bad in all the scenarios and if you go on to remove them from each and every possible dataset that you come across, then you will miss the impactful insight.
Example:
I created a project that analyzed fatalities in war and there I quickly comprehended that outliers should remain in this dataset as war data is way different from salary, sales, E-Commerce data and the fatalities will significantly increase when war breaks out rather than normal situations.
So, as a data analyst, your intuition and understanding of dataset also plays a crucial role to comprehend outliers in better way.
Some ways to remove outliers:
1) Box Plot method
2) Standard deviation method.
I will explain these methods in my future article as this one is getting really long. So, stay tuned.
#DataAnalyst #BusinessAnalyst #python #pandas #sql #dataanalysisus #techjobsus #BusinessIntelligence #BI #BusinessAnalytics #USJobs #USA #USHiring #USCompanies #AmericanBusiness #USTech #FinTech #HealthcareAnalytics #RetailAnalytics #MarketingAnalytics #Networking #ProfessionalDevelopment #CareerGrowth #IndustryInsights #DataAnalysis #DataScience #BigData #DataAnalytics #DataDriven #RemoteWork #RemoteJob #WorkFromHome #WFH #RemoteCareer
#RemoteOpportunity #DigitalNomad #GlobalTalent #USStartups
1
48
4 Jul 2024
Today, Let's discuss why you should remain versatile in terms of tech stack as a data analyst.
The first thing that you need to understand is that tech stack is just the tool for you to perform your operations or to achieve your goal as a data analyst.
What you need to understand is that your analytical skills and intuition matters the most as a data analyst.
Whenever you look at a dataset, you should have a good understanding how to approach the data and what variables to consider for effective analysis.
When you are proficient in that, it doesn't matter if you are using Excel, SQL or Power Query.
This is important for you to understand as the tools can be learnt really easily while working with them.
For ex: Certain syntax of PostgreSQL is different from MySQL and more.
The important thing is:
1) When you are looking at war-based data, look at fatalities.
2) When you are looking at sales data, look at profit, cost, margin and more.
3) when you are looking at E-commerce data, focus on customer trends such as product category, location, order time, product seasonality and more.
4) And so on.
Also, when you are working as a data analyst in a company, the company might be using a different tech stack from what you know or might change it in future after your joining.
So, always remain flexible in that scenario as tech keeps on developing and if you are not flexible enough, you will be replaced by someone who is!
#python #pandas #sql #dataanalysisus #techjobsus #BusinessIntelligence #BI #BusinessAnalytics #USJobs #USA #USHiring #USCompanies #AmericanBusiness #Tech #FinTech #HealthcareAnalytics #RetailAnalytics #MarketingAnalytics #Networking #ProfessionalDevelopment #CareerGrowth #IndustryInsights #DataAnalysis #DataScience #BigData #DataAnalytics #DataDriven #RemoteWork #RemoteJob #WorkFromHome #WFH #RemoteCareer #RemoteOpportunity #DigitalNomad #GlobalTalent #USStartups
1
2
88
1 Jul 2024
Today, Let's discuss about the various pandas functions that you should know and will be used if you are using python as a data analyst.
If you decide to learn python in order to perform data analysis such as creating automated scripts and various other things, then you must know these functions as you will end up using them daily.
So, let's discuss them one by one. Also, I will be comparing each function with corresponding SQL function/keyword so that if you know SQL, It will be easier for you to understand it.
1) head(n): It will allow you to fetch first "n" number of rows from the dataframe.
2) tail(n): It is opposite to head(n). It just allows you to get last "n"number of rows from the dataframe.
3) groupby(): It is used to group the data according to your need. SQL has this exact keyword as well.
4) sort_values(by='column', ascending=True/False): It is to sort the dataframe/result according to the need. It is similar to "order by" in SQL.
5) query(): It can be used to perform filtering according to the requirement. It is similar to where clause in SQL.
6) len(df): It can be used to get the count of rows of the dataframe. It is similar to "count" function in SQL.
7) merge(): It can be used to perform merging of multiple dataframe like a SQL join.
8) dropna(): It can be used to remove/drop the data that is missing. You can use use SQL to filter the values that are not null by using "NOT NULL" in where clause or you can use "ALTER","DELETE" to update or delete the null values in SQL.
9) fillna(): It can be used to fill the missing values. It is similar to "IFNULL', "Coalesce" in SQL.
10) df['column'].rank(method = 'dense', ascending = TRUE/FALSE): It is to perform dense rank operation that is present in SQL. It simply performs rank operation by not leaving gap in case of tie. So, if two data points had 1st as rank then the next data points will be provided with rank 2.
11) to_datetime(): It can be used to change the datatype of the column to "datetime". You can use "CAST()" and "CONVERT()" in SQL for similar operation.
So, these are the few pandas function that you should know to become a good data analyst that uses python.
#python #pandas #sql #dataanalysisus #techjobsus #BusinessIntelligence #BI #BusinessAnalytics #USJobs #USA #USHiring #USCompanies #AmericanBusiness #Tech #FinTech #HealthcareAnalytics #RetailAnalytics #MarketingAnalytics #Networking #ProfessionalDevelopment #CareerGrowth #IndustryInsights #DataAnalysis #DataScience #BigData #DataAnalytics #DataDriven #RemoteWork #RemoteJob #WorkFromHome #WFH #RemoteCareer #RemoteOpportunity #DigitalNomad #GlobalTalent
1
55