
17 May 2025
🌀Most investors are still using outdated methods to build portfolios.
But pros? They're simulating 10,000 portfolios in Python. Here's how you can too. 👇
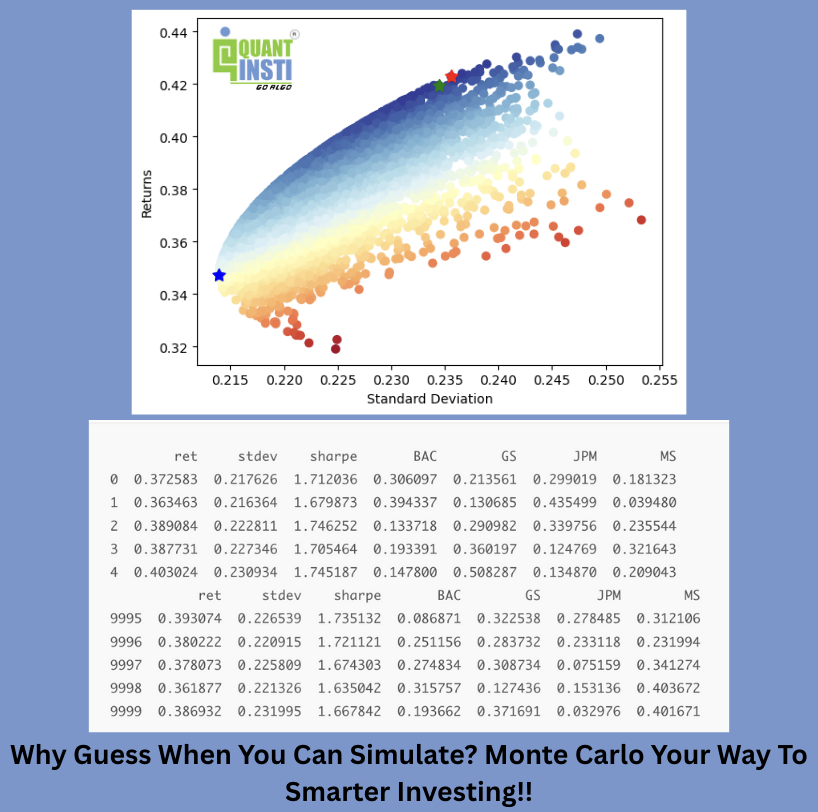
📈 Portfolio Optimization with Monte Carlo Simulation — step-by-step, with real data.
Whether you're a quant, finance student, trader, or Python enthusiast…
This post is your roadmap to smarter investing using data science and probabilistic modelling.
💡 What’s inside the blog?
🔹 What is Portfolio Optimization?
🔹 Objective-driven approaches:
— Maximize Sharpe Ratio (Tangency Portfolio)
— Minimize Portfolio Variance
— Maximize Return at a Fixed Level of Risk
🔹 Data used: Stock prices from BAC, JPM, GS, MS (2024)
🔹 Annualized return & risk calculation
🔹 10,000 Monte Carlo simulations in Python
🔹 Sharpe-optimized portfolios using real data
🔹 Beautiful visualizations to backtest results
🧠 Why it matters:
In 2025, alpha isn’t found in gut feeling—it’s in models that adapt, simulate, and evolve.
Monte Carlo helps you explore the entire opportunity set, not just a handful of guesses.
⚙️ Tools used: yFinance, NumPy, Pandas, Matplotlib — beginner-friendly, real-world results.
📊 Learn how to:
✅ Use Python for smarter investing
✅ Rebalance assets based on simulated performance
✅ Build a portfolio that’s actually built for risk-adjusted returns
📚 Full article complete code:
👉 blog.quantinsti.com/portfoli…
💬 What’s YOUR take on Monte Carlo in portfolio management?
Tried it? Struggled with it? Curious to apply it?
Let’s share insights below 🔽
#PortfolioOptimization #MonteCarloSimulation #PythonForFinance #QuantTrading #FinancialModelling #SharpeRatio #AssetAllocation #InvestmentStrategy #Backtesting #DataScienceInFinance #RiskManagement #AlgorithmicTrading #QuantResearch #QuantitativeFinance #StockMarketStrategy #PythonInvesting #TradingWithPython
6
385
12 May 2025
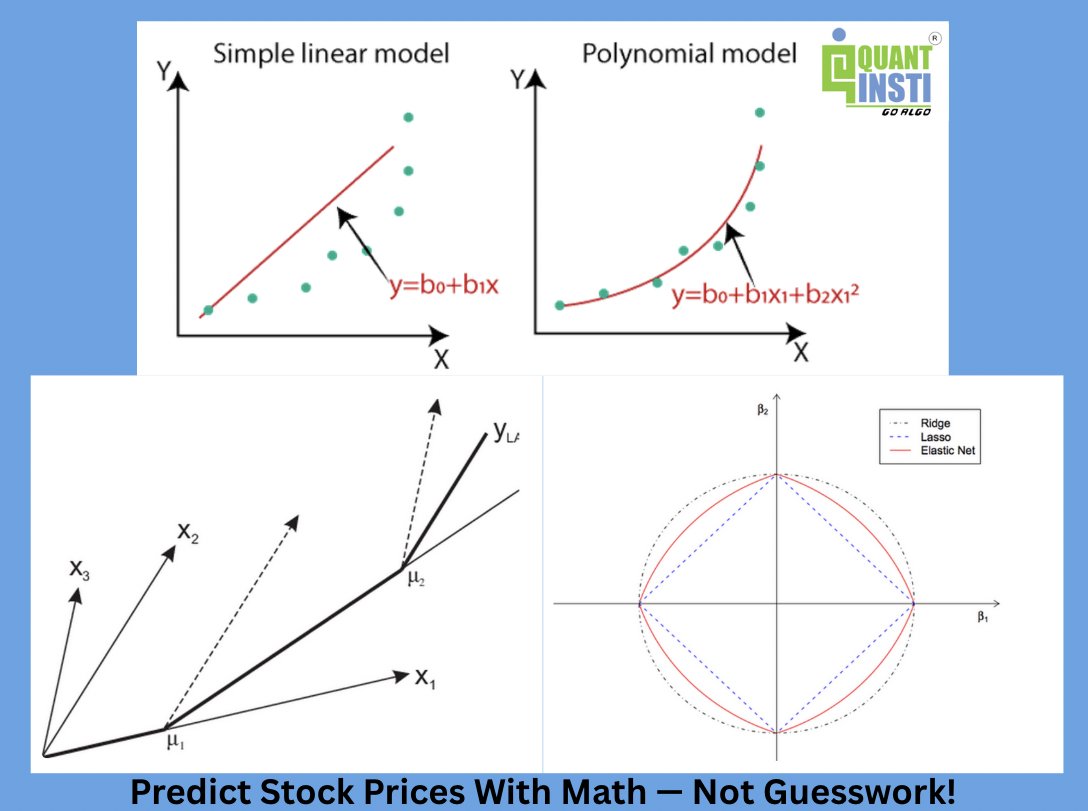
🧠 Want to predict stock prices with math — not guesswork?
Most traders stop at linear regression...
But markets aren't linear — and neither should your models be.
In our latest blog, we break down the real tools quants use to detect trends and forecast smarter.
🚀 Inside Part 1: Advanced Regression Models in Finance
📌 Go beyond basics with:
✅ Polynomial Regression – for capturing non-linear price curves
✅ Ridge Regression – to solve multicollinearity in financial data
✅ Real-world use cases in trading portfolio modeling
Whether you're a beginner or a quant-in-training, this is a must-read.
📖 Read now 👉 blog.quantinsti.com/advanced…
💬 Have you tried any of these regression techniques in your strategies? Share below 👇
🎯 Want to master algorithmic trading with confidence?
Learn how to build, test, and deploy data-driven trading strategies using Python and industry-grade tools.
🔗 quantinsti.com/epat
🚀 With the EPAT® Programme, you’ll gain expertise in:
✅ Algorithmic & quantitative trading techniques
✅ Python, machine learning & financial data analysis
✅ Live strategy execution, risk management & portfolio design
💼 Designed by top industry professionals. Trusted by traders, analysts, and quants around the globe.
If you're serious about becoming a skilled algo trader, EPAT® is your launchpad.
#MachineLearningInFinance #QuantTrading #RegressionAnalysis #PolynomialRegression #RidgeRegression #FinanceBlog #AlgoTrading #DataScienceInFinance #TradingModels #LearnQuant #AIinFinance
2
302
26 Apr 2025
🔍 What Are Autocovariance and Autocorrelation in Time Series?
If you're working with financial time series data, understanding autocovariance and autocorrelation is crucial. Let’s break them down in simple terms. 👇
📊 Covariance measures how two different variables move together.
🔁 Autocovariance does the same—but with a twist. It measures how a variable (say, stock returns) correlates with its own past values. For example, the covariance of Microsoft’s return today with its return yesterday.
🧠 Think of it like this:
Cov(X, Y) ➡️ Two variables
Cov(Xₜ, Xₜ₋ₛ) ➡️ Same variable at different time points (this is autocovariance)
📈 Autocorrelation, also called serial correlation, is the normalized version of autocovariance. It tells you how strongly today’s return is related to yesterday’s (or any lag) on a scale from -1 to 1.
🔗 Autocorrelation at lag 0 = 1 (makes sense—any series is perfectly correlated with itself at the same time).
📉 In practice:
Negative autocorrelation? Mean-reverting asset.
Positive autocorrelation? Trending asset.
✅ Why does this matter?
Autocovariance and autocorrelation are fundamental in:
📊 Time series modeling (ARMA, ARIMA, etc.)
⚙️ Quant strategy development
📉 Volatility forecasting
👉 Check out this blog on Autocorrelation and autocovariance to find out more:
blog.quantinsti.com/autocorr…
🎯 Want to master algorithmic trading with confidence?
Learn how to build, test, and deploy data-driven trading strategies using Python and industry-grade tools.
🔗 quantinsti.com/epat
🚀 With the EPAT® Programme, you’ll gain expertise in:
✅ Algorithmic & quantitative trading techniques
✅ Python, machine learning & financial data analysis
✅ Live strategy execution, risk management & portfolio design
💼 Designed by top industry professionals. Trusted by traders, analysts, and quants around the globe.
If you're serious about becoming a skilled algo trader, EPAT® is your launchpad.
#QuantFinance #TimeSeries #TradingStrategies #Autocovariance #Autocorrelation #FinanceTips #QuantAnalysis #DataScienceInFinance
3
262

13 Apr 2022
Bu sabah @sibirbil hocamı dinliyorum gözlerim kapalı (sıkıntıdan değil zevkten)
#dsfc #datascienceinfinance

1
1
22

Bravo à @Sebastien_Jehan pour le #meetup #datascienceinfinance. Super talk de Christophe et @laurentgrangeau à propos de @ProjectJupyter !

4
4