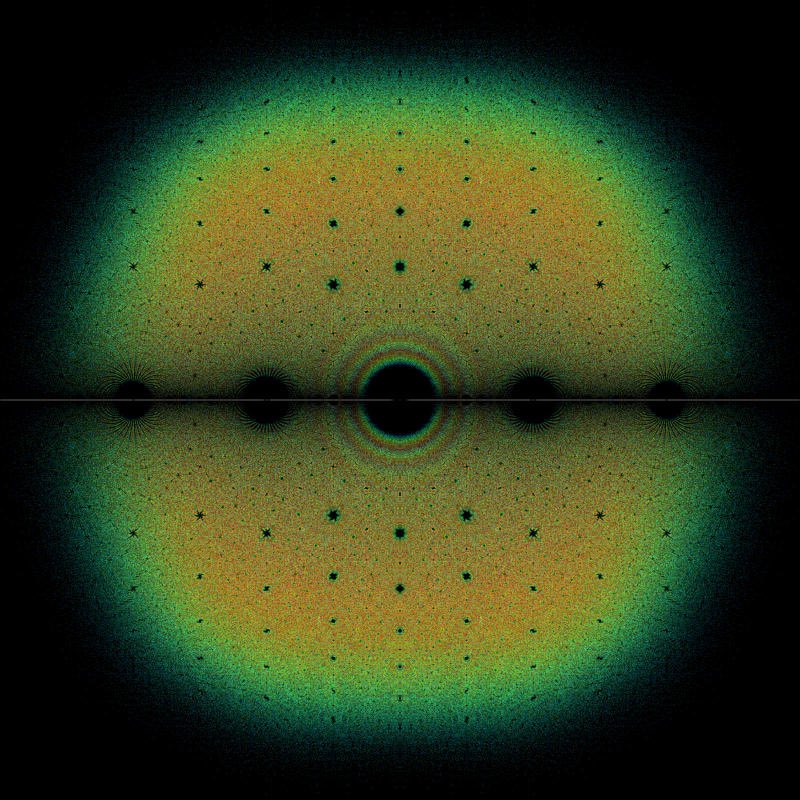
ALT Clifford attractor


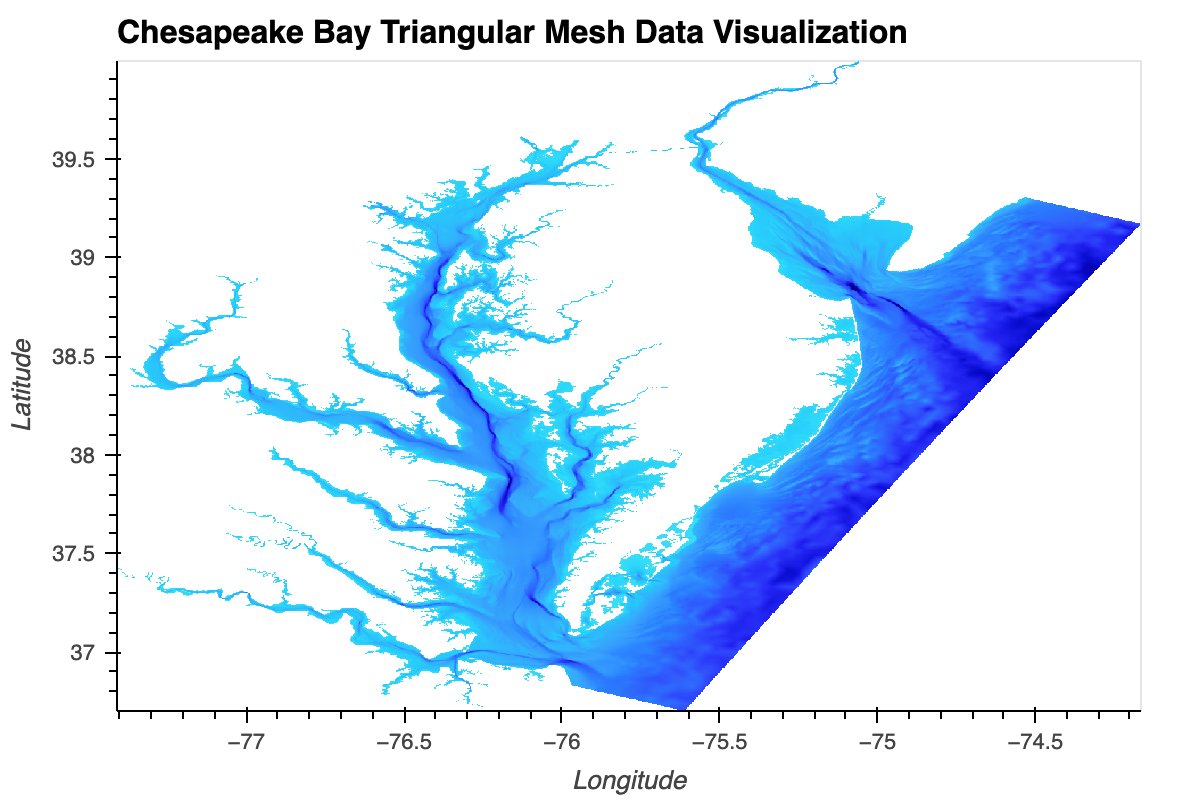
ALT A high-resolution data visualization titled "Chesapeake Bay Triangular Mesh Data Visualization," displaying the intricate bathymetry and shoreline of the Chesapeake Bay. The image uses a color gradient of blues (light cyan to deep indigo) to represent varying depths or data values within the bay and surrounding waters. The lighter blues typically indicate shallower areas, while the darker blues suggest deeper channels or open water. The complex network of rivers and tributaries feeding into the bay is clearly rendered. The visualization highlights the irregular triangular mesh structure often used in computational fluid dynamics (CFD) or oceanographic modeling, where smaller triangles provide higher resolution in complex areas like coastlines and river mouths. The axes are labeled Longitude (approximately -77.5 to -74.5) and Latitude (approximately 37 to 39.5). This graphic exemplifies advanced geospatial data processing and scientific visualization for environmental studies.


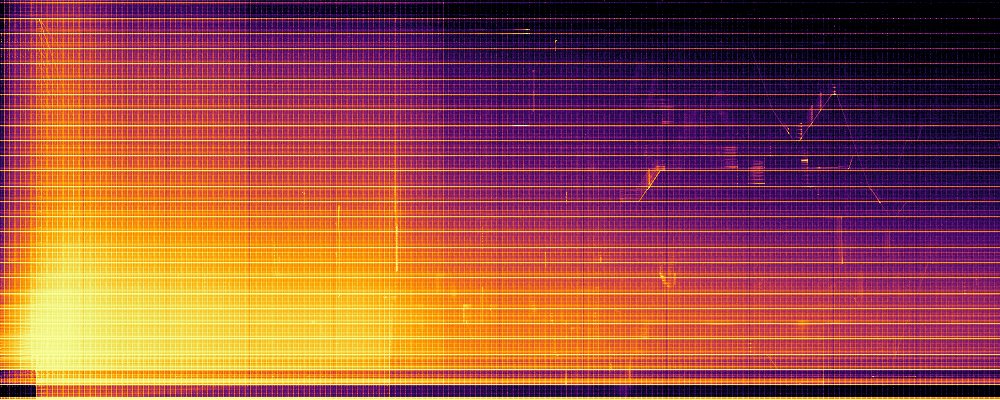
ALT very colorful scatterplot of player deaths in mario maker levels. "inferno" colormap. some level elements highlighted.