
A canonical El Niño appears increasingly plausible on the horizon. However, I agree that many models may be overstating the pace of recovery from La Niña conditions. The emergence of localized subsurface and surface heat anomalies “heat blobs” in key regions is understandably steering model consensus toward a rapid and steady transition into a positive ENSO phase and maybe worse scenario of super Nino .
That said, these models often rely on assumptions that background variability and noise remain relatively stable and well-constrained, which can lead to smoother and more confident projections than reality may support. Also, those models assume steady and consistent atmospheric coupling may last for ever without surprises or interruptions , but the real physical universe is not a straightforward road . It is more awkward and intertwined than we can simplify in linegraphs indeed.
Given the extended La Niña to neutral period between 2020 and 2025, the system’s internal dynamics may not behave as cleanly as modeled.
Importantly, our practical experience with indices such as RONI remains limited. This phase should be approached as a learning opportunity, refining interpretation, validating assumptions, and improving methodological robustness, rather than engaging in unproductive criticism.
2
328

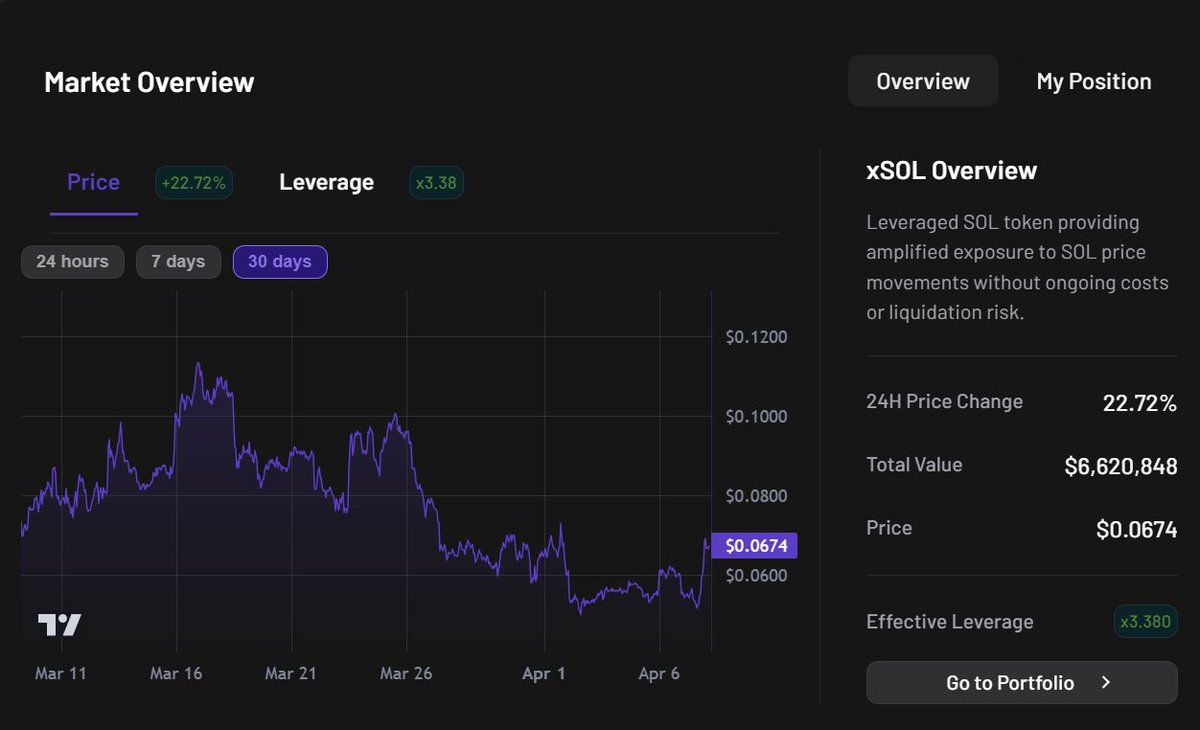
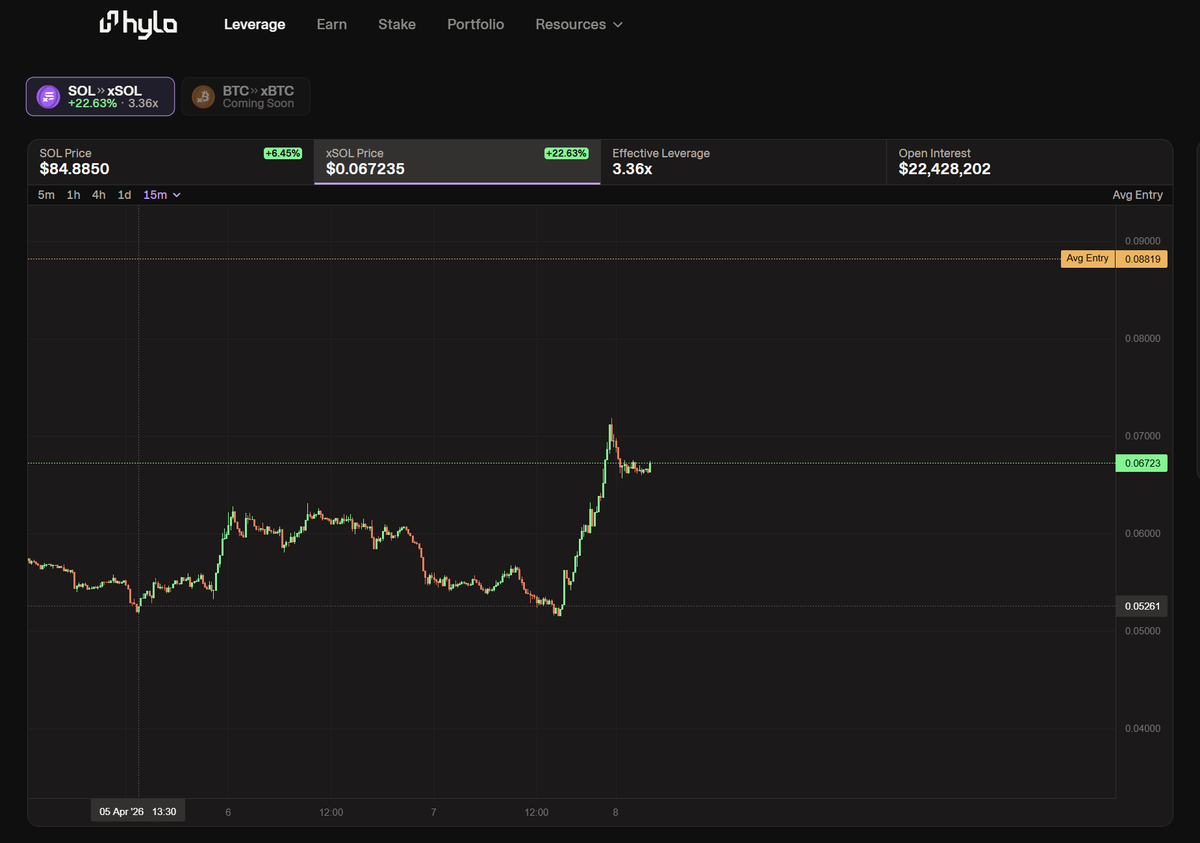
yeah so about @hylo_so v2, I got access to it last week...
honestly I like a few changes in particular in the V2, the shift from linegraphs to candles and the added timeframes for SOL and xSOL look way better to me.
but in V2, I wish there was an option to switch between both linegraphs and candles tbh, rather than being stuck with one.
portfolios have become more organized, and the XP hub becoming Hylo Journey, plus the protocol stats and risk dashboards, are much better arranged as well.
the rest of the details and info have become clearer in V2, and even the interface feels smoother, but imo V1 was good as well.
is it just a design upgrade or am I missing something?
anyways, overall I like the change
2
20
344

25 Jun 2025
how else are you supposed to argue with his 20 different linegraphs and maps on one single topic lol
17
214

It's amazing the Tiny Tim expressions of innocence as regime technocrats continue present their barcharts & linegraphs as if the year of the cooked statistics getting exposed isn't happening.
24 Apr 2024

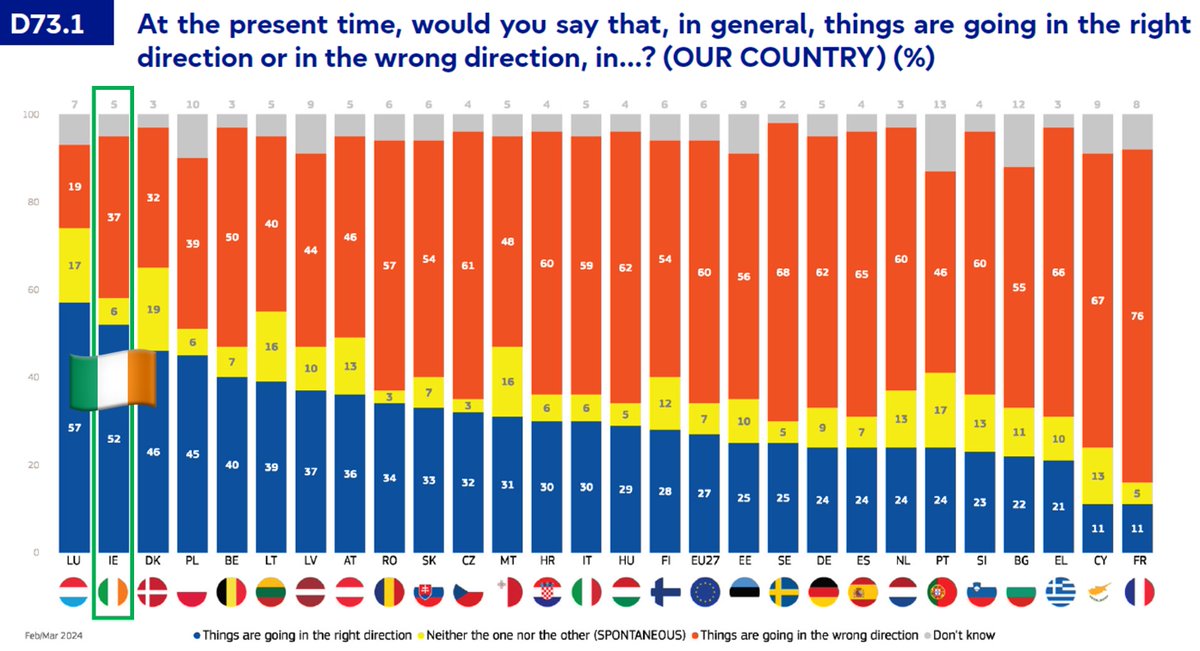
Most Irish people think the country is going in the right direction. 52% agree with this and only 37% disagree. Within the EU, only the citizens of Luxembourg are more positive about their country. 🇮🇪😇
europa.eu/eurobarometer/surv…
1
7
211

Line graphs ➕ Google Sheets 🟰 Easy to read data! 👩🏻💻
Read our article and see how to make line graphs in Google Sheets with easy steps and more!
forms.app/en/blog/how-to-mak…
#LineGraphs #GoogleSheets #LineChart
5
125

2 Jun 2023
She said she was writing for memorization & she'll never look at these again, but it's the fact that there's not one word on the paper 😭😭😭. Homegjrl is writing in heartbeats & linegraphs.
4
1,342

2 Oct 2022
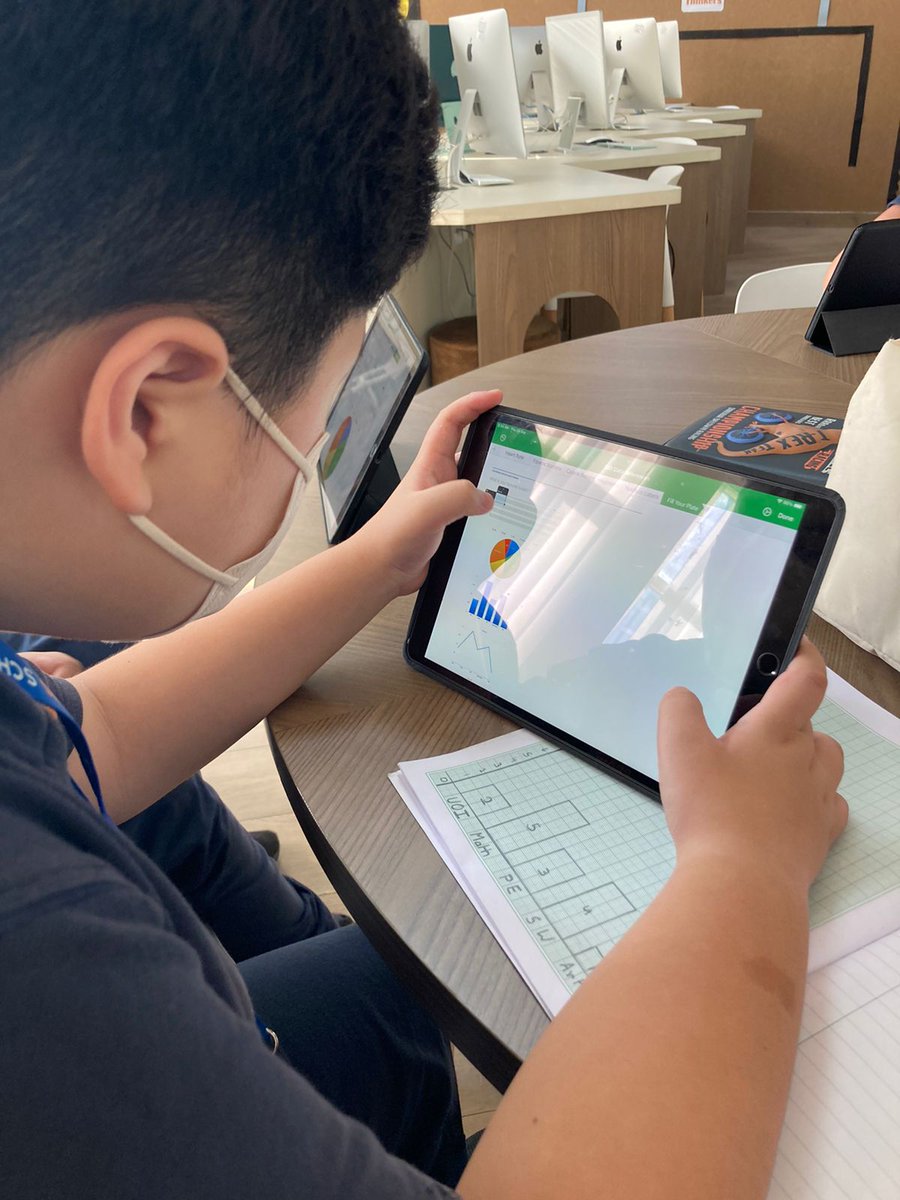
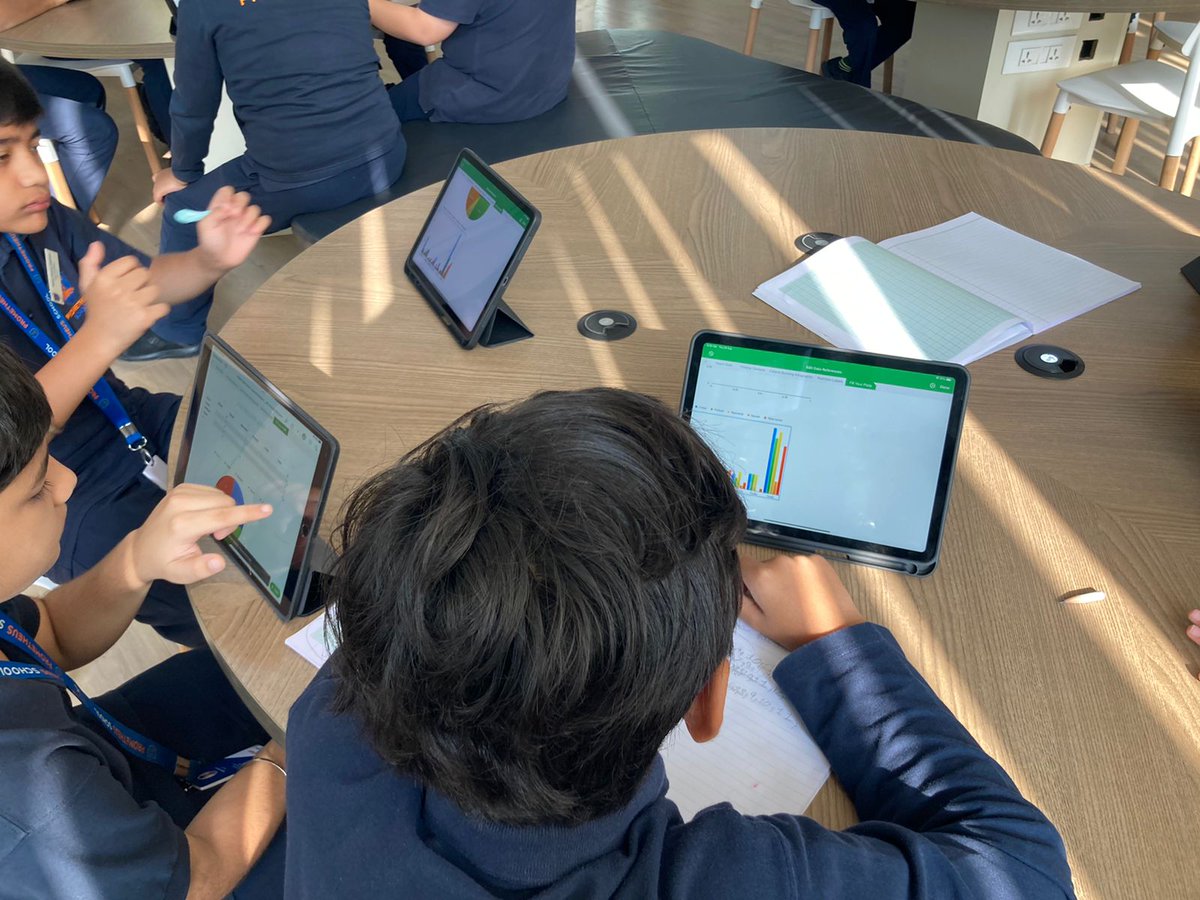
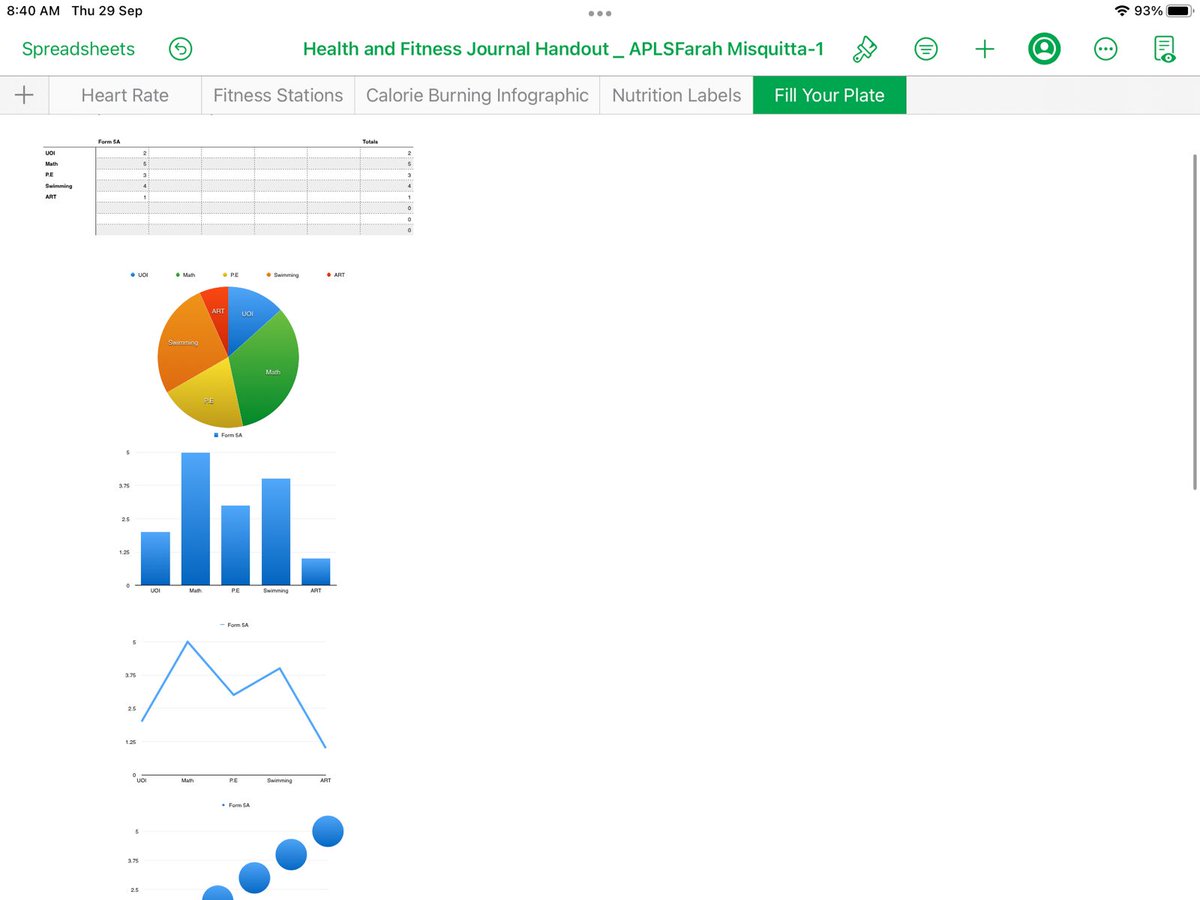
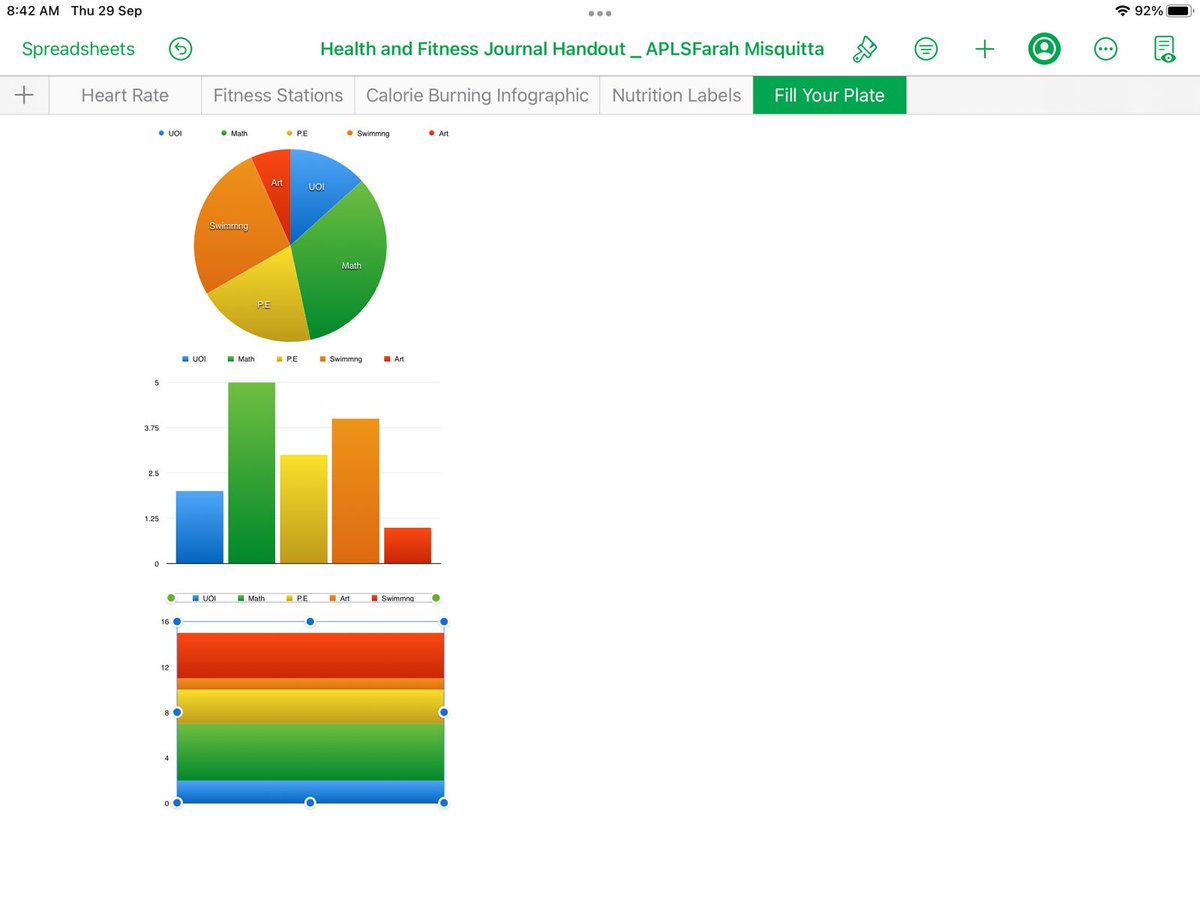
Ss #operating to formulate question,#collectingdata #dataanalysis. Outstanding work Form 5 on data collection&creating #bargraphs #linegraphs #piecharts using @HealthfitnessJournal @AppleEDU @KetakiKTweets @KirtiTrehan @aanchalshah16 @Prometheus_Edu
1
1
6

24 Mar 2022
Need help with constructing and interpreting bar charts, vertical line diagrams, line graphs and pictograms?
Blended learning resource now available for @wjec_cbac GCSE Maths.
resources.wjec.co.uk/Pages/R…
#edutwitter #gcsemaths #wjec #linegraphs #pictograms

1
2

22 Mar 2022
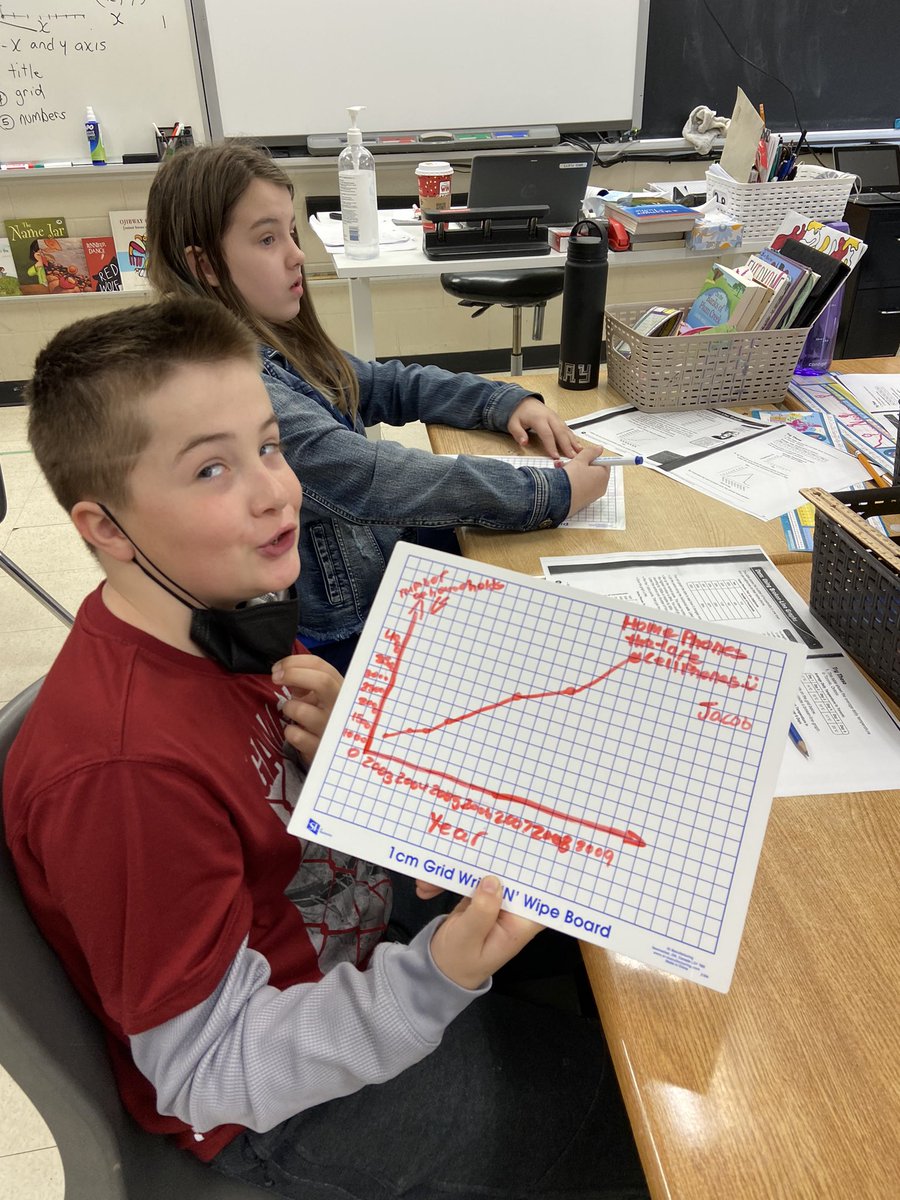
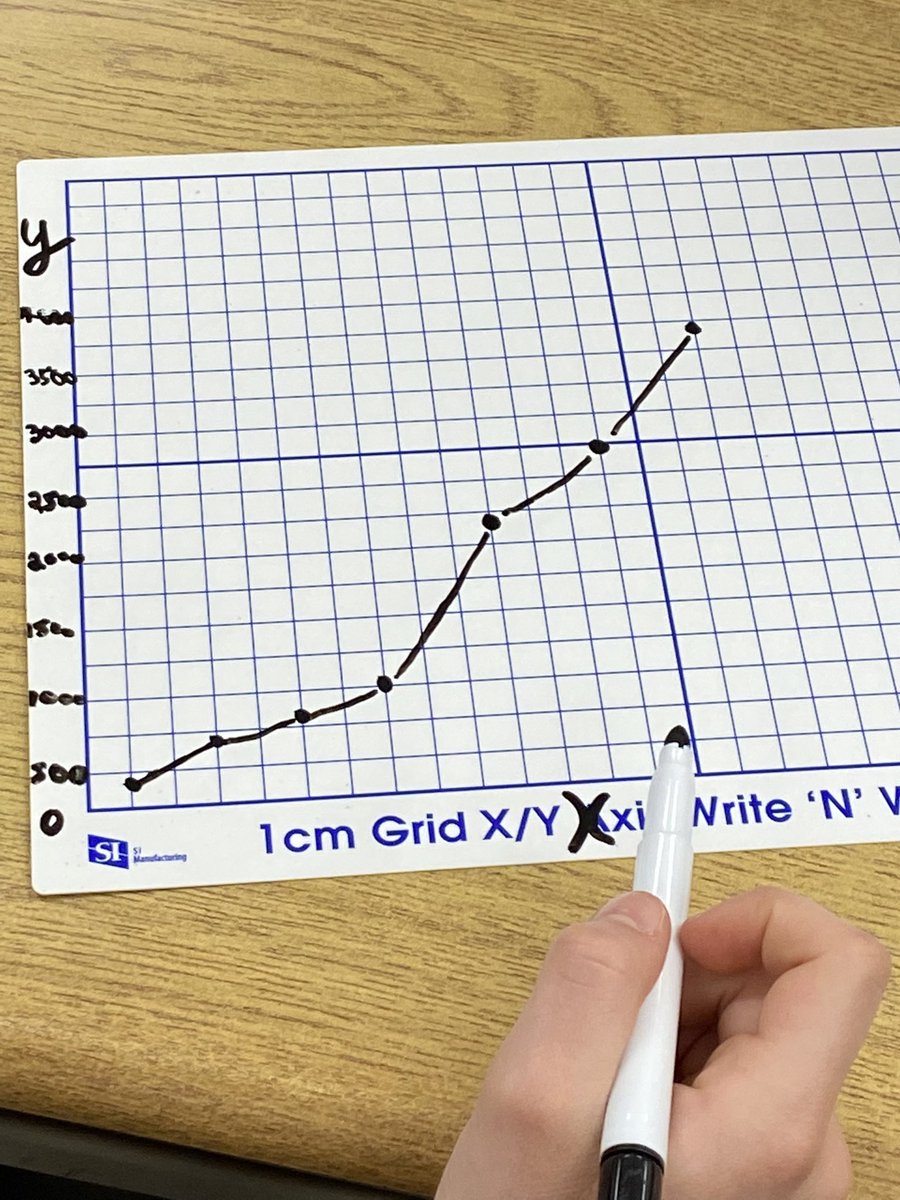
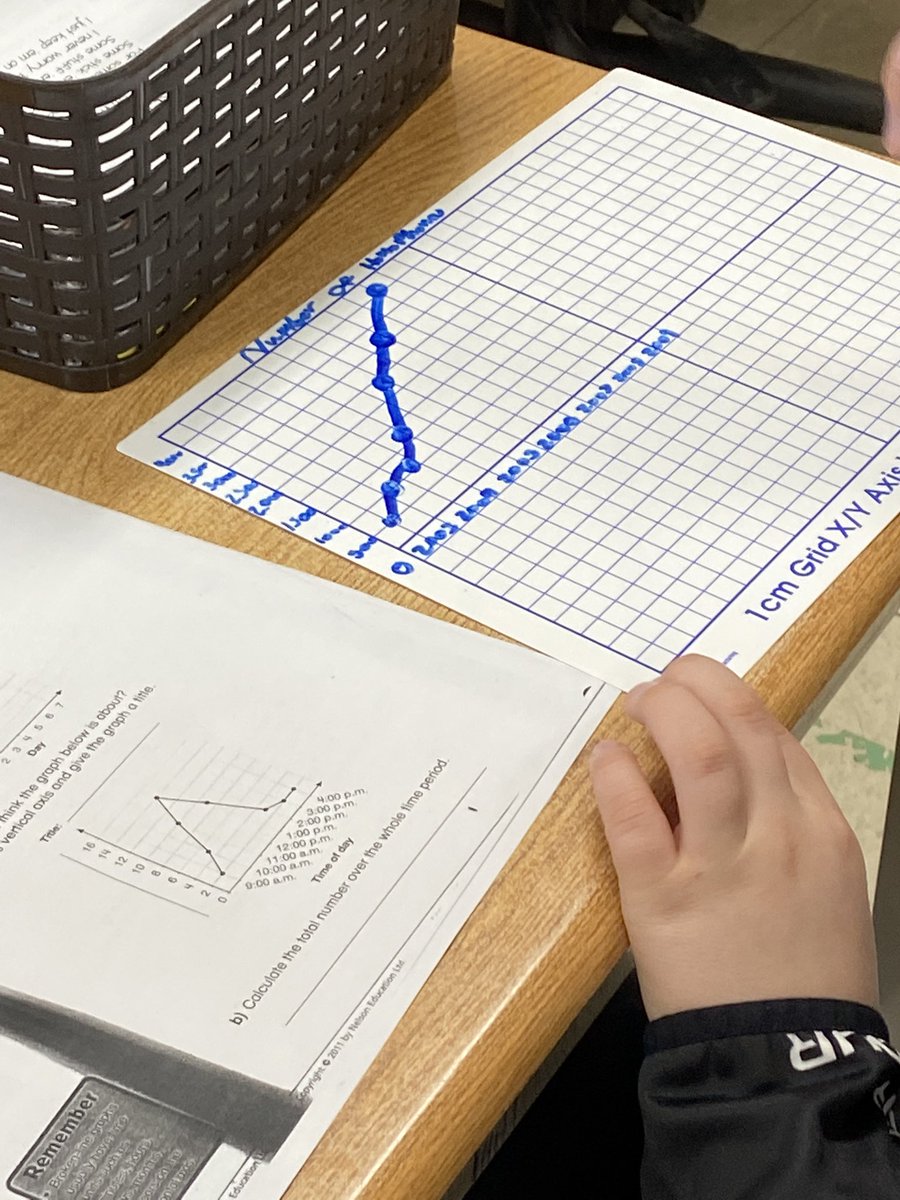
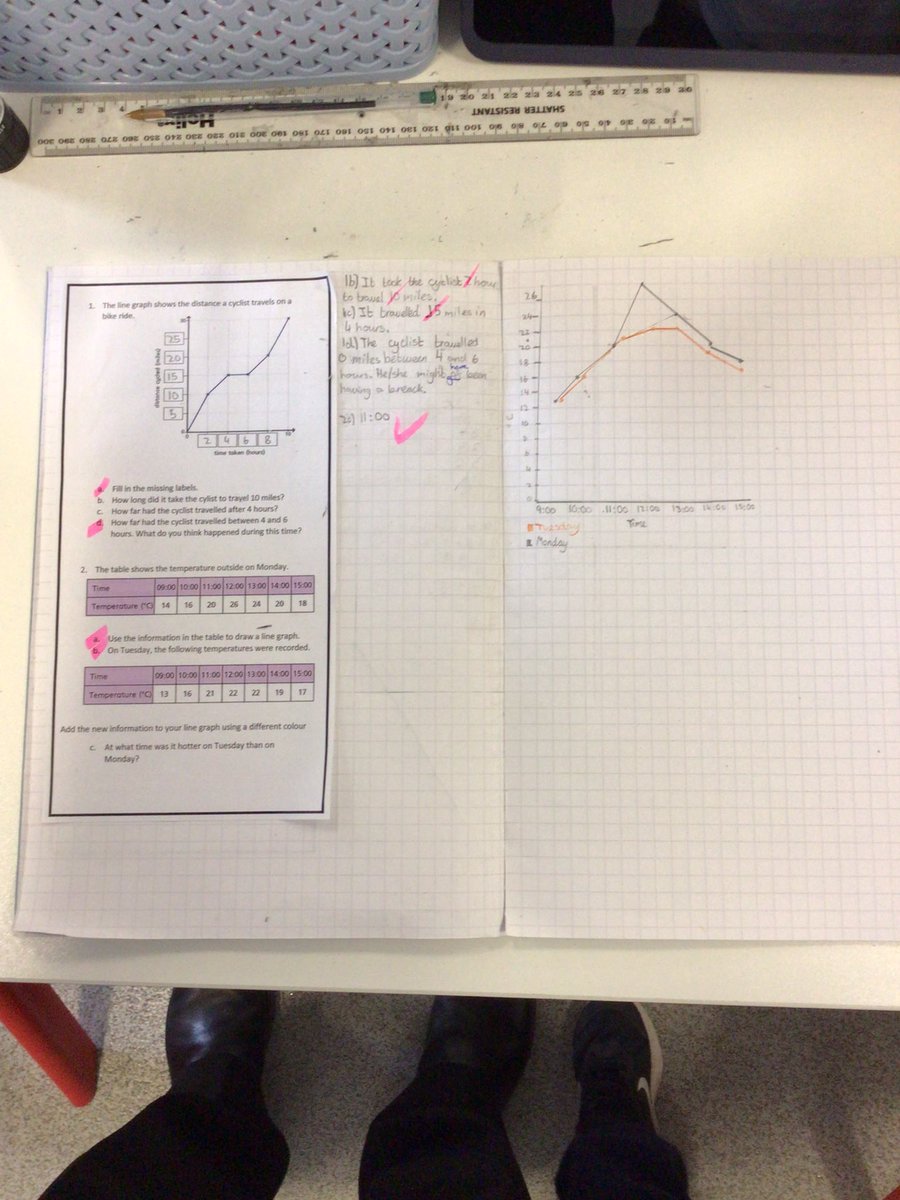
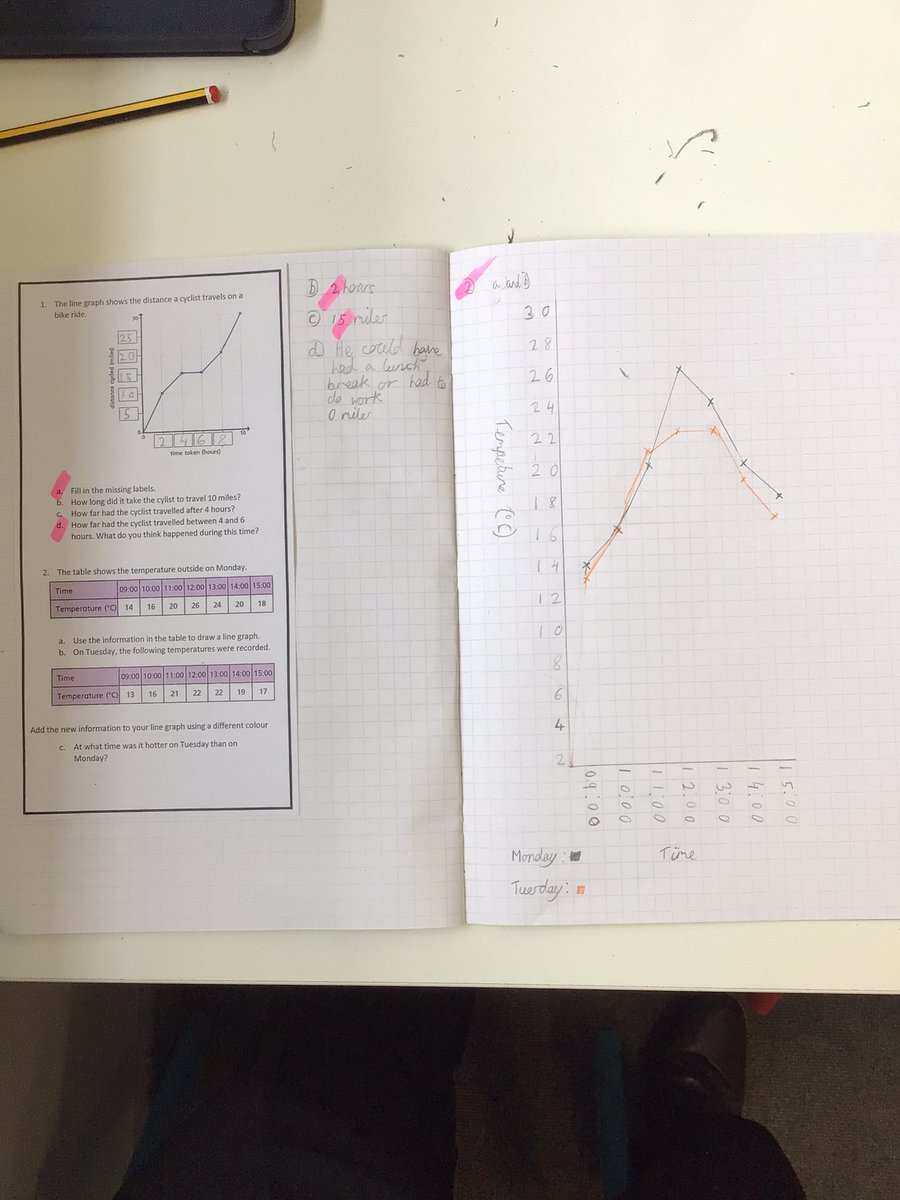
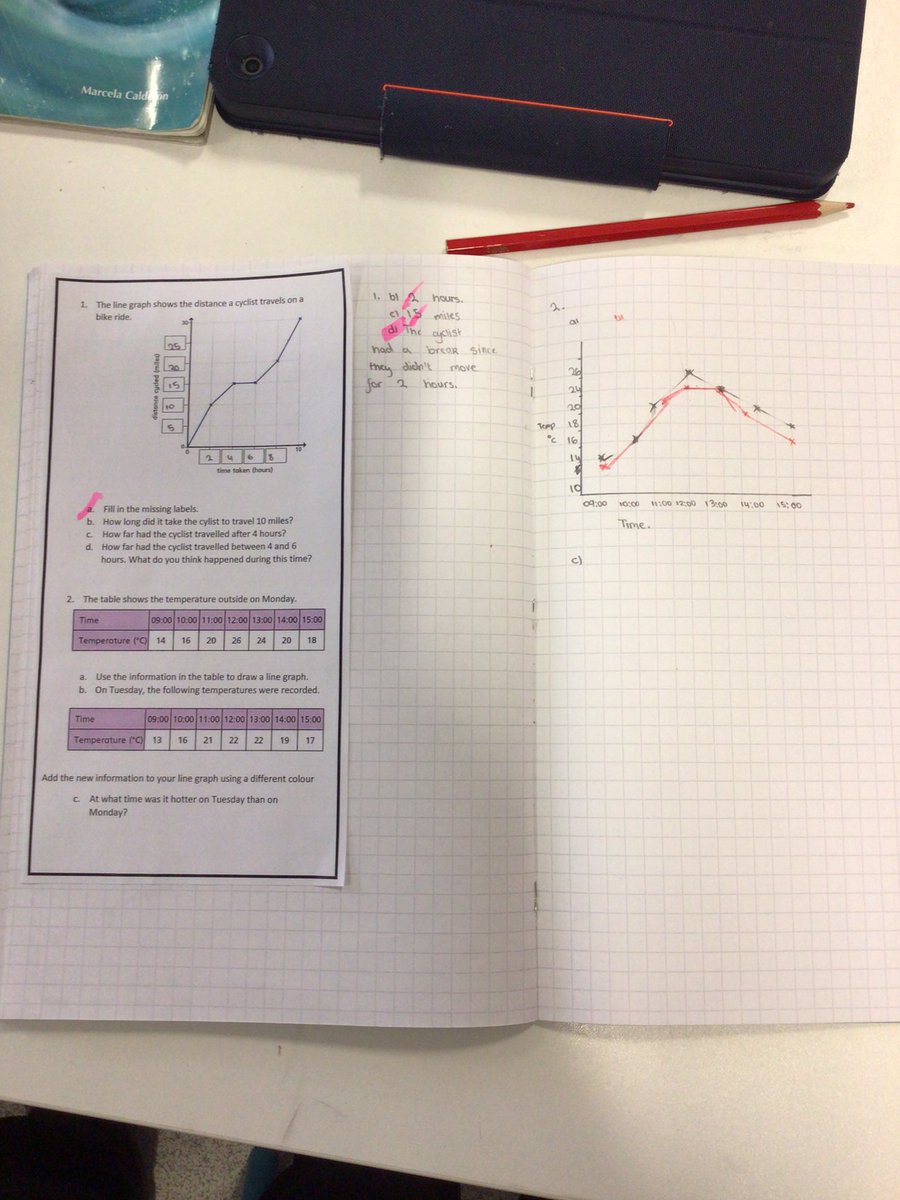
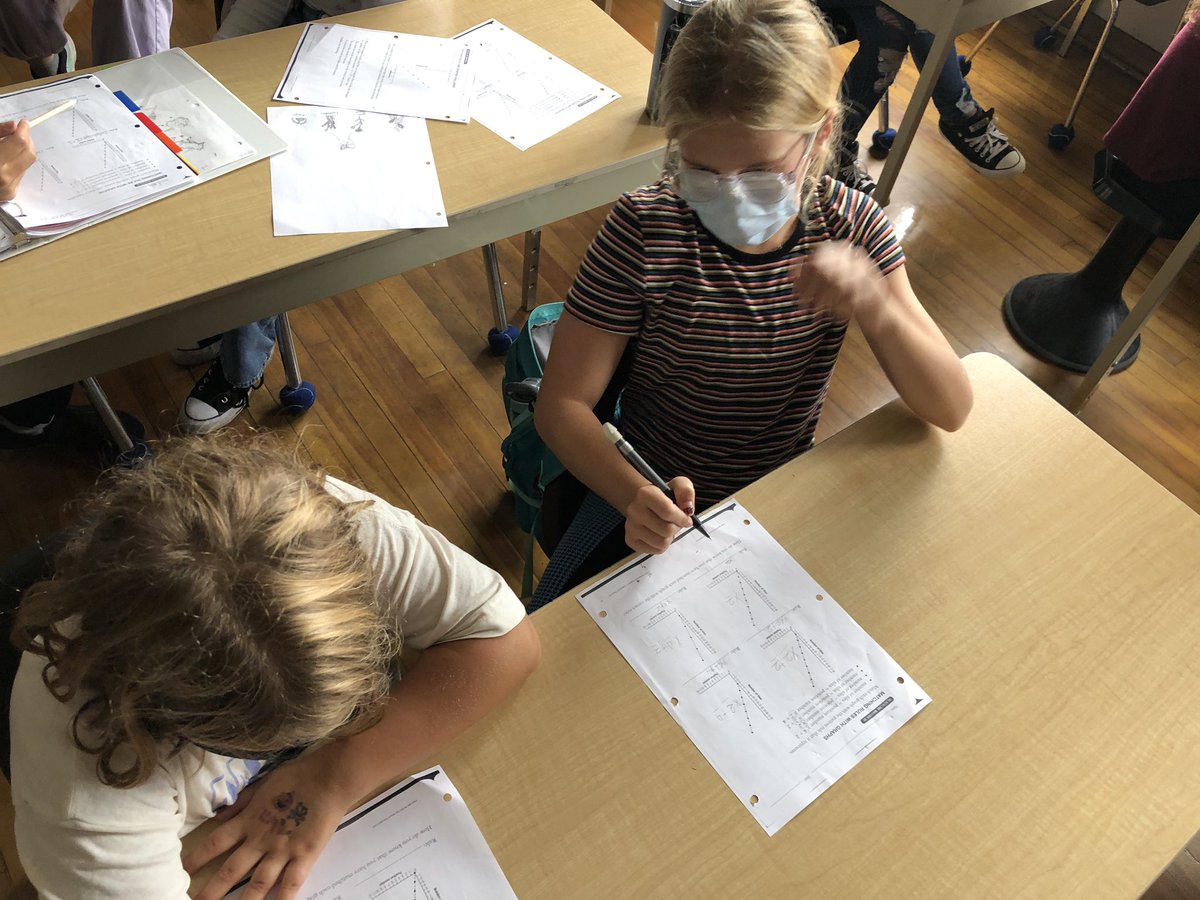
The Grade 5/6’s used the new whiteboards with grids today to create #linegraphs! Thanks for the boards #dsbn! @merritt_ps
5

Grade 6/7s @PortWellerPS used #RatioTables and #LineGraphs and other student-led methods to help solve #Rate problems and make #Connections to #Patterning and #Graphing. #Math #Number #Operations #MathCommunity
1
2

3 Dec 2021
The girls have been busy plotting #linegraphs to show how many presents Santa delivers. Be good and he might come to you!
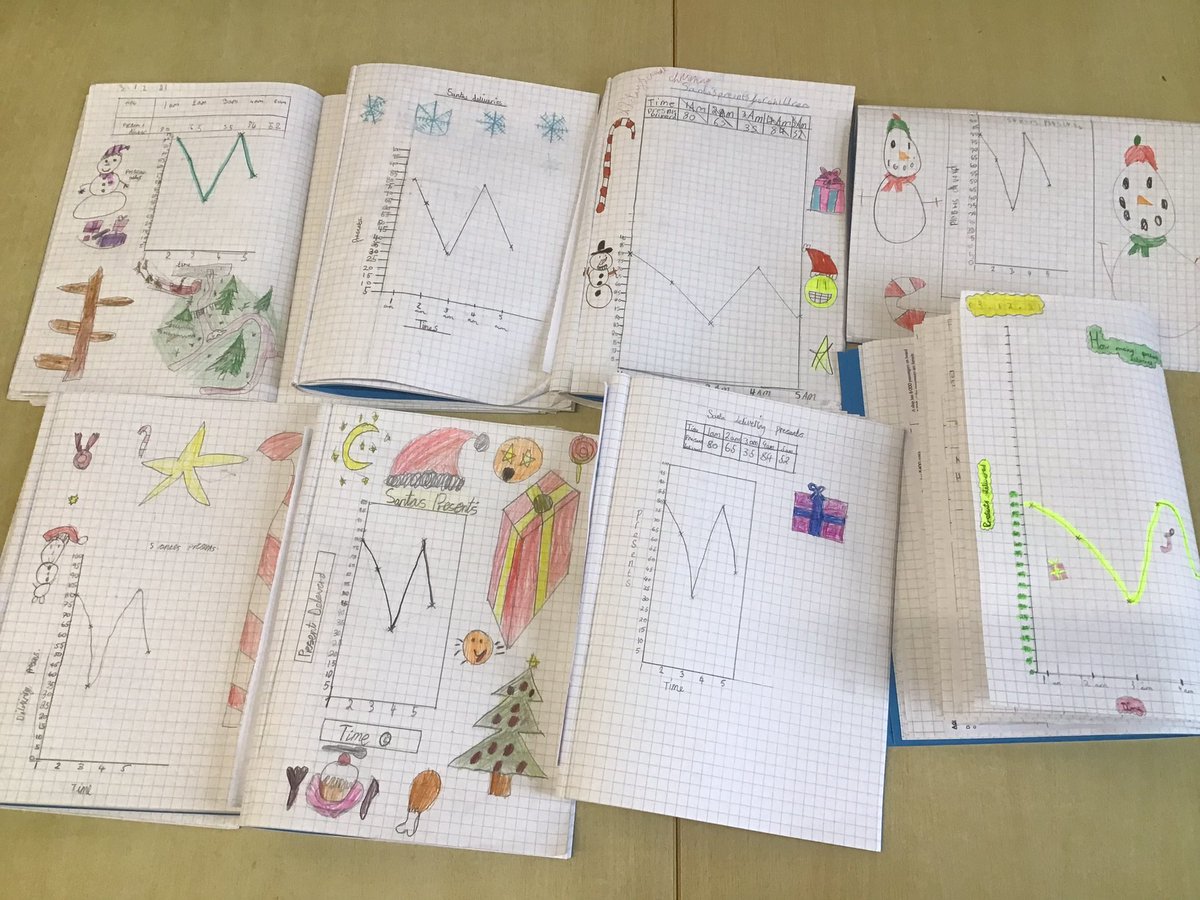
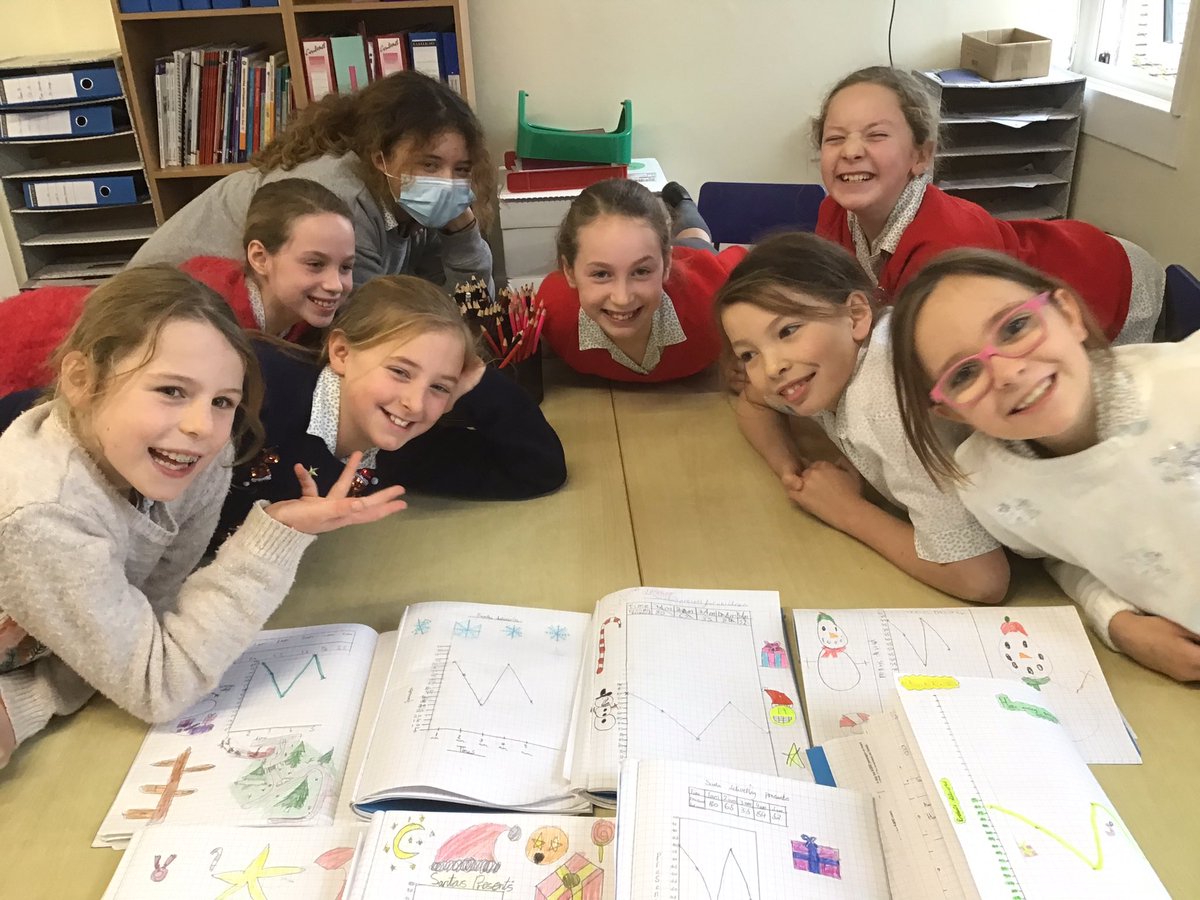
1
2
Grade 6/7s @PortWellerPS analyzed these nine #LineGraphs and tried to guess why there were differences between years and age groups. Thanks @TeatherBoard and @nytimes (The Pandemic Changed How We Spent Our Time: nytimes.com/interactive/2021…) #Data #Math #StoryBehindTheData
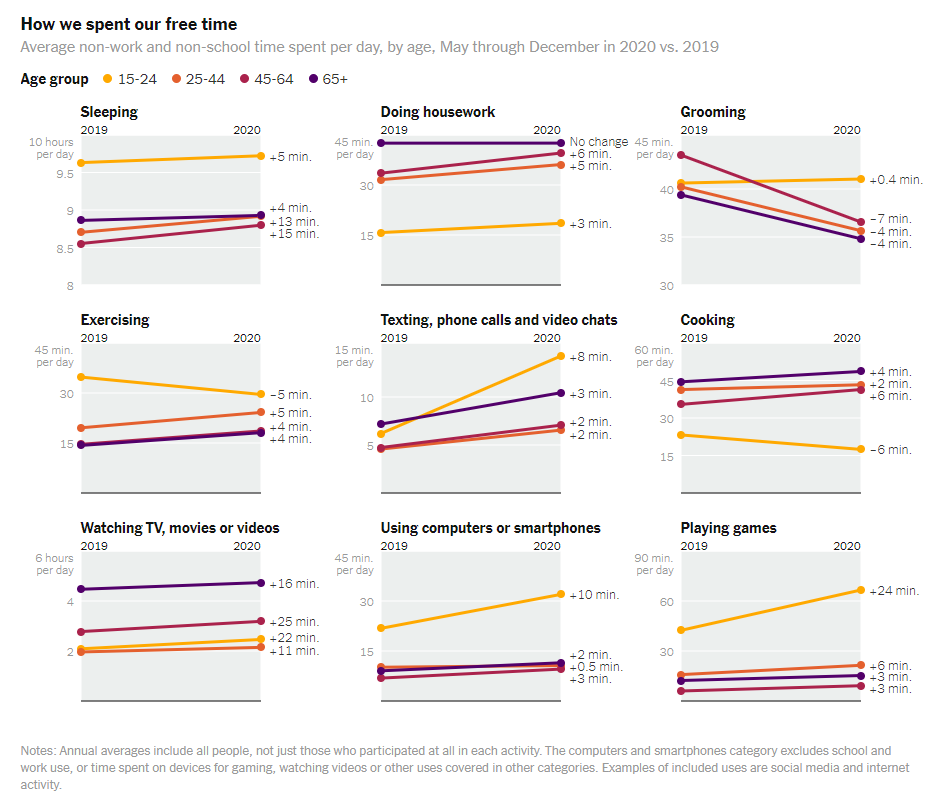
1
3

12 Oct 2021
Another day, another graph for 5MH. Today we looked at line graphs. We needed our #resilience and #perseverance this morning…drawing bar graphs was much easier. However, we got there in the end #Y5 #Maths #LineGraphs
1
2
I’ve just loved the last few days of #Math class as Grade 6/7s @PortWellerPS have been given many opportunities to see the #Relationships between #Pattern rules and their respective #LineGraphs. #FromPatternsToAlgebra @drcathybruce @ruthbeatty11 @TeatherBoard
1
2
10

20 Sep 2021
I've got access to an SoW which has one group activity every lesson, each based on different group sizes (4 to 15) where starters are based on abstract reasoning using pictures, and where entire tasks involve looking up what words mean. There are linegraphs graphs too.
2

13 Aug 2021
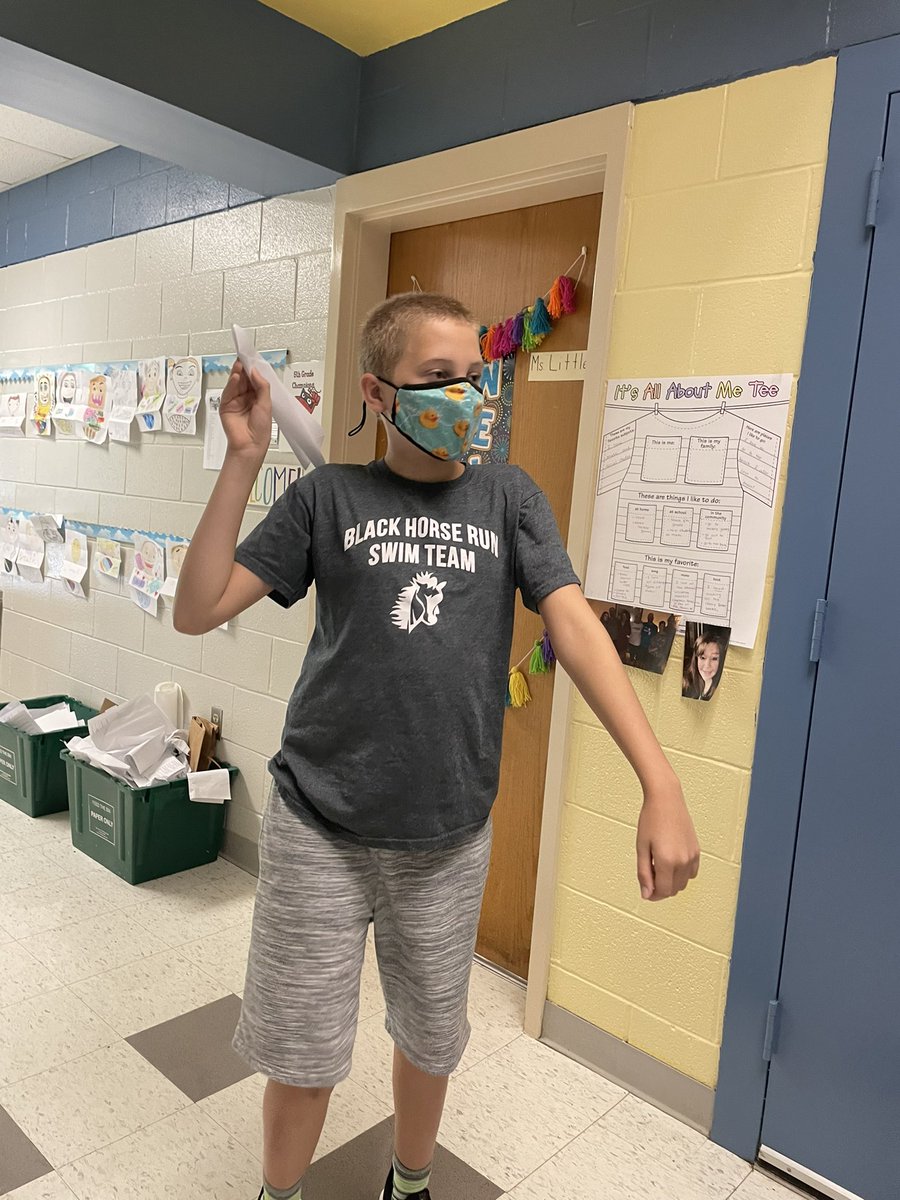
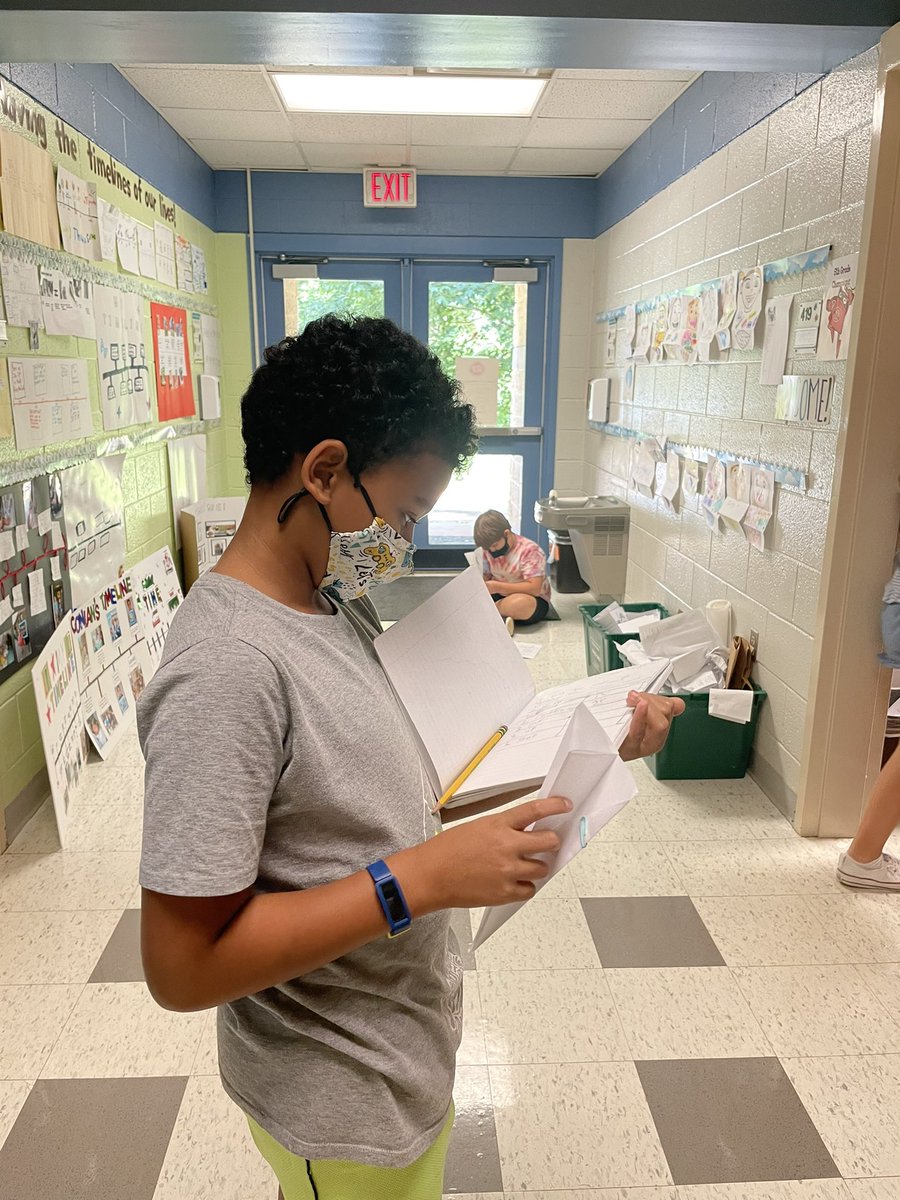
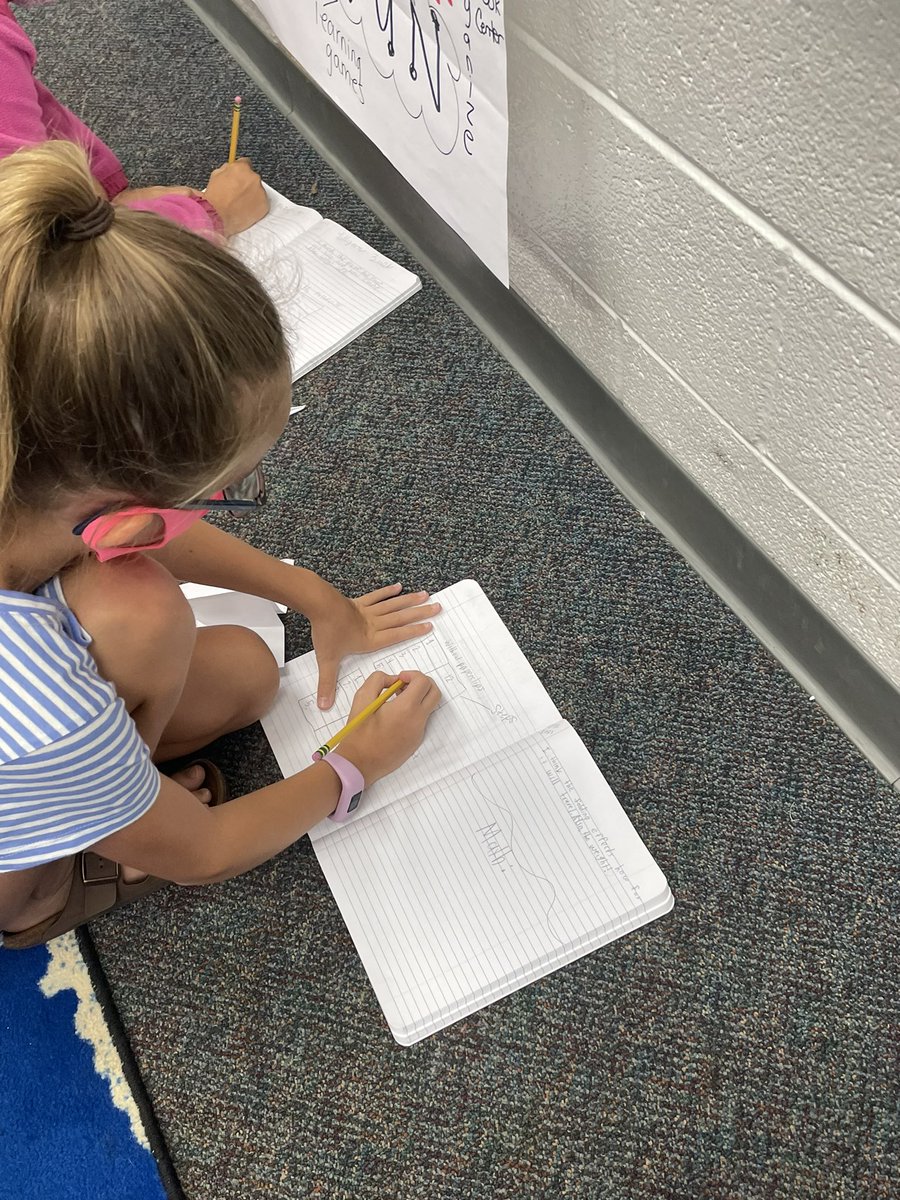
Collecting data from our traveling paper airplanes and graphing it @PleasantUnionYR #linegraphs #datatables

5

24 Jun 2021
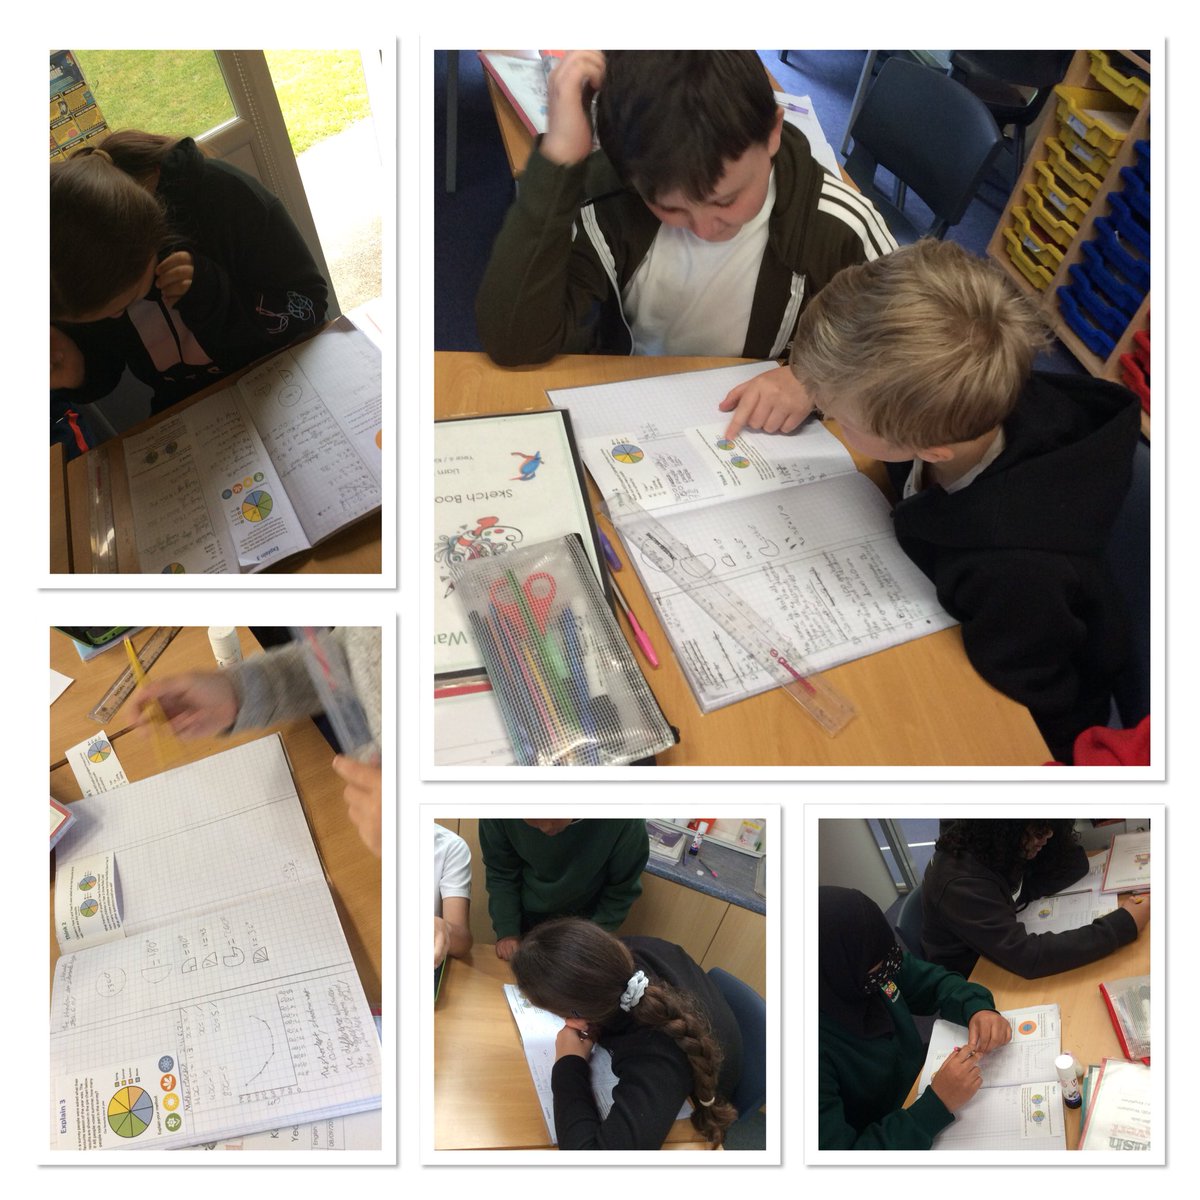
Year 6 are discovering what’s possible with linegraphs and pie charts
1
2
Grade 6s @PortWellerPS analyzed many @Google #Trends today including the popularity differences between #Minecraft and #Roblox searches over the past 13 years. What stories do these #LineGraphs tell? Why did both words spike near the end (2020)? #Math #Data #Graphs @TeatherBoard

1
3

7 May 2021
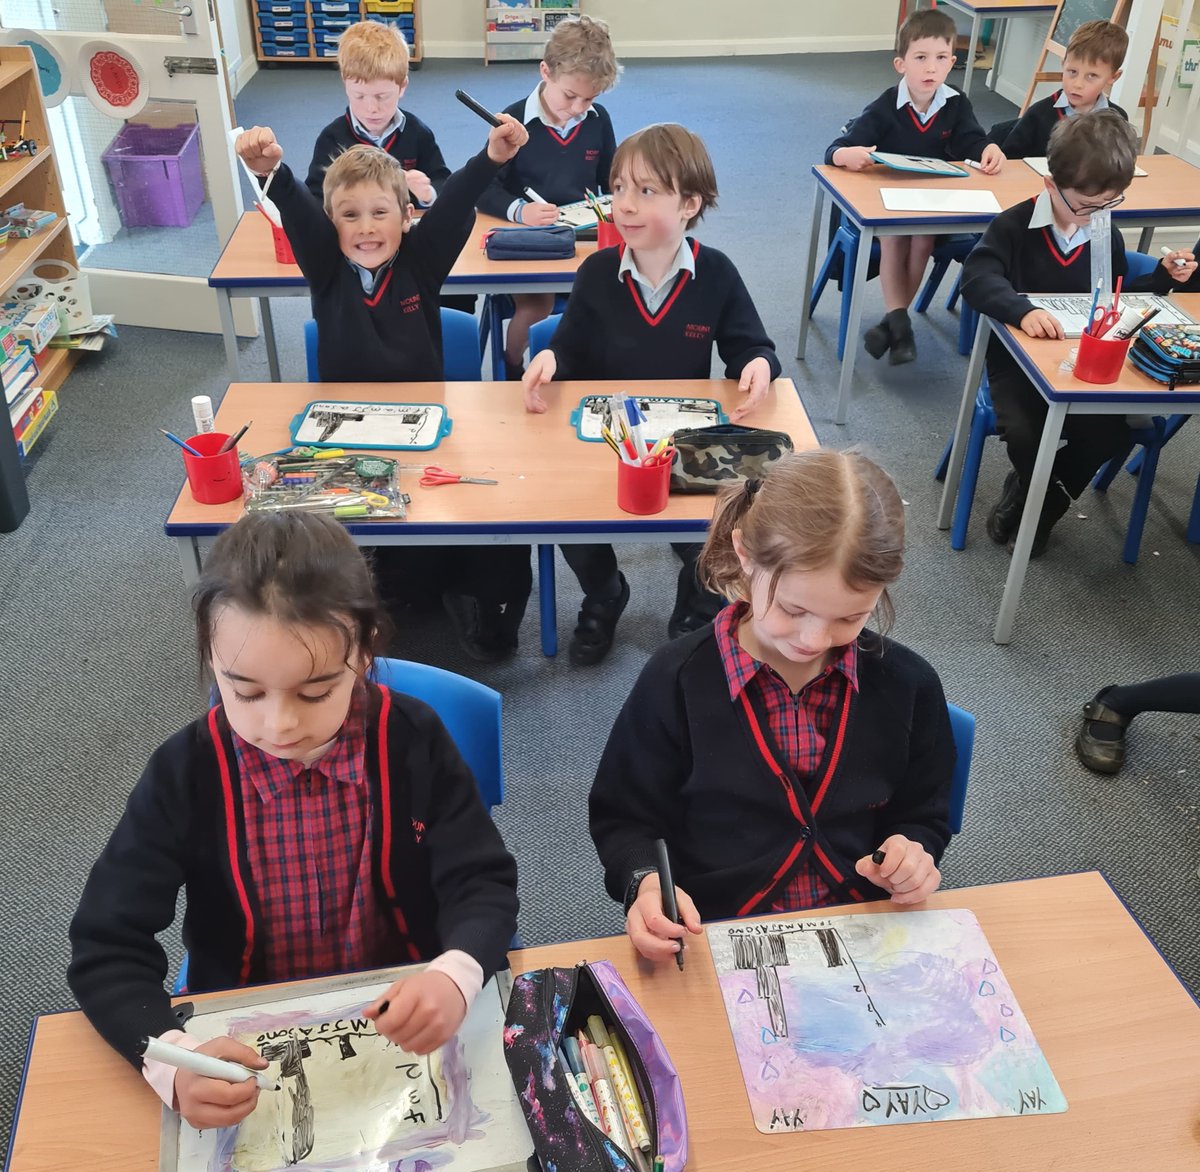
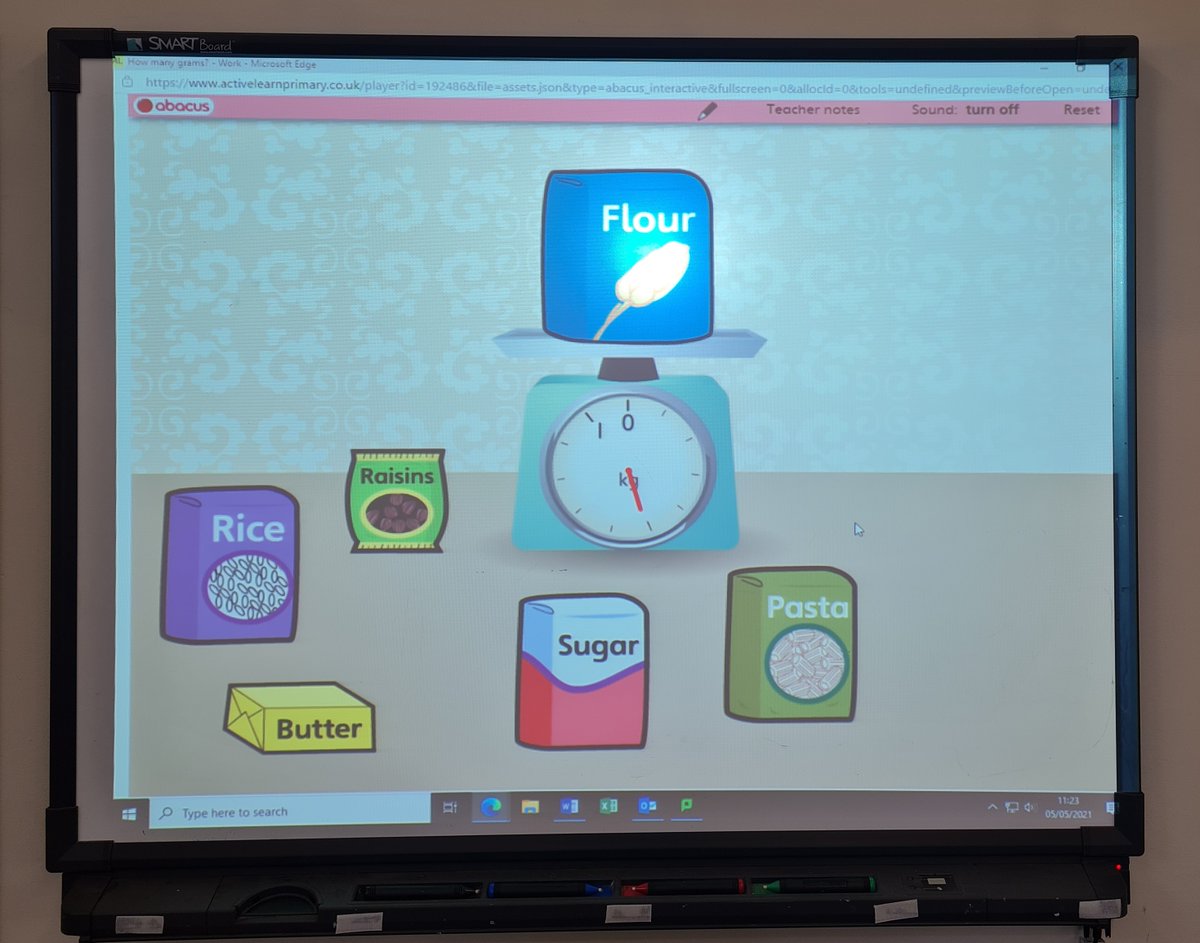
In #Year2, the children have been investigating different types of #data and plotting this information on a variety of graphs. They worked hard to create #bargraphs, #linegraphs and #blockcharts and enjoyed the opportunity to use measuring scales to balance household foods.


3
Grade 6s @PortWellerPS used @knowledgehook three times this week (my first time). They have a lot of #Visual examples to help us understand #Data concepts. #Math #LineGraphs #Notice #Compare #Observe #Analyze
1
2