
⚠️ DISCLAIMER: The option chart shared is strictly for educational purposes only and should NOT be considered a buy/sell recommendation.
Mark this levels on your chart !
🟢 The Green Line represents a major support zone.
❌ Do NOT enter the trade immediately when price touches the support.
✅ Wait for a proper retest of the support level.
✅ Look for confirmation through a Hammer or Pin Bar candle.
✅ Enter only after confirmation.
✅ The low of the confirmation candle will be your Stop Loss.
Patience is the key in trading. Let the setup complete before taking any position. Protect your capital and trade with discipline.
#StockMarket #IndianStockMarket #Nifty #BankNifty #Nifty50 #OptionsTrading #OptionBuyer #OptionSelling #FNO #FnOTrader #PriceAction #SupportResistance #TechnicalAnalysis #ChartAnalysis #TradingSetup #SwingTrading #IntradayTrading #DayTrading #TradingPsychology #RiskManagement #CapitalProtection #MoneyManagement #TraderLife #StockTrader #Investing #MarketAnalysis #Bullish #Bearish #BreakoutStocks #HeroZero #Hero2Zero #StockTips #TradingEducation #LearnTrading #SEBIRegistered #WealthCreation #Finance #IndianStocks #MarketLearning #TradingCommunity

1
9
1,322

Jun 10
💀 DARK SIDE OF SHARE MARKET 💀
₹1 Lakh Invested at IPO Time Worth Today 👇
🔻 Wakefit Innovation → ₹58,000
🔻 Excelsoft Technologies → ₹70,000
🔻 Pine Labs → ₹65,000
🔻 Glottis Ltd. → ₹50,000
🔻 Jaro Institute → ₹61,000
🔻 Solarworld Energy → ₹52,000
🔻 Amir Chand → ₹58,000
🔻 Innovision Ltd. → ₹57,000
🔻 Shree Ram Twistex → ₹40,000
💡 Not every IPO creates wealth. IPO ≠ Guaranteed Profit.
#IPO #StockMarketIndia #Investing #IPOStocks #WealthCreation #MarketLearning
1
362

Jun 9
🚨 Large Caps That Delivered Little to No Returns for Years
Even quality companies can go through long periods of underperformance.
📉 Time Taken to Return to Previous Highs / Deliver Meaningful Returns
▪ ONGC — 12 years
▪ Indian Oil — 9.25 years
▪ ITC — 9 years
▪ TCS — 7.75 years
▪ HUL — 6.5 years
▪ HCL Tech — 5.75 years
▪ Infosys — 5.5 years
▪ Kotak Mahindra Bank — 5.5 years
▪ Asian Paints — 5.5 years
▪ Wipro — 5.5 years
💡 Key lesson:
▪ Great companies don’t always mean great stock returns.
▪ Valuation matters as much as business quality.
▪ Even market leaders can remain stagnant for years.
▪ Patience is important, but so is buying at the right price.
▪ Stock market returns are rarely linear.
🔥 Many investors focus only on winners. Studying periods of underperformance often teaches even more about investing.
Which stock from this list do you believe is closest to starting its next major upcycle? 👇
#StockMarket #Investing #LongTermInvesting #ValueInvesting #IndianStocks #WealthCreation #NSE #MarketLearning #Finance #StocksToWatch
1
1
241
⚠️ DISCLAIMER: The option chart shared is strictly for educational purposes only and should NOT be considered a buy/sell recommendation.
Mark this levels on your chart !
🟢 The Green Line represents a major support zone.
❌ Do NOT enter the trade immediately when price touches the support.
✅ Wait for a proper retest of the support level.
✅ Look for confirmation through a Hammer or Pin Bar candle.
✅ Enter only after confirmation.
✅ The low of the confirmation candle will be your Stop Loss.
Patience is the key in trading. Let the setup complete before taking any position. Protect your capital and trade with discipline.
#StockMarket #IndianStockMarket #Nifty #BankNifty #Nifty50 #OptionsTrading #OptionBuyer #OptionSelling #FNO #FnOTrader #PriceAction #SupportResistance #TechnicalAnalysis #ChartAnalysis #TradingSetup #SwingTrading #IntradayTrading #DayTrading #TradingPsychology #RiskManagement #CapitalProtection #MoneyManagement #TraderLife #StockTrader #Investing #MarketAnalysis #Bullish #Bearish #BreakoutStocks #HeroZero #Hero2Zero #StockTips #TradingEducation #LearnTrading #SEBIRegistered #WealthCreation #Finance #IndianStocks #MarketLearning #TradingCommunity

15
2,329

One Group. Multiple Industries. Endless Impact.
From the car you drive to the software powering global businesses, Tata companies touch millions of lives every day.
#TataGroupCompanies #MarketCap #InvestorInsights #Investing #WealthCreation #IndianMarkets #MSFL #MarketLearning

59

Higher valuation doesn't always mean higher future returns. Compare business fundamentals alongside pricing. unlistedideas.com
#Valuation #Investing #MarketLearning #PreIPO #UnlistedIdeas
5

DIIs holding badh gaya toh stock automatically good investment ban jaye — zaroori nahi.
Bajaj Hindustan ka DII holding ek quarter mein 7.83% se 50.41% tak pahunch gaya, phir bhi investment decision lene se pehle picture ka poora side dekhna zaroori hai. 👀
Sirf holding percentage mat dekho — yeh bhi dekho ki kaun buy kar raha hai. Mutual Funds? Ya banks loan settlement ke through shares hold kar rahe hain?
Promoter holding bhi 24% se 13% tak gir gayi. Numbers dekhna important hai, lekin unke peeche ki story samajhna aur bhi important hai.
Research first. Invest later. 💡📊
#StockMarket #Investing #ShareMarket #DII #BajajHindustan #StockAnalysis #MarketLearning #FinanceTips #InvestmentStrategy #SRWealth #reels #viralreel
3
7
60
4,609

May 26
“Markets reward patience far more than excitement.
The calm learner survives longer than the emotional trader.”
Join SD’s WhatsApp Channel for regular market insights, learning updates, psychology wisdom, and important announcements — all in one place. 📊✨
Stay connected to the process, not just the profits.
📌Follow the Multi-Asset Trading with SD channel on WhatsApp: whatsapp.com/channel/0029VaR…
#TradingPsychology #StockMarketIndia #MarketLearning #SaanandoDas #TradingMindset #InvestSmart #MarketWisdom
1
138

May 23
A beautiful beginning to our flagship event — Niveshak Darbaar 8.0
With the sacred Deep Prajwalan ceremony, we officially began a day dedicated to knowledge, financial growth, market wisdom & meaningful learning.
The energy, positivity and enthusiasm in the room truly reflected the spirit of Niveshak Darbaar 8.0 — where passionate investors, learners & market experts come together under one roof.
This is not just an event, it’s a movement towards financial awareness and wealth creation.
#NiveshakDarbaar8 #FlagshipEvent #SodhaniGroupOfCompanies #DeepPrajwalan #SAFEFintech #FinancialLiteracy #WealthCreation #StockMarket #InvestorAwareness #MarketLearning #RajeshKumarSodhani #MumbaiEdition
1
2
868

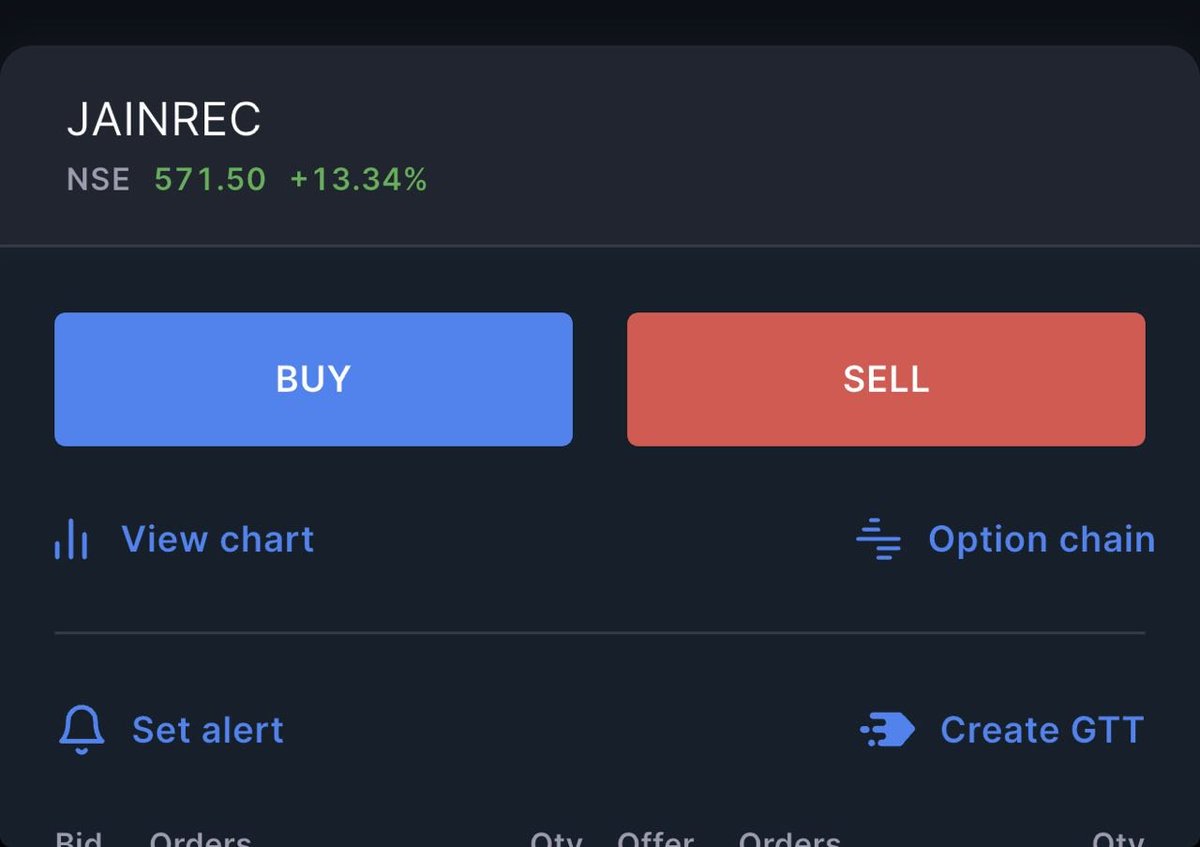
Not every exit will be at the exact top — and that’s perfectly fine 👍
Exited #JAINREC at ₹535
Stock later touched around ₹594 today.
Exited #TEJAS at around ₹535
Closed near ₹515.
Profit booked is always better than regret. Discipline matters more than catching every last rupee 🔥
That’s how trading works — protect capital, respect the system, and move on to the next opportunity.
#Trading #StockMarket #JAINREC #TEJAS #SwingTrading #Investing #MarketLearning #IndianStockMarket
Disclaimer: This is for educational purposes only. Please consult your financial advisor before taking any investment decision.
3
5
465

📊 DAY – 07 | 🌙 Moon Strength for Intraday Trading (Birth Chart)
📌 Intraday trading के लिए Moon strong होना बहुत जरूरी है
क्योंकि Moon = Mind, Emotions, Decision Making
🔍 अपने Birth Chart में Moon के लिए ये 5 चीजें जरूर check करें:
1️⃣ Moon in Gand Mool Nakshatra
🔸 अगर Moon Gand Mool में है → instability / emotional imbalance
🔸 Trading में जल्दबाजी और गलत फैसले हो सकते हैं
2️⃣ Moon Affliction (Rahu / Ketu / Saturn / Sun)
🔸 Moon अगर conjunct (degree-wise close) हो:
👉 Rahu / Ketu → Confusion / illusion
👉 Saturn → Fear / delay
👉 Sun → Ego / overconfidence
3️⃣ Moon Gochar from Lagna (Transit Position)
🔸 Moon अगर 6th / 8th / 12th से transit कर रहा है
👉 Loss, stress, गलत decisions की संभावना
👉 Avoid aggressive trading
4️⃣ Moon Strength in Ashtakavarga
🔸 High points → Strong support / clarity
🔸 Low points → Weak mindset / unstable decisions
5️⃣ Kemadruma Yoga (केमद्रुम योग)
🔸 जब Moon के आस-पास कोई ग्रह नहीं होता
🔸 Gives isolation, emotional imbalance
🔸 Trading discipline पर असर पड़ता है
⚡ Trading Insight:
👉 Strong Moon → Better decision making discipline
👉 Weak Moon → Overtrading / fear / गलत entries
👉 Moon strong हो तो intraday consistency improve होती है
📌 Conclusion:
👉 Moon strong = Trader strong
👉 Moon weak = Mind weak → Loss probability high
#BankNifty #Nifty50 #StockMarket #Intraday #OptionsTrading #FinancialAstrology #AstroTrading #TradingPsychology #ShareMarket #IndianStockMarket #MarketLearning #DayTrading #SwingTrading #AstrologyTrading #MoonPower
3
25
968
📊 DAY – 06 | 🌙 Moon Part – 02 (Financial Astrology)
🌑 Financial Astrology में Tithi का महत्व
📊 Tithi क्या होती है?
🔸 तिथि सूर्य ☀️ और चंद्रमा 🌙 के बीच के कोण (Angular Distance) पर आधारित होती है
🔸 एक चंद्र मास में कुल 30 तिथियां होती हैं (15 शुक्ल पक्ष 15 कृष्ण पक्ष)
🔸 हर तिथि की अपनी ऊर्जा (Energy) और मार्केट पर प्रभाव होता है
📊 📌 मार्केट में Tithi क्यों महत्वपूर्ण है?
🔸 तिथि मार्केट की भावनात्मक ताकत (Emotional Strength) को दर्शाती है
🔸 यह बताती है कि मार्केट में सस्टेनेबिलिटी होगी या नहीं
🔸 ट्रेंड टिकेगा या फेल होगा — इसमें तिथि का बड़ा रोल होता है
📊 📌 Tithi के अनुसार मार्केट व्यवहार:
🔹 नंदा तिथि (1, 6, 11)
🔹 भद्रा तिथि (2, 7, 12)
🔹 जया तिथि (3, 8, 13)
🔹 रिक्ता तिथि (4, 9, 14)
🔹 पूर्णा तिथि (5, 10, 15)
📊 ⚡ ट्रेडिंग में उपयोग कैसे करें?
👉 Strong Tithi Strong Moon → साफ ट्रेंड
👉 Weak Tithi Weak Moon → Choppy / Sideways
👉 रिक्ता तिथि → Fake moves से सावधान
👉 जया तिथि → Momentum trading के लिए बेहतर
📊 Financial Astrology में Kshay Tithi & Vriddhi Tithi का महत्व
🌑 1️⃣ Kshay Tithi (क्षय तिथि)
🔸 जब कोई तिथि “स्किप” हो जाती है (कैलेंडर में नहीं आती)
🌕 2️⃣ Vriddhi Tithi (वृद्धि तिथि)
🔸 जब एक ही तिथि दो दिन तक रहती है
#BankNifty #Nifty50 #StockMarket #Trading #Intraday #OptionsTrading #FinancialAstrology #AstroTrading #ShareMarket #IndianStockMarket #MarketLearning #StockTrader #MarketAnalysis #NSE #BSE #DayTrading #SwingTrading #MoonTransit #Tithi #AstrologyTrading

7
46
1,974

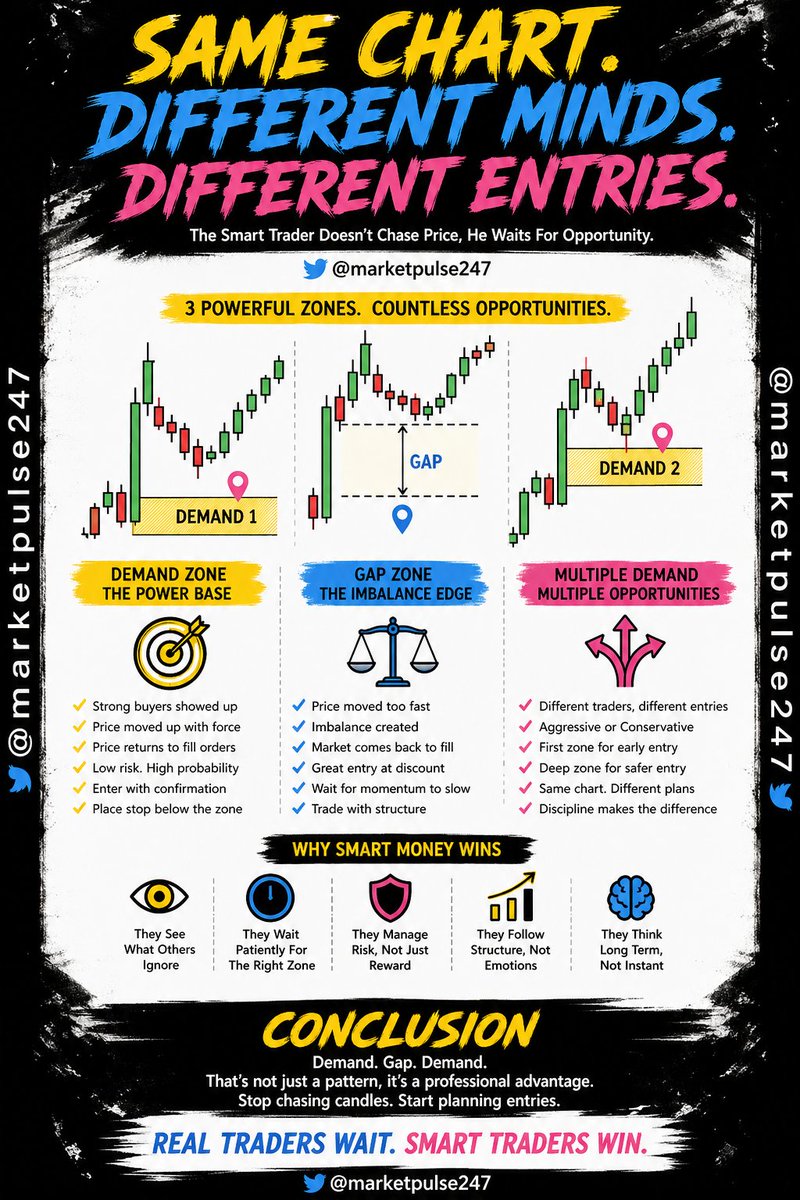
DIFFERENT TRADERS SAME CHART DIFFERENT ENTRIES
Smart Money Secret Entry Zones
Every trader looks at the same chart but very few understand where the real opportunity lies. Retail traders often chase breakouts and fast moving candles because momentum feels exciting and urgent. Smart money operates differently. Institutions and experienced traders wait patiently for price to return to high probability areas where risk is low and reward is high. These areas are known as demand zones and imbalance zones. A demand zone is formed when strong buying pressure pushes price aggressively upward leaving behind evidence of institutional participation. Instead of buying at the top smart traders wait for price to retrace into that zone. This patience allows them to enter closer to the origin of the move. The result is better risk management smaller stop loss and higher probability of continuation. The chart may look simple but the mindset behind the entry makes all the difference between random trading and strategic positioning.
Demand Zone The Power Base
A demand zone represents an area where buyers previously overwhelmed sellers and created a strong bullish move. When price revisits this zone it often reacts because unfilled orders may still be present. Smart traders mark these areas carefully and observe price behavior when it returns. They look for confirmation such as strong rejection candles increased volume or momentum shift before entering. The key advantage of trading demand zones is structure based risk control. Stops can be placed just below the zone while targets can aim for previous highs or fresh liquidity areas. This creates a favorable risk reward ratio which is essential for long term profitability. Instead of emotional buying traders rely on logic and historical price behavior. Demand trading is not about predicting the future but about reacting to proven areas where institutions have already shown interest. This professional approach separates disciplined traders from impulsive participants.
Gap Zone The Imbalance Edge
A gap or imbalance occurs when price moves so aggressively that it leaves inefficient trading behind. This creates a visible space between candles where little to no trading occurred. Such gaps signal urgency and strong institutional activity. Markets often return to fill these imbalances before continuing in the original direction. Smart traders use these zones as precision entry points. When price retraces into the gap area they watch for slowing momentum or bullish confirmation before taking a position. Trading imbalances allows entries at discounted prices within a bullish trend. It also provides clarity in invalidation levels because once the gap is fully broken the original strength may be compromised. Understanding imbalance trading gives traders a structural framework instead of random guesswork. It teaches patience discipline and the importance of waiting for price to come to your level rather than chasing candles in fear of missing out.
Multiple Demand Areas Multiple Opportunities
Not every demand zone is equal and sometimes charts present multiple demand areas. The first demand zone may offer an aggressive entry while the second deeper demand zone may provide a safer conservative entry. Different traders choose different approaches based on their risk appetite and trading plan. Aggressive traders enter at the first sign of reaction while conservative traders wait for deeper retracements and stronger confirmation. Both can succeed if they follow proper risk management and remain consistent. The key lesson is that the same chart can produce different profitable entries depending on strategy. What matters most is clarity of plan and disciplined execution. Smart money does not chase price after it has already moved significantly. It waits calmly at pre identified zones. Demand gap demand is not just a pattern it is a framework for structured trading decisions that align with institutional behavior.
Conclusion The Real Move Starts With Patience
The difference between average traders and consistently profitable traders lies in patience positioning and precision. Demand zones and gap areas highlight where institutions likely accumulated positions. By waiting for price to return to these areas traders improve probability and reduce emotional decision making. The chart remains the same but the mindset changes everything. Stop chasing momentum and start planning entries at high probability zones. Demand gap demand is where structured trades are born and where real moves often begin.
x.com/@marketpulse247
#StockMarket #TradingPsychology #SmartMoney #DemandZone #SupplyDemand #PriceAction #TechnicalAnalysis #TradingStrategy #IntradayTrading #SwingTrading #ChartAnalysis #MarketStructure #RiskManagement #StockTrader #ForexTrading #CryptoTrading #IndianStockMarket #Nifty #BankNifty #EquityTrading #VolumeAnalysis #MarketEducation #TradingTips #InvestingIndia #FinancialFreedom #MarketLearning #CandlestickChart #Imbalance #GapTrading #InstitutionalTrading #RetailTrader #TradingMindset #SupportResistance #TrendTrading #MomentumTrading #BreakoutTrading #TradingDiscipline #MarketOpportunities #WealthCreation #StockEducation #LearnTrading #ProfessionalTrader #TradingLife #MarketMoves #CapitalGrowth #TechnicalTrader #LongTermSuccess #StockAnalysis #TradeSmart #MarketWisdom
3
4
102
TRADE TO WIN NOT TO ESCAPE LOSSES THE REAL TRADER MINDSET
Success Begins With Intention Not Fear
Most traders enter the market with one hidden emotion fear. Fear of losing money fear of being wrong fear of missing out. When you trade with fear your decisions become defensive and emotional. You exit winners too early and hold losers too long. But when you trade with the intention to succeed your mindset changes completely. You begin to focus on executing your strategy with discipline instead of reacting to every market fluctuation. Intention brings clarity. It forces you to prepare analyze and act with confidence. Professional traders do not aim to avoid losses they aim to follow their edge consistently. The market rewards those who think long term and act with conviction. If your primary goal is to avoid pain you will hesitate. If your goal is to grow and improve you will execute boldly. Trading is not about survival mode it is about strategic advancement with calculated risk and controlled emotion.
Losses Are Not Failures They Are Business Expenses
Every successful trader understands one undeniable truth losses are part of the process. You cannot eliminate them and you should not fear them. Losses are tuition fees paid to the market for experience wisdom and refinement. When you accept this reality you stop taking losses personally. A losing trade does not mean you are a bad trader. It simply means this particular setup did not work this time. Even the best strategies have drawdowns. What separates amateurs from professionals is how they respond. Amateurs panic and abandon their system after two losses. Professionals review adapt and continue executing with discipline. Think of trading as a business. Every business has expenses rent salaries marketing. In trading losses are operational costs. The objective is not to avoid them but to ensure your profits outweigh them over time. Consistency discipline and risk management turn small losses into stepping stones for sustainable growth.
Embrace the Process Not Just the Profits
Many traders are addicted to winning trades because profits give emotional validation. But real growth comes from embracing the entire process including losses mistakes and slow periods. When you focus only on profits you become impatient and impulsive. When you focus on process you become stable and confident. A strong process includes proper risk management position sizing emotional control and journaling your trades. It means following your plan even after a losing streak. Embracing losses does not mean enjoying them it means accepting them without emotional collapse. Each loss carries information. It shows whether your setup needs refinement or whether market conditions have shifted. Traders who respect the process build resilience. They do not chase revenge trades or double position size out of frustration. They understand that long term success is built on thousands of disciplined decisions not on one lucky breakout.
Confidence Is Built Through Acceptance And Discipline
True confidence in trading is not built from winning streaks it is built from discipline. When you know that you can follow your system regardless of outcomes you develop emotional stability. Acceptance of losses removes fear and reduces hesitation. You begin to execute trades with clarity because you understand the risk before entering. This calm approach improves performance dramatically. Fear based trading leads to inconsistent results while disciplined trading creates predictable patterns of growth. Confidence also comes from preparation. Backtesting analyzing charts and understanding probability gives you conviction. When losses occur you remain composed because they were already accounted for in your plan. The goal is not perfection the goal is progress. Every disciplined action strengthens your mindset. Over time the market begins to reward consistency. When intention replaces fear and discipline replaces emotion you transform from a reactive trader into a strategic professional.
CONCLUSION TRADE WITH COURAGE TRUST THE PROCESS AND LET LOSSES TEACH YOU
Trading success is not about avoiding losses it is about mastering your mindset. Enter the market with intention clarity and discipline. Accept losses as part of the journey and focus on long term consistency. When you trade to succeed instead of trading to avoid failure you unlock real growth confidence and financial progress.
x.com/@marketpulse247
#TradingMindset #StockMarketIndia #NiftyTrader #BankNifty #IntradayTrading #SwingTrading #PriceAction #RiskManagement #TradingPsychology #TraderLife #InvestingIndia #ShareMarket #TechnicalAnalysis #OptionTrading #FuturesTrading #Discipline #Consistency #MarketEducation #FinancialFreedom #WealthCreation #MarketStrategy #ChartAnalysis #StopLoss #ProfitBooking #LongTermSuccess #MarketLearning #StockTrader #TradingJourney #MarketWisdom #CapitalGrowth #EmotionalControl #TradeSmart #LearnTrading #StockMarketTips #EquityMarket #DerivativesTrading #TradingSuccess #MindsetMatters #TraderCommunity #MarketDiscipline #FinancialGrowth #InvestmentGoals #BullMarket #BearMarket #MarketVolatility #ProfessionalTrader #TradingRules #MarketFocus #SmartInvesting #IndianStockMarket

4
4
112

Apr 22
📊 Market ka ek Powerful Rule… aur life ka bhi!
Aksar aapne charts par dekha hoga —
Jitna bada sideways consolidation, utna hi bada aane wala trend.
Ab Trend upar ka hoga ya neeche ?
👉 Ye depend karta hai company ke fundamentals par.
💡 Exactly same cheez life me bhi apply hoti hai…
Agar aaj aapko lag raha hai ki growth nahi ho rahi, progress slow hai —
to shayad aap sideways phase me ho.
Is phase me panic nahi,
👉 Fundamentals strong karne ka time hota hai.
(Skills, discipline, mindset, patience)
⏳ Aur fir aata hai breakout…
Aur yaad rakho —
🔥 Jitna bada consolidation, utna powerful trend !
आसान शब्दों में कहें तो ..
" जो देर से आता है वो दूर तक जाता है " 🚀
Stay patient. Stay prepared. Your breakout is coming.
#StockMarket #TradingPsychology #Investing #MarketWisdom #WealthCreation #TraderLife #StockMarketIndia #FinancialFreedom #MindsetMatters #PatiencePays #LongTermThinking #SuccessMindset #Discipline #TradingJourney #MarketLearning
5
30
278
THE MOST DANGEROUS PEOPLE IN THE MARKET ARE NOT WHO YOU THINK
1. THE IGNORANT TRADER TRAP EVERY BEGINNER FALLS INTO
Most people enter the stock market with excitement but without preparation. They follow tips from friends, social media, or random news headlines without understanding what they are doing. This is the first category Howard Marks talks about. These traders don’t know risk management, position sizing, or even why a stock is moving. They chase momentum blindly and panic during corrections. The biggest mistake they make is believing that the market is easy money. When losses come, they don’t know how to react, so they either exit at the worst time or average blindly. Ignorance in the market is not just lack of knowledge, it is lack of awareness about risk. The market punishes this harshly. If you don’t know what you are doing, the market becomes a casino, and in a casino, the odds are never in your favor.
2. THE OVERCONFIDENT EXPERT WHO LOSES BIGGER
The second category is even more dangerous. These are people who think they know everything. They have some experience, maybe a few successful trades, and now they believe they have mastered the market. This overconfidence leads to bigger risks and careless decisions. They stop respecting the market and start believing they can predict it. This is where losses become massive. Unlike beginners, they take larger positions, ignore stop losses, and double down on losing trades because they are “sure” they are right. The market doesn’t reward ego. It rewards discipline. Overconfidence blinds traders to new information and changing trends. When reality hits, the damage is much larger because of the size of their bets. Knowing a little and thinking you know everything is more dangerous than knowing nothing at all.
3. WHY THE MARKET HUMBLES EVERYONE EVENTUALLY
The stock market has one unique characteristic. It humbles everyone at some point. Whether you are a beginner or an experienced trader, the market will test your patience, discipline, and mindset. People who know nothing lose quickly, but people who think they know everything lose slowly and painfully. The market keeps changing. Strategies that worked yesterday may fail today. Trends reverse, sentiment shifts, and unexpected events shake everything. If you are rigid in your thinking, you will break. The only way to survive is to stay adaptable. The market is not about being right all the time. It is about managing risk when you are wrong. The moment you believe you have “figured it all out,” that’s when the market is preparing to teach you a lesson you won’t forget.
4. THE REAL EDGE IS NOT KNOWLEDGE BUT DISCIPLINE
Most traders believe that success comes from knowing more indicators, strategies, or patterns. But the truth is different. The real edge in the market is discipline. You can have the best strategy in the world, but without discipline, it will fail. Discipline means following your plan even when emotions are high. It means cutting losses quickly and letting profits run. It means not overtrading and not chasing every opportunity. Both ignorant traders and overconfident traders lack discipline. One trades randomly, the other trades aggressively. Successful traders sit in the middle. They respect the market, follow rules, and stay consistent. They understand that trading is not about excitement, it is about execution. Discipline turns average strategies into profitable ones, while lack of discipline destroys even the best systems.
5. HOW TO STAY IN THE SAFE ZONE BETWEEN EXTREMES
The key to surviving and thriving in the market is to avoid both extremes. You don’t want to be clueless, and you don’t want to be arrogant. Stay curious, keep learning, but never assume you know everything. Always respect risk. Use stop losses, manage position sizes, and stay humble. Accept that losses are part of the game. The goal is not to avoid losses completely but to control them. Keep a learning mindset. Review your trades, understand your mistakes, and improve continuously. The best traders are not the smartest ones, but the most consistent ones. They don’t chase perfection, they focus on progress. Staying in this balanced zone is what separates long term winners from those who eventually quit the market after repeated losses.
6. THE PSYCHOLOGY THAT DECIDES YOUR PROFITS
Trading is less about charts and more about psychology. Fear and greed drive most decisions. Beginners panic because of fear, while overconfident traders fall because of greed. Understanding your emotions is crucial. When you are in profit, greed pushes you to take unnecessary risks. When you are in loss, fear pushes you to exit early or avoid taking the next trade. Mastering this emotional cycle is the real game. The market tests your patience more than your intelligence. If you can stay calm during volatility and stick to your plan, you already have an advantage over most traders. The biggest battles in trading are not on the charts, they are in your mind. Control your emotions, and you control your outcomes.
7. BUILDING A LONG TERM WINNING MINDSET
Long term success in the stock market comes from thinking differently. Stop looking for shortcuts and quick profits. Focus on building a process. Create rules and follow them strictly. Track your performance and learn from both wins and losses. Understand that consistency beats occasional big profits. Avoid the noise of tips and hype. Develop your own understanding and trust your system. The market rewards patience and punishes impulsiveness. If you can stay grounded, avoid extremes, and keep improving, you will survive long enough to succeed. Remember, the goal is not to win every trade but to grow your capital steadily over time. That is what separates professionals from gamblers.
CONCLUSION THE BIGGEST RISK IS NOT THE MARKET IT IS YOU
The quote by Howard Marks highlights a powerful truth. Both ignorance and overconfidence lead to losses, just in different ways. The real danger is not the market, it is your mindset. If you can stay humble, disciplined, and consistent, you can avoid both traps. The market does not care about your opinions or your confidence. It only responds to your actions. Stay balanced, keep learning, and respect risk. That is how you stay in the game and eventually win.
#stockmarket #trading #investing #sharemarket #nifty #banknifty #tradingpsychology #discipline #riskmanagement #stockmarketindia #intradaytrading #swingtrading #longterminvesting #financialfreedom #money #wealth #traderlife #marketanalysis #technicalanalysis #chartpatterns #priceaction #stocktips #tradingmindset #successmindset #investingtips #marketlearning #profit #loss #tradingstrategy #stocks #equity #futuresandoptions #optionstrading #markettrends #bullmarket #bearmarket #tradingjourney #learntrading #indianstockmarket #wealthcreation #financialeducation #moneymanagement #tradingrules #marketdiscipline #tradingcommunity #stocktrader #investsmart #growmoney
3
5
243
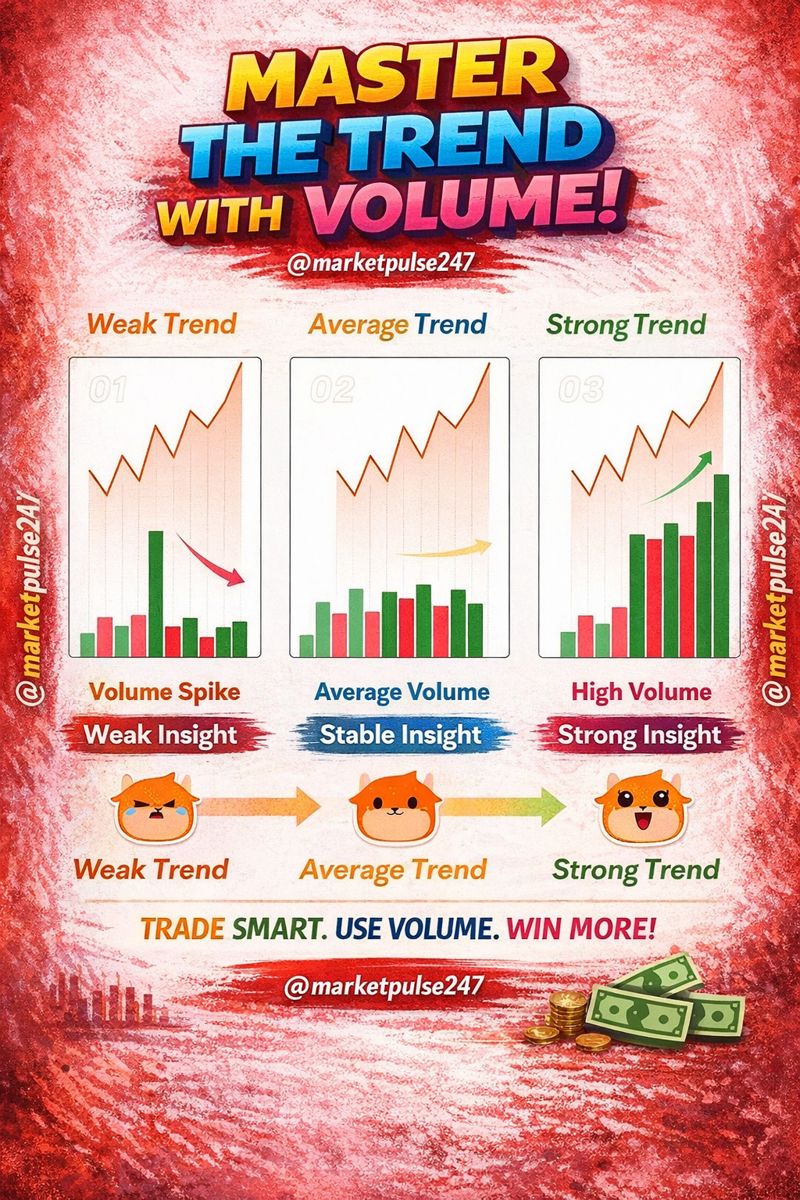
SECRET VOLUME HACKS THAT REVEAL THE REAL TREND STRENGTH
1. Why Volume Is the Truth Behind Every Price Move
Most traders focus only on price and ignore the most powerful confirmation tool which is volume. Price can move for many reasons but volume tells you whether that move has real strength behind it. When a stock rises with strong volume it means big players are involved and that move has a higher chance of continuing. On the other hand if price moves up with low volume it is often weak and can reverse quickly. Volume acts like the fuel of the market without fuel even a fast moving car cannot go far. Understanding this simple concept can completely change the way you trade because it helps you filter out false moves and focus only on high probability opportunities that are backed by real demand and participation.
2. The Hidden Meaning of Volume Spikes in Trends
A sudden spike in volume can look exciting but it does not always mean strength. Many beginners assume that any volume spike is a bullish sign but context matters. If a volume spike appears after a long uptrend it can actually signal exhaustion where smart money is exiting positions. This often leads to a weak trend or reversal. On the other hand if volume spikes at the beginning of a breakout it can confirm the start of a strong move. The key is to observe where the spike is happening within the trend. Early spikes often indicate strength while late spikes can indicate weakness. Learning to read this difference allows you to avoid traps and position yourself on the right side of the market with better confidence.
3. Average Volume Shows Stability but Not Power
When volume remains steady and average during a price move it usually indicates a balanced market. This type of trend is stable but not very powerful. It can continue for some time but lacks the momentum needed for explosive moves. Traders who understand this do not expect huge gains from such setups and instead manage expectations accordingly. Average volume trends are often safer but slower which makes them suitable for disciplined traders who prefer consistency over excitement. However relying only on average volume without looking for expansion can limit your profits. The real edge comes from identifying when average volume starts increasing because that shift often signals the beginning of a stronger trend.
4. High Volume Trends Are Where Big Money Is Made
Strong trends are always supported by high and increasing volume. This is where institutions and smart money actively participate and drive prices higher or lower with conviction. When you see price moving in one direction along with rising volume it is a clear sign of strength and continuation. These are the trades that offer the best risk reward opportunities because momentum is on your side. High volume confirms that the move is not random but supported by large capital. Traders who focus on these setups often achieve better results because they align themselves with the dominant force in the market. Instead of predicting direction they simply follow the evidence that volume provides.
5. Volume Divergence Can Warn You Before Reversals
One of the most powerful uses of volume is spotting divergence. This happens when price continues to move in one direction but volume starts decreasing. For example if a stock keeps rising but volume keeps dropping it shows that fewer participants are supporting the move. This is often an early warning sign that the trend is losing strength and may reverse soon. Similarly if price falls but volume decreases it can indicate selling pressure is weakening. Recognizing divergence helps you exit trades at the right time and avoid giving back profits. It also prepares you for potential reversals before they become obvious to everyone else in the market.
6. Breakouts Without Volume Are Dangerous Traps
Breakouts attract a lot of attention but not all breakouts are genuine. A breakout without strong volume is one of the most common traps in trading. It may look like the price is breaking resistance but without volume there is no real support for the move. Such breakouts often fail quickly and trap traders who enter late. On the other hand a breakout with strong volume shows real interest and increases the probability of continuation. Volume acts as confirmation that the breakout is backed by strong buying or selling pressure. Always wait for volume confirmation before entering breakout trades because it can save you from unnecessary losses and improve your accuracy significantly.
7. Combining Volume With Price Action Creates a Powerful Edge
Volume alone is useful but combining it with price action makes it even more powerful. When you analyze both together you get a complete picture of market behavior. For example a strong bullish candle with high volume indicates aggressive buying while a small candle with high volume can indicate indecision or distribution. Similarly low volume during pullbacks in an uptrend shows that selling pressure is weak which supports continuation. By reading these signals together you can make better decisions and improve timing. This approach allows you to trade with more confidence because you are not relying on a single factor but using multiple confirmations to validate your trades.
CONCLUSION: MASTER VOLUME AND YOU MASTER THE MARKET
Volume is not just an indicator it is a direct reflection of market participation and intent. When you learn to read volume correctly you gain insight into what big players are doing and where the market is likely to go next. It helps you avoid weak trends identify strong opportunities and exit before reversals. Most traders ignore volume and rely only on price which puts them at a disadvantage. By adding volume analysis to your strategy you create a powerful edge that improves both accuracy and confidence. Focus on quality setups backed by strong volume and stay disciplined in your approach. Over time this simple skill can transform your trading results and help you stay ahead of the crowd.
x.com/@marketpulse247
#volumeanalysis #stockmarket #tradingstrategy #priceaction #intradaytrading #swingtrading #tradingtips #marketanalysis #technicalanalysis #chartreading #tradingeducation #indianstockmarket #nifty50 #banknifty #stocktrader #daytrader #markettrends #volumetrading #smartmoney #breakouttrading #trendtrading #tradingpsychology #riskmanagement #tradingrules #stockanalysis #equitymarket #investingindia #tradingmindset #marketlearning #stocksindia #financialfreedom #wealthbuilding #tradingcommunity #marketinsights #tradingedge #consistency #tradinghabits #marketwisdom #fomo #stoploss #profitbooking #tradingjourney #learntrading #marketdiscipline #bullmarket #bearmarket #stocktips #momentumtrading #volumepriceanalysis
3
4
187

WHAT IS RISKOMETER ?|FIND YOUR RISK LEVEL| SIMPLE EXPLANATION | XTRA INCOME
| #MutualFunds | #Riskometer | #StockMarketIndia | #BEGINNERGUIDE | #MUTUALFUNDSINDIA | #MARKETLEARNING

WHAT IS RISKOMETER ?|FIND YOUR RISK LEVEL| SIMPLE EXPLANATION | XTRA INCOME
| #MutualFunds | #Riskometer | #StockMarketIndia | #BEGINNERGUIDE | #MUTUALFUNDSINDIA | #MARKETLEARNING | #SMARTINVESTING | #PersonalFinance | #SmartInvesting | #XtraIncome | @Yomik_Prajapati |
1
2
227

WHAT IS RISKOMETER ?|FIND YOUR RISK LEVEL| SIMPLE EXPLANATION | XTRA INCOME
| #MutualFunds | #Riskometer | #StockMarketIndia | #BEGINNERGUIDE | #MUTUALFUNDSINDIA | #MARKETLEARNING | #SMARTINVESTING | #PersonalFinance | #SmartInvesting | #XtraIncome | @Yomik_Prajapati |
2
288
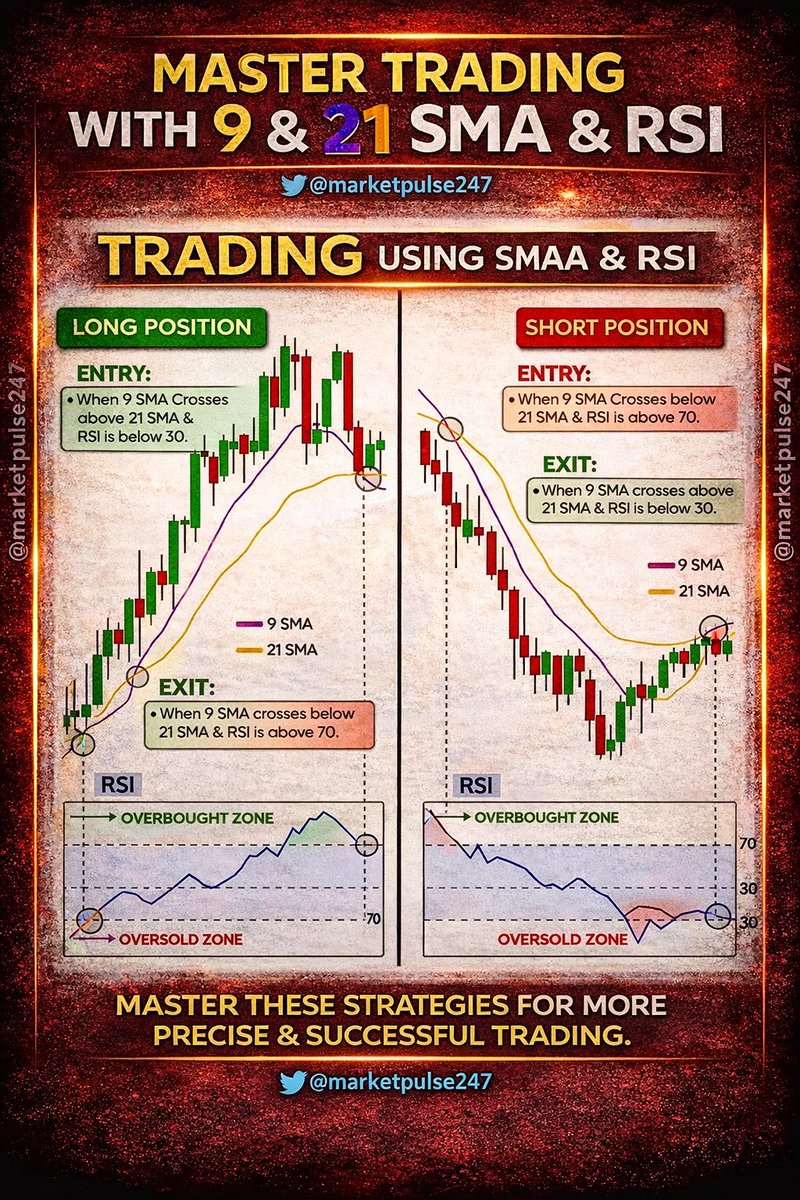
MASTER TRADING WITH 9 AND 21 SMA AND RSI STRATEGY
Trading becomes simple when you follow a structured system instead of random decisions. One of the most powerful and beginner friendly strategies is the combination of 9 SMA, 21 SMA, and RSI. This strategy helps you identify trend direction, entry timing, and exit points with clarity. Let us break it down step by step in a practical and easy to understand way.
1 The foundation of this strategy is moving averages. The 9 SMA represents short term price movement while the 21 SMA represents a slightly longer trend. When these two lines interact, they give strong signals about market direction. When the 9 SMA moves above the 21 SMA, it indicates bullish momentum. When it moves below, it signals bearish momentum.
2 For a long position, the ideal setup begins when the 9 SMA crosses above the 21 SMA. This crossover suggests that buyers are gaining control and the trend may move upward. However, entering blindly is not a smart move. You need confirmation.
3 This is where RSI plays a crucial role. RSI measures momentum and helps identify overbought and oversold conditions. For a strong long entry, RSI should be below 30 or just moving out of the oversold zone. This indicates that the stock was recently under pressure and is now ready for a bounce.
4 Once both conditions align, SMA crossover and RSI confirmation, the probability of a successful trade increases. This combination filters out weak signals and improves accuracy.
5 Exit strategy is equally important. For long trades, you should exit when the 9 SMA crosses below the 21 SMA or when RSI reaches above 70. This indicates that the market is becoming overbought and a reversal or correction may occur.
6 For short positions, the logic is reversed. When the 9 SMA crosses below the 21 SMA, it signals bearish momentum. This is your first indication that the trend may move downward.
7 RSI confirmation for short trades comes when it is above 70 or coming down from the overbought zone. This shows that the market was previously strong but is now losing strength, creating an opportunity to sell.
8 Entry in short trades should be taken only when both conditions align. This avoids false signals and keeps your trading disciplined.
9 Exit for short trades should be planned when the 9 SMA crosses above the 21 SMA or when RSI drops near 30. This indicates that selling pressure is reducing and a bounce may happen.
10 One of the biggest advantages of this strategy is its simplicity. You do not need complex indicators or confusing setups. Just two moving averages and one momentum indicator can give you clear direction.
11 Risk management is the key to survival. Always use a stop loss. For long trades, place it below the recent swing low. For short trades, place it above the recent swing high. This protects your capital and keeps losses small.
12 Patience is what separates successful traders from the rest. Many traders jump into trades without waiting for confirmation. This leads to losses. Waiting for the right setup may feel slow, but it improves your win rate significantly.
13 Market conditions also matter. This strategy works best in trending markets. In sideways markets, moving averages may give false signals. In such cases, it is better to avoid overtrading.
14 Practice is essential. The more charts you analyze, the better you will understand how SMA and RSI behave in different conditions. Over time, you will gain confidence and improve your timing.
15 Consistency is the final piece of the puzzle. Following the same rules again and again builds discipline. Trading is not about one big profit, it is about consistent small wins over time.
CONCLUSION
The combination of 9 SMA, 21 SMA, and RSI is a powerful yet simple trading strategy that can transform your approach to the market. It gives you clear entry and exit signals, helps you understand trend direction, and keeps your trading structured. When combined with patience, discipline, and proper risk management, this strategy can significantly improve your results. Master the process, trust the system, and you will trade with confidence instead of confusion.
#trading #stockmarket #technicalanalysis #movingaverages #sma #rsi #tradingstrategy #intradaytrading #swingtrading #stocktrading #priceaction #marketanalysis #tradingtips #learntrading #traderlife #marketstructure #trendtrading #breakouttrading #supportandresistance #tradingeducation #financialmarkets #stockmarketindia #nifty50 #banknifty #equitymarket #tradingcommunity #investing #wealthcreation #moneygrowth #marketinsights #tradingmindset #riskmanagement #chartanalysis #patterntrading #markettrends #tradingjourney #stockanalysis #tradingknowledge #technicaltrading #daytrading #scalping #marketpsychology #smarttrading #pricepatterns #marketlearning #tradingrules
3
4
204