
Picture this:
You’re at 80% of your account.
You decide to double the lot size.
Why?
Because you think you can recover faster.
Spoiler: it rarely ends well.
Stay disciplined with your position sizing.
#RiskManagement #PositionSizing #TradersTale
Risk Management Masterclass (Full Series) | Position Sizing, Stop Loss, R:R, Drawdown & Professional Risk System
#RiskManagement #Trading #StockMarket #PriceAction #PositionSizing #StopLoss #RiskReward #TradingEducation #BongTrader
2
26
Risk Management Masterclass (Part 5) | Professional Risk System — A System. Not Luck.
#RiskManagement #TradingEducation #CapitalProtection #TraderMindset #MoneyManagement #PositionSizing #RiskReward #TradingPsychology #StockMarket #TechnicalAnalysis

1
15

Jun 13
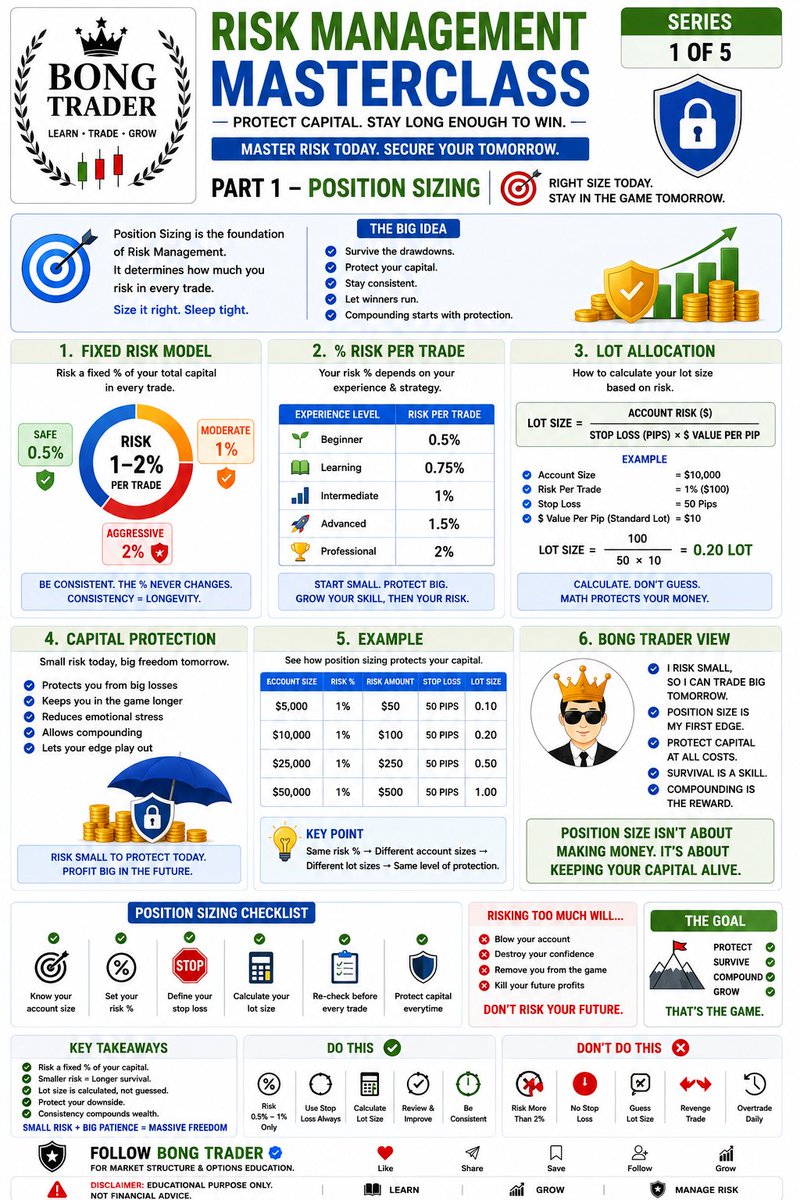
Risk Management Masterclass (Part 1) | Position Sizing — Protect Capital. Stay Long Enough to Win.
#BongTrader #RiskManagement #PositionSizing #TradingEducation #StockMarket #CapitalProtection #TradingPsychology #RiskReward #MoneyManagement #TraderMindset #TechnicalAnalysis
1
20

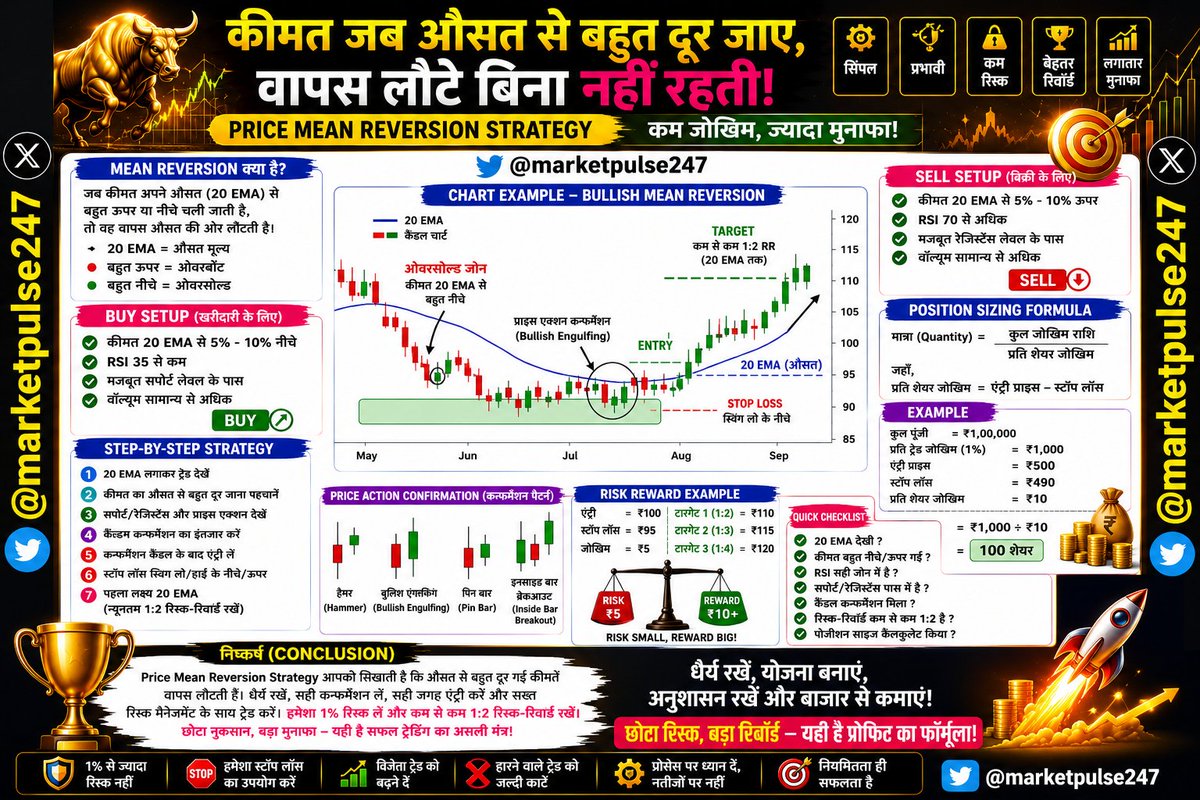
PRICE MEAN REVERSION STRATEGY: THE SIMPLE WAY TO BUY LOW, SELL HIGH AND CONTROL LOSSES
Most beginner traders lose money because they chase stocks after a big rally or panic-sell after a sharp decline. Professional traders often do the opposite. They understand a powerful concept called Mean Reversion. This strategy is based on the idea that prices tend to return to their average value after moving too far away from it.
Mean Reversion does not try to predict the future. Instead, it identifies situations where a stock has become temporarily overbought or oversold and is likely to move back toward its average price. When combined with proper risk management, it can become a highly effective daily trading strategy.
What is Mean Reversion?
Every stock has an average price, often represented by a moving average such as the 20 EMA or 50 EMA. When price moves too far above or below this average, it often pulls back toward the mean.
Think of a rubber band. The more you stretch it, the greater the chance it snaps back. Stock prices often behave in a similar way.
The Daily Trading Strategy
Step 1: Add a 20 EMA to Your Chart
The 20 EMA acts as the mean or average price.
Price far above 20 EMA = Potentially Overbought
Price far below 20 EMA = Potentially Oversold
Step 2: Look for Extreme Price Movement
For Buy Trades:
Stock falls 5% to 10% below the 20 EMA.
RSI below 35.
Strong support zone nearby.
For Sell Trades:
Stock rises 5% to 10% above the 20 EMA.
RSI above 70.
Major resistance zone nearby.
Step 3: Wait for Price Action Confirmation
Never enter blindly.
Look for:
Hammer Candle
Bullish Engulfing Candle
Strong Rejection Candle
Inside Bar Breakout
These patterns show that the reversal may have started.
Twitter id - x.com/@marketpulse247
Step 4: Entry
Enter after the confirmation candle closes.
Avoid trying to catch the exact bottom or top.
Step 5: Stop Loss
Place stop loss:
Below the recent swing low for buy trades.
Above the recent swing high for sell trades.
Always define risk before entering.
Twitter id - x.com/@marketpulse247
Step 6: Profit Target
Target the 20 EMA first.
If momentum remains strong, trail the stop loss and target higher levels.
Maintain a minimum 1:2 Risk-Reward Ratio.
Example:
Entry = ₹100
Stop Loss = ₹95
Risk = ₹5
Target = ₹110 or higher.
Position Sizing Formula
Risk management is the key to long-term survival.
Formula
Quantity = Total Risk Amount ÷ Risk Per Share
Where:
Risk Per Share = Entry Price – Stop Loss Price
Example
Trading Capital = ₹1,00,000
Risk Per Trade = 1%
Maximum Risk = ₹1,000
Entry = ₹500
Stop Loss = ₹490
Risk Per Share = ₹10
Quantity = ₹1,000 ÷ ₹10
Quantity = 100 Shares
This ensures that even if the trade fails, the loss remains controlled.
Twitter id - x.com/@marketpulse247
Why This Strategy Works
Most traders act emotionally. They buy after a stock has already moved significantly higher and sell after a large decline. Mean Reversion takes advantage of this emotional behavior.
By waiting for extreme moves away from the average price and entering only after confirmation, traders can often obtain better entries with smaller stop losses and larger potential rewards.
Twitter id - x.com/@marketpulse247
CONCLUSION
The Price Mean Reversion Strategy is one of the simplest and most logical trading approaches available. It teaches traders to avoid chasing momentum and instead focus on opportunities where price has moved too far from its average. By combining the 20 EMA, RSI, support and resistance, and strong price action confirmation, traders can identify high-probability setups with controlled risk. The real secret is not finding perfect trades but managing risk properly. Keep losses small, maintain a minimum 1:2 risk-reward ratio, and risk only 1% of your capital per trade. Over time, this disciplined approach can help you stay profitable while avoiding the large losses that destroy most trading accounts.
Twitter id - x.com/@marketpulse247
Chartink Scanner Formula (Mean Reversion Strategy)
Bullish Mean Reversion Scanner
close < ema(close,20) * 0.95
and rsi(14) < 35
and close > open
and volume > sma(volume,20)
Aggressive Oversold Reversal Scanner
close < ema(close,20) * 0.90
and rsi(14) < 30
and volume > sma(volume,20) * 1.5
Mean Reversion Bounce Scanner
close crossed above ema(close,20)
and rsi(14) > 40
and volume > sma(volume,20)
Twitter id - x.com/@marketpulse247
Twitter/X
#MeanReversion #MeanReversionTrading #PriceAction #TradingStrategy #StockMarket #Trading #StockTrading #IntradayTrading #SwingTrading #DayTrading #TechnicalAnalysis #ChartAnalysis #EMA20 #MovingAverage #RSI #RSITrading #SupportAndResistance #CandlestickPatterns #ReversalTrading #MomentumTrading #RiskManagement #RiskReward #PositionSizing #MoneyManagement #TradingPsychology #TradingDiscipline #TradingEducation #LearnTrading #BeginnerTrader #StockMarketLearning #MarketAnalysis #StockMarketIndia #IndianStockMarket #Nifty50 #BankNifty #TradeSmart #ProfitableTrading #TradingTips #SmartMoney #MarketPulse247 #FinancialFreedom #WealthCreation #CapitalPreservation #BullMarket #TraderLife #StockMarketTips #InvestmentTips #TradingSuccess
प्राइस मीन रिवर्ज़न रणनीति: कम नुकसान और बेहतर मुनाफे के लिए एक सरल ट्रेडिंग तरीका
अधिकांश नए ट्रेडर तब शेयर खरीदते हैं जब वह तेजी से ऊपर भाग चुका होता है और तब बेचते हैं जब उसमें बड़ी गिरावट आ चुकी होती है। यही कारण है कि वे अक्सर नुकसान उठाते हैं। सफल ट्रेडर एक अलग सिद्धांत का उपयोग करते हैं जिसे मीन रिवर्ज़न (Mean Reversion) कहा जाता है। इस सिद्धांत के अनुसार किसी भी शेयर की कीमत यदि अपने औसत मूल्य से बहुत अधिक ऊपर या नीचे चली जाए, तो समय के साथ वह दोबारा अपने औसत मूल्य के आसपास लौटने की कोशिश करती है।
मीन रिवर्ज़न रणनीति का उद्देश्य भविष्य की भविष्यवाणी करना नहीं है, बल्कि उन अवसरों को पहचानना है जहाँ कीमत अपने वास्तविक औसत से बहुत दूर चली गई हो और वापसी की संभावना अधिक हो।
मीन रिवर्ज़न क्या है?
हर शेयर का एक औसत मूल्य होता है जिसे हम आमतौर पर 20 EMA (Exponential Moving Average) या 50 EMA से मापते हैं।
यदि कीमत 20 EMA से बहुत ऊपर है, तो शेयर ओवरबॉट (Overbought) हो सकता है।
यदि कीमत 20 EMA से बहुत नीचे है, तो शेयर ओवरसोल्ड (Oversold) हो सकता है।
इसे एक रबर बैंड की तरह समझिए। जितना अधिक उसे खींचेंगे, उतनी ही संभावना होगी कि वह वापस अपनी सामान्य स्थिति में लौटेगा। शेयर बाजार में भी कीमतें अक्सर इसी प्रकार व्यवहार करती हैं।
दैनिक ट्रेडिंग के लिए मीन रिवर्ज़न रणनीति
चरण 1: चार्ट पर 20 EMA लगाएँ
20 EMA को औसत मूल्य माना जाएगा।
चरण 2: अत्यधिक मूल्य विचलन खोजें
खरीदारी (Buy) के लिए:
कीमत 20 EMA से 5% से 10% नीचे हो।
RSI 35 से कम हो।
पास में मजबूत सपोर्ट लेवल हो।
बिक्री (Sell) के लिए:
कीमत 20 EMA से 5% से 10% ऊपर हो।
RSI 70 से अधिक हो।
पास में मजबूत रेजिस्टेंस लेवल हो।
चरण 3: प्राइस एक्शन की पुष्टि करें
बिना पुष्टि के कभी ट्रेड न लें।
निम्नलिखित कैंडल पैटर्न देखें:
हैमर (Hammer)
बुलिश एंगल्फिंग (Bullish Engulfing)
मजबूत रिजेक्शन कैंडल
इनसाइड बार ब्रेकआउट
ये संकेत देते हैं कि रिवर्सल शुरू हो सकता है।
Twitter id - x.com/@marketpulse247
चरण 4: एंट्री लें
कन्फर्मेशन कैंडल के बंद होने के बाद ही ट्रेड में प्रवेश करें।
चरण 5: स्टॉप लॉस लगाएँ
खरीदारी में हाल के स्विंग लो के नीचे।
बिक्री में हाल के स्विंग हाई के ऊपर।
Twitter id - x.com/@marketpulse247
चरण 6: लक्ष्य निर्धारित करें
पहला लक्ष्य 20 EMA रखें।
हमेशा कम से कम 1:2 रिस्क-रिवॉर्ड अनुपात बनाए रखें।
Twitter id - x.com/@marketpulse247
उदाहरण:
एंट्री = ₹100
स्टॉप लॉस = ₹95
जोखिम = ₹5
लक्ष्य = ₹110 या उससे अधिक
पोजीशन साइजिंग फॉर्मूला
सफल ट्रेडिंग का सबसे महत्वपूर्ण हिस्सा जोखिम नियंत्रण है।
फॉर्मूला
मात्रा (Quantity) = कुल जोखिम राशि ÷ प्रति शेयर जोखिम
जहाँ,
प्रति शेयर जोखिम = एंट्री प्राइस – स्टॉप लॉस
उदाहरण
कुल पूंजी = ₹1,00,000
प्रति ट्रेड जोखिम = 1%
अधिकतम जोखिम = ₹1,000
एंट्री = ₹500
स्टॉप लॉस = ₹490
प्रति शेयर जोखिम = ₹10
मात्रा = ₹1,000 ÷ ₹10
मात्रा = 100 शेयर
इस प्रकार यदि ट्रेड गलत भी हो जाए तो अधिकतम नुकसान केवल ₹1,000 रहेगा।
यह रणनीति क्यों काम करती है?
अधिकांश ट्रेडर भावनाओं के आधार पर निर्णय लेते हैं। वे तेजी में खरीदते हैं और गिरावट में बेचते हैं। मीन रिवर्ज़न रणनीति इस मनोवैज्ञानिक गलती का लाभ उठाती है।
जब कीमत अपने औसत से बहुत दूर चली जाती है और फिर वापसी के संकेत देती है, तब कम जोखिम में बेहतर एंट्री मिलने की संभावना बढ़ जाती है। यही कारण है कि यह रणनीति लंबे समय तक प्रभावी साबित होती है।
Twitter id - x.com/@marketpulse247
निष्कर्ष
प्राइस मीन रिवर्ज़न रणनीति उन ट्रेडरों के लिए एक शानदार तरीका है जो कम जोखिम के साथ नियमित मुनाफा कमाना चाहते हैं। यह रणनीति आपको बाजार का पीछा करने के बजाय धैर्यपूर्वक सही अवसर का इंतजार करना सिखाती है। 20 EMA, RSI, सपोर्ट-रेजिस्टेंस और मजबूत प्राइस एक्शन को मिलाकर आप उच्च गुणवत्ता वाले ट्रेड खोज सकते हैं। याद रखें कि सफल ट्रेडिंग का रहस्य सही एंट्री से ज्यादा सही जोखिम प्रबंधन में छिपा होता है। हमेशा अपनी कुल पूंजी का केवल 1% जोखिम लें, न्यूनतम 1:2 रिस्क-रिवॉर्ड अनुपात रखें और बड़े नुकसान से बचें। यदि आप लगातार अनुशासन के साथ इस रणनीति का पालन करते हैं, तो लंबे समय में आपकी ट्रेडिंग स्थिर और लाभदायक बन सकती है।
2
10
328
Dow Theory Price Action Strategy with Money Management: A Simple Daily Trading System for Consistent Profits
Many traders lose money because they focus only on finding entries and ignore risk management. The truth is that profitable trading is not about predicting every market move. It is about following a structured strategy, controlling risk, and protecting capital. One of the most reliable methods for beginners is combining Dow Theory, Price Action, and Proper Money Management.
Dow Theory is the foundation of modern technical analysis. It helps traders identify the direction of the trend and avoid trading against the market. When combined with price action and strict money management, it becomes a powerful daily trading strategy.
Understanding Dow Theory
Dow Theory says that markets move in trends.
Uptrend
Higher Highs (HH)
Higher Lows (HL)
Downtrend
Lower Highs (LH)
Lower Lows (LL)
The first rule is simple:
Trade with the trend, never against it.
If a stock is making higher highs and higher lows, look only for buying opportunities. If it is making lower highs and lower lows, look only for selling opportunities.
The Daily Trading Strategy
Step 1: Identify the Trend
Open a 15-minute or 1-hour chart.
Look for:
Higher High Higher Low = Bullish Trend
Lower High Lower Low = Bearish Trend
Avoid sideways markets.
Step 2: Wait for Pullback
Never chase a stock after a strong move.
Wait for price to pull back toward:
Previous support zone
Previous resistance breakout level
Recent higher low
Patience improves entry quality.
Step 3: Look for Price Action Confirmation
Enter only after a confirmation candle appears.
Examples:
Bullish Engulfing Candle
Hammer Candle
Strong Breakout Candle
Inside Bar Breakout
These signals indicate buyers are returning.
Twitter id - x.com/@marketpulse247
Step 4: Entry
Enter after the confirmation candle closes.
This reduces false breakouts and emotional trading.
Step 5: Stop Loss Placement
Place stop loss:
Below recent swing low for buy trades
Above recent swing high for sell trades
Always define risk before entering.
Step 6: Target Setting
Use a minimum Risk-Reward Ratio of 1:2.
Example:
Entry = ₹500
Stop Loss = ₹490
Risk = ₹10
Target:
Minimum ₹520
For strong trends, aim for 1:3 or 1:4 risk reward.
Money Management and Position Sizing Formula
This is the secret that keeps professional traders alive.
Never risk more than 1% of your capital on a single trade.
Formula
Quantity = Total Risk Amount ÷ Risk Per Share
Where:
Risk Per Share = Entry Price − Stop Loss
Example
Trading Capital = ₹1,00,000
Risk Per Trade = 1%
Maximum Risk = ₹1,000
Entry Price = ₹500
Stop Loss = ₹490
Risk Per Share = ₹10
Quantity = ₹1,000 ÷ ₹10
Quantity = 100 Shares
This means your maximum loss remains ₹1,000 even if the trade fails.
Why This Strategy Works
Most traders buy because they feel a stock will go higher. Professionals buy because the trend, price action, and risk management align together.
Dow Theory keeps you trading with the trend.
Price Action helps identify the right entry.
Money Management protects your capital.
Risk-Reward ensures one winning trade can cover multiple small losses.
This combination creates consistency and removes emotional decision-making.
Twitter id - x.com/@marketpulse247
Conclusion
The Dow Theory Price Action Strategy is one of the simplest and most effective trading methods for beginners. Instead of predicting the market, you follow what the market is already showing. By identifying higher highs and higher lows, waiting for pullbacks, and entering only after confirmation, you improve the probability of success. Combine this with strict position sizing and a minimum 1:2 risk-reward ratio, and you create a trading system designed to survive losing streaks and grow steadily over time. Remember, successful trading is not about making money every day. It is about protecting capital, controlling risk, and allowing profitable trades to become larger than losing trades.
Twitter id - x.com/@marketpulse247
#DowTheory #PriceAction #PriceActionTrading #TradingStrategy #StockMarket #Trading #StockTrading #IntradayTrading #SwingTrading #DayTrading #TechnicalAnalysis #ChartAnalysis #TrendFollowing #HigherHighHigherLow #MarketStructure #SupportAndResistance #CandlestickPatterns #BreakoutTrading #RiskManagement #RiskReward #PositionSizing #MoneyManagement #TradingPsychology #TradingDiscipline #LearnTrading #TradingEducation #BeginnerTrader #StockMarketLearning #MarketAnalysis #StockMarketIndia #IndianStockMarket #Nifty50 #BankNifty #ProfitableTrading #TradingTips #TradeSmart #SmartMoney #MarketPulse247 #FinancialFreedom #WealthCreation #CapitalPreservation #BullMarket #TraderLife #StockMarketTips #InvestmentTips #Investing #TradingSuccess #FinancialEducation

4
9
293
Bollinger Bands Trading Strategy: A Simple Daily Trading Method with Proper Risk Management and Position Sizing
Many traders enter the stock market looking for the perfect indicator that can predict every move. However, successful trading is not about prediction; it is about identifying high-probability opportunities while keeping risk under control. One of the most beginner-friendly indicators for daily trading is Bollinger Bands. When used correctly, it can help traders find quality entries, set stop losses, and achieve favorable risk-reward ratios.
What are Bollinger Bands?
Bollinger Bands consist of three lines:
Upper Band
Middle Band (20-period Moving Average)
Lower Band
The bands expand when volatility increases and contract when volatility decreases. This helps traders identify potential buying and selling opportunities.
Simple Bollinger Bands Daily Trading Strategy
Step 1: Identify the Trend
First, determine the market direction.
Price above the Middle Band = Bullish Trend
Price below the Middle Band = Bearish Trend
Always trade in the direction of the trend.
Step 2: Wait for Pullback
In a bullish trend, wait for the stock to pull back toward the Middle Band.
Avoid buying when the price is touching the Upper Band because the stock may be temporarily overextended.
Step 3: Look for Price Action Confirmation
When price reaches the Middle Band:
Bullish Engulfing Candle
Hammer Candle
Strong Rejection Candle
These signals indicate buyers are stepping back into the market.
Step 4: Entry
Enter the trade after the confirmation candle closes above the Middle Band.
This improves the probability of a successful trade.
Step 5: Stop Loss Placement
Place your stop loss:
Below the recent swing low
Or below the Lower Bollinger Band
This keeps risk clearly defined before entering the trade.
Step 6: Profit Target
Aim for the Upper Bollinger Band as the first target.
Maintain at least a 1:2 Risk-Reward Ratio.
Example:
Entry = ₹500
Stop Loss = ₹490
Risk = ₹10
Target should be at least:
₹520 or higher
A 1:3 risk-reward setup is even better.
Position Sizing Formula
Professional traders never decide quantity randomly.
Formula
Quantity = Risk Amount Per Trade ÷ Risk Per Share
Where:
Risk Per Share = Entry Price − Stop Loss Price
Example
Trading Capital = ₹1,00,000
Maximum Risk Per Trade = 1%
Risk Amount = ₹1,000
Entry Price = ₹500
Stop Loss = ₹490
Risk Per Share = ₹10
Quantity = ₹1,000 ÷ ₹10
Quantity = 100 Shares
This ensures that even if the trade fails, the maximum loss remains limited to ₹1,000.
Why This Strategy Works
Bollinger Bands help traders identify areas where price is likely to pull back and resume the trend. Instead of chasing stocks after a sharp move, traders wait patiently for a retracement toward the Middle Band and then look for confirmation. This improves entries and reduces emotional decision-making.
The combination of trend-following, price action confirmation, position sizing, and proper risk management creates a trading framework that can be followed consistently. Remember, the goal is not to win every trade but to ensure winners are larger than losers.
Conclusion
The Bollinger Bands strategy is simple, effective, and suitable for beginners who want a structured trading approach. By trading in the direction of the trend, waiting for pullbacks, and using strict risk management, traders can significantly improve their consistency. Risk only 1% of capital per trade, maintain a minimum 1:2 risk-reward ratio, and allow profits to grow while keeping losses small. Over time, discipline and risk management will contribute far more to trading success than any indicator alone.
48 Hashtags for Twitter/X
#BollingerBands #BollingerBandStrategy #TradingStrategy #StockMarket #Trading #StockTrading #IntradayTrading #SwingTrading #DayTrading #TechnicalAnalysis #ChartAnalysis #PriceAction #RiskManagement #RiskReward #PositionSizing #TradingPsychology #TradingDiscipline #TradingEducation #LearnTrading #BeginnerTrader #StockMarketLearning #MarketAnalysis #StockMarketIndia #IndianStockMarket #Nifty50 #BankNifty #MomentumTrading #TrendFollowing #SupportAndResistance #CandlestickPatterns #ProfitableTrading #TradingTips #SmartMoney #MarketPulse247 #FinancialFreedom #WealthCreation #MoneyManagement #CapitalPreservation #BullMarket #TraderLife #TradeSmart #StockMarketTips #InvestmentTips #Investing #TradingSuccess #FinancialEducation #MarketInsights #WealthBuilding

3
8
234

Jun 12
If your heart rate jumps while in a trade, your position size is too big. Reduce risk until you can think clearly.
#PositionSizing #TradingPsychology #RiskManagement #SmartTrading
20
Position sizing isn’t just numbers.
It’s about controlling risk and emotion.
A good size keeps you in the game when the market tests you.
Master it, or the market will master you.
#PositionSizing #RiskManagement #ForexTraders
3

Jun 12
🚨 Why do traders blow accounts? It’s rarely the entry.
📊 Ian Coleman explains how position sizing, the 2% Rule and drawdown control can keep traders in the game, especially when trading prop firm accounts.
📉 A 50% loss requires a 100% gain just to recover. Survival comes first.
💬 What’s the largest drawdown you’ve recovered from?
#RiskManagement #PositionSizing #ForexTrading
1
2
14
2,058

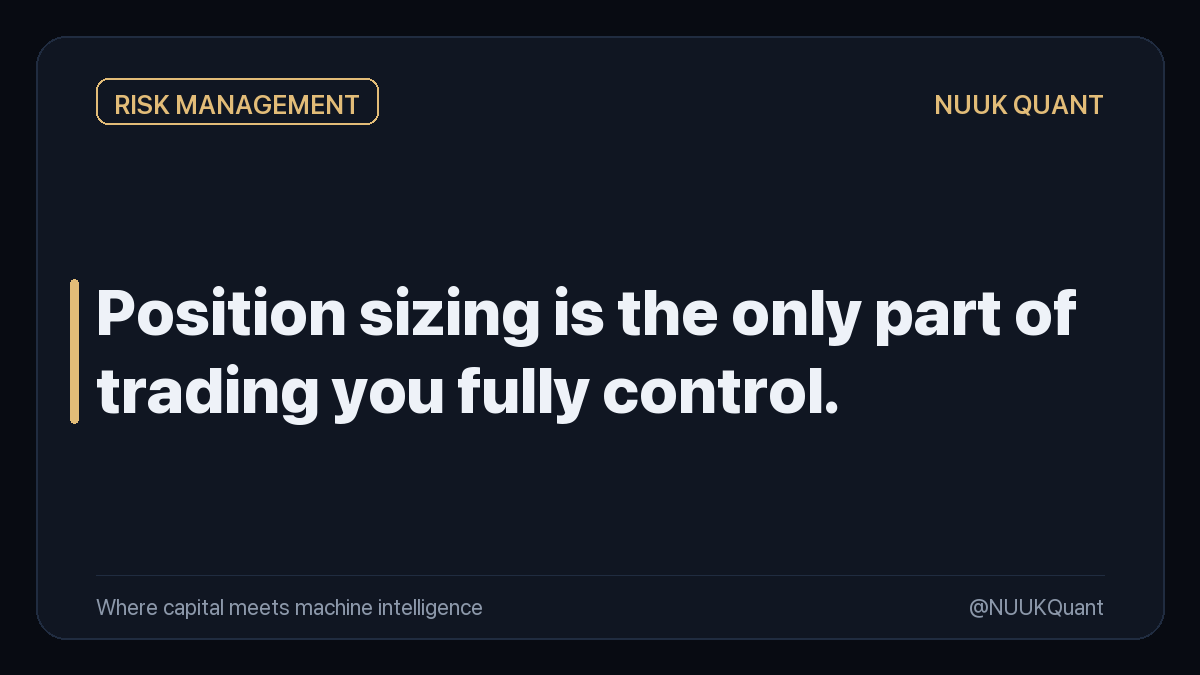
Position sizing is the only part of trading you fully control.
You don't control the market. You don't control the news. You barely control your entries — slippage and spreads see to that.
But the SIZE of your position? That's 100% yours. Nobody forces you to risk 10% on one idea.
Here's the math most people ignore: lose 50% and you need 100% just to get back to even. Survival isn't a defensive strategy — it's THE strategy. Size small enough to be wrong ten times in a row and still be in the game.
💡 Follow for a daily edge in markets, risk & AI in finance.
#positionsizing #riskmanagement #trading #investing
4
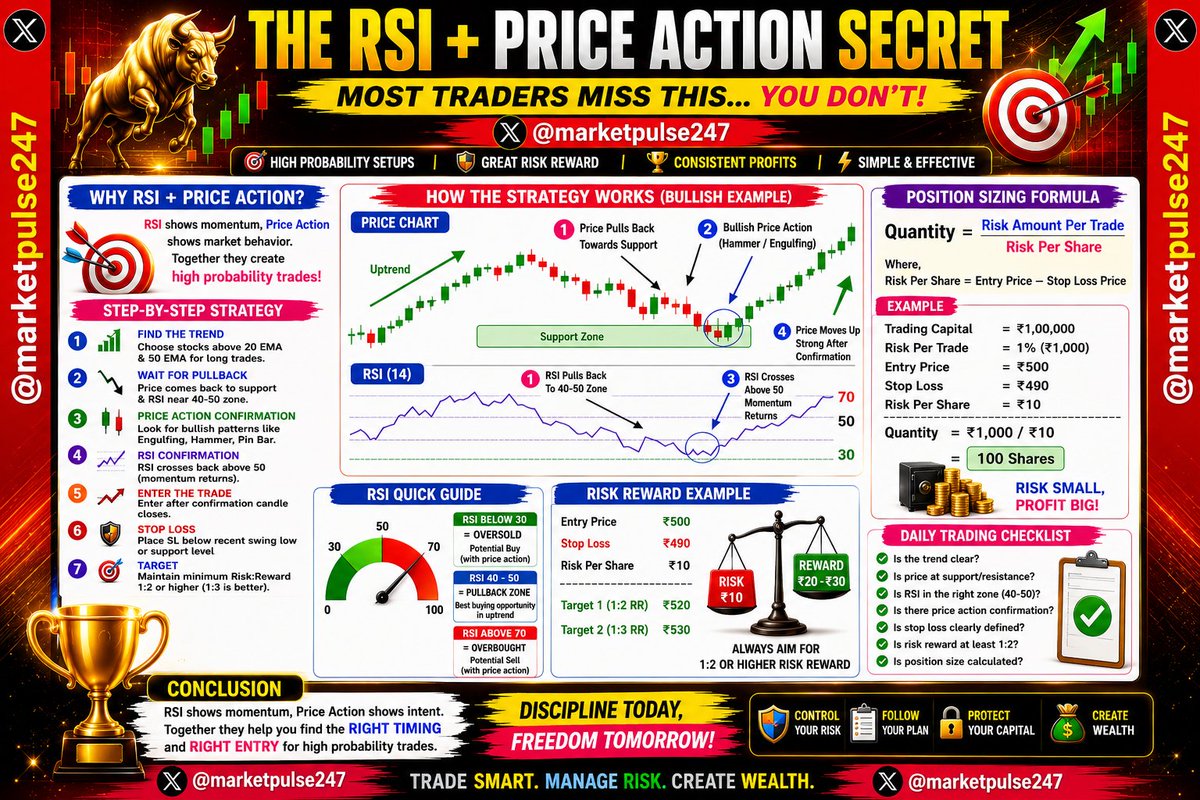
Simple RSI Strategy Can Double Your Risk-Reward Ratio
RSI Price Action Trading Strategy: A Simple Daily Trading Method for Beginners with Proper Risk Management and Position Sizing
Many beginners enter the stock market believing that finding the perfect indicator will make them profitable. The reality is different. Successful traders focus on three things: finding high-probability setups, controlling risk, and managing position size correctly. One of the simplest and most effective combinations for daily trading is using RSI (Relative Strength Index) together with Price Action.
This strategy helps traders identify strong entries, define stop losses, and achieve favorable risk-reward ratios without relying on dozens of indicators.
What is RSI?
RSI is a momentum indicator that measures the strength of price movement. It moves between 0 and 100.
RSI above 70 indicates strong buying momentum.
RSI below 30 indicates strong selling momentum.
RSI around 50 indicates a neutral market.
Many beginners buy simply because RSI crosses above 70 or sell because it falls below 30. This often leads to losses. The real power of RSI comes when it is combined with price action.
What is Price Action?
Price action means reading the movement of price directly from the chart without depending heavily on indicators.
Examples include:
Bullish engulfing candles
Pin bars
Breakouts
Support and resistance zones
Higher highs and higher lows
Price action tells us what buyers and sellers are doing in real time.
The RSI Price Action Daily Trading Strategy
Step 1: Find a Trending Stock
Choose stocks that are:
Above the 20 EMA and 50 EMA for bullish trades.
Below the 20 EMA and 50 EMA for bearish trades.
Avoid sideways markets because RSI gives many false signals there.
Step 2: Wait for a Pullback
In an uptrend, wait for the stock to pull back toward support.
As price pulls back:
RSI should move near 40–50.
Price should approach a previous support area.
This creates a potential buying opportunity.
Step 3: Look for Price Action Confirmation
Never enter based on RSI alone.
Wait for:
Bullish engulfing candle
Hammer candle
Strong rejection candle
Breakout above resistance
These patterns show buyers are returning.
Step 4: Confirm with RSI
For long trades:
RSI should move back above 50.
RSI should not be extremely overbought.
This confirms momentum is returning.
Step 5: Entry and Stop Loss
Enter after confirmation.
Place stop loss:
Below the recent swing low.
Below the support level.
This defines your risk before entering the trade.
Step 6: Target Setting
Always maintain a minimum risk-reward ratio of 1:2.
Example:
Entry Price = ₹500
Stop Loss = ₹490
Risk = ₹10
Target should be:
Minimum = ₹520
A 1:3 risk-reward setup is even better.
Position Sizing Formula
This is the most important part of trading.
Professional traders decide risk first and quantity second.
Formula
Quantity = Risk Amount Per Trade ÷ Risk Per Share
Where:
Risk Per Share = Entry Price − Stop Loss Price
Example
Trading Capital = ₹1,00,000
Maximum Risk Per Trade = 1%
Risk Amount = ₹1,000
Entry Price = ₹500
Stop Loss = ₹490
Risk Per Share = ₹10
Quantity = ₹1,000 ÷ ₹10
Quantity = 100 Shares
This means even if the trade fails, your maximum loss remains limited to ₹1,000.
Why This Strategy Works
Most traders lose because they chase stocks after a big move. This strategy forces you to wait for pullbacks and confirmation before entering. RSI helps identify momentum while price action confirms that buyers or sellers are actually taking control.
By combining both tools, you avoid many false signals that occur when using RSI alone. The strategy also ensures that every trade has a predefined stop loss and profit target, making decision-making easier and less emotional.
Twitter link - x.com/@marketpulse247
Daily Trading Checklist
Before taking any trade, ask yourself:
✔ Is the stock in a clear trend?
✔ Is RSI near the 40–50 zone during a pullback?
✔ Is there strong price action confirmation?
✔ Is stop loss clearly defined?
✔ Is risk-reward at least 1:2?
✔ Is position size calculated properly?
If all answers are yes, the trade is worth considering.
Conclusion
The RSI and Price Action strategy is one of the most beginner-friendly methods for daily trading because it combines momentum and market behavior into a simple decision-making process. RSI helps identify when momentum is strengthening, while price action reveals what buyers and sellers are doing at critical levels. Together, they provide a powerful framework for finding quality trades.
Twitter link - x.com/@marketpulse247
However, the real secret to long-term success is not the strategy itself but the discipline to follow it consistently. Risk only 1% of your capital on each trade, always use a stop loss, and never enter a trade without a minimum 1:2 risk-reward ratio. Even if you win only 40–50% of your trades, proper risk management can still make you profitable over time. Remember, successful trading is not about predicting every move of the market; it is about managing risk, protecting capital, and allowing winning trades to grow larger than losing trades. Over time, this approach can help transform a beginner into a disciplined and consistently profitable trader.
Twitter link - x.com/@marketpulse247
#RSI #RSITrading #RSIStrategy #RelativeStrengthIndex #PriceAction #PriceActionTrading #TradingStrategy #StockMarket #StockTrading #IntradayTrading #SwingTrading #DayTrading #TechnicalAnalysis #ChartAnalysis #CandlestickPatterns #SupportAndResistance #TrendFollowing #MomentumTrading #RiskManagement #RiskReward #PositionSizing #TradingPsychology #TradingDiscipline #TradingEducation #LearnTrading #BeginnerTrader #StockMarketLearning #MarketAnalysis #StockMarketIndia #IndianStockMarket #Nifty50 #BankNifty #TradeSmart #ProfitableTrading #TradingTips #SmartMoney #MarketPulse247 #FinancialFreedom #WealthCreation #Investing #InvestmentTips #MoneyManagement #CapitalPreservation #BullMarket #TradingSuccess #TraderLife #StockMarketTips #FinancialEducation
2
7
269

Being Right 60% of the Time Still Loses Money — Here's the Math
Win rate means nothing without position sizing discipline. A trader with 60% accuracy and inconsistent sizing underperforms a trader with 50% accuracy and tight risk control. Almost every time.
The variable most retail futures traders never optimize is not entry — it's exposure.
💎 Pre-trade calculator shows liquidation price and loss % before confirmation
💎 Max Position Guard caps order size to your account's defined risk threshold
💎 Leverage Heatmap shows total portfolio exposure across all open positions live
💎 AI Risk Flag triggers when new entries push session drawdown past preset limits
A 10% account risk per trade isn't aggressive — it's terminal, compounded over a month.
Size it right on Aivora.
aivora.com
#Aivora #Futures #PositionSizing #RiskManagement #CryptoFutures #Trading101 #AITrading
44
1
43
1,529

Jun 12
Mini Lesson: Risk Is What You Lose, Not What You Hope to Make
Most traders focus on profit targets before they define their risk.
Professionals do the opposite.
Before entering any trade, know exactly where you are wrong and how much you are willing to lose if that happens.
What matters:
Defined risk. Position sizing. Risk-to-reward ratio. Consistency over a large sample of trades.
What does not matter:
The size of one winner. Social media predictions. Being right on every trade.
A trader who protects capital can always find another opportunity.
A trader who over-risks may not get a second chance.
Protect capital first. Grow it second.
traderaedge.com
#TraderaEdge #RiskManagement #Trading #Bitcoin #Crypto #MarketStructure #PositionSizing #TradingPsychology #TradeWithEdge
6
303
The Beginner’s Fibonacci Trading Strategy: A Simple Daily Trading Method with Proper Risk Management
Most beginners enter the stock market looking for profits, but very few focus on risk management. Professional traders understand one important truth: protecting capital is more important than making money. If you can control losses, profits will eventually follow.
One of the easiest and most effective tools for beginners is the Fibonacci Retracement Strategy. It helps traders identify high-probability entry points, define stop losses, and achieve attractive risk-reward ratios.
What is Fibonacci Retracement?
Fibonacci retracement is a technical analysis tool based on mathematical ratios. The most important levels used by traders are:
23.6%
38.2%
50%
61.8%
78.6%
Among these, the 50% and 61.8% levels are the most commonly used for finding trade entries.
The basic idea is simple:
When a stock makes a strong move upward, it rarely continues straight up. It usually pulls back before continuing its trend. Fibonacci levels help us estimate where that pullback may end.
The Simple Fibonacci Daily Trading Strategy
Step 1: Identify a Strong Trend
Look for stocks that are:
Trading above the 20 EMA and 50 EMA
Making higher highs and higher lows
Showing strong bullish momentum
Avoid sideways or choppy stocks.
Step 2: Draw Fibonacci Retracement
In an uptrend:
Select the recent swing low.
Drag the Fibonacci tool to the recent swing high.
The retracement levels will automatically appear.
x.com/@marketpulse247
Step 3: Wait for Pullback
Never chase a stock after a big rally.
Wait patiently for the stock to retrace toward:
50% level
61.8% level
These zones often act as support.
Step 4: Confirmation Entry
Enter only when you see:
Bullish candle formation
Strong buying volume
Price rejection from Fibonacci support
Step 5: Stop Loss Placement
Place stop loss:
Below the 61.8% level
Or below the recent swing low
This keeps your risk clearly defined.
x.com/@marketpulse247
Step 6: Target Setting
Use a minimum Risk Reward Ratio of 1:2.
Example:
Entry = ₹100
Stop Loss = ₹95
Risk = ₹5
Target should be:
Minimum = ₹110
A 1:3 reward ratio is even better.
Position Sizing Formula for Perfect Quantity
This is where most beginners fail.
Never decide quantity based on emotions.
Use this formula:
Position Size Formula
Quantity = Total Risk Per Trade ÷ Risk Per Share
Where:
Risk Per Share = Entry Price – Stop Loss Price
Example
Trading Capital = ₹1,00,000
Maximum Risk Per Trade = 1%
Risk Amount = ₹1,000
Entry Price = ₹500
Stop Loss = ₹490
Risk Per Share = ₹10
Quantity = ₹1,000 ÷ ₹10
Quantity = 100 Shares
Therefore:
Buy only 100 shares.
Maximum loss remains ₹1,000.
x.com/@marketpulse247
Capital remains protected.
This method allows you to survive losing streaks and stay in the game for years.
Why Risk Reward Matters More Than Win Rate
Many beginners think they need a 90% accuracy rate.
That is completely wrong.
Suppose:
10 Trades
5 Winners
5 Losers
With 1:1 Risk Reward:
Profit = ₹5,000
Loss = ₹5,000
Net Result = Zero
With 1:3 Risk Reward:
Profit = ₹15,000
Loss = ₹5,000
Net Profit = ₹10,000
This is why professional traders focus on risk reward first and accuracy second.
Daily Trading Checklist
Before entering any trade, ask:
✔ Is the stock in a clear trend?
✔ Has it retraced to 50% or 61.8% Fibonacci?
✔ Is there bullish price action confirmation?
✔ Is stop loss clearly defined?
✔ Is Risk Reward at least 1:2?
✔ Is position size calculated correctly?
If all answers are "Yes," the trade is worth considering.
x.com/@marketpulse247
Conclusion
The Fibonacci Retracement Strategy is one of the simplest ways for beginners to trade with discipline. Instead of buying randomly, it gives a structured framework for identifying entries, stop losses, and profit targets. However, Fibonacci levels alone do not guarantee success. The real edge comes from combining Fibonacci with proper trend analysis, strict stop losses, and disciplined position sizing.
Remember, successful trading is not about finding a magical indicator. It is about consistently following a process. Risk only 1% of your capital on each trade, maintain a minimum 1:2 risk-reward ratio, and wait patiently for high-quality setups near the 50% and 61.8% Fibonacci levels. If you focus on capital preservation first and profits second, you will develop the habits that separate long-term winners from the majority of traders who fail. Over time, discipline, patience, and risk management will become your biggest advantages in the stock market.
x.com/@marketpulse247
#StockMarket #Trading #Trader #TradingStrategy #StockTrading #IntradayTrading #SwingTrading #PriceAction #TechnicalAnalysis #ChartAnalysis #StockMarketIndia #IndianStockMarket #Nifty50 #BankNifty #Fibonacci #FibonacciTrading #FibonacciRetracement #RiskManagement #RiskReward #PositionSizing #TradingPsychology #MarketAnalysis #TradingEducation #LearnTrading #BeginnerTrader #StockMarketLearning #Investing #InvestmentTips #FinancialFreedom #WealthCreation #MoneyManagement #CapitalPreservation #ProfitableTrading #TradingTips #MarketPulse247 #BullMarket #TradingCommunity #DayTrader #MomentumTrading #SupportAndResistance #CandlestickPatterns #TrendFollowing #SmartMoney #StockMarketTips #TradeSmart #TradingSuccess #DisciplineEqualsProfit #FinancialEducation

1
3
7
322

Position sizing matters more than entries, but nobody wants to hear it.
This episode breaks down why traders spend too much time chasing perfect entries, while ignoring the one thing that often decides whether they survive long enough to improve: position size.
Listen to the Podcast - youtube.com/watch?v=FdD7rqtn…
Breaking News to Trading Moves
#StockMarket #Trading #Investing #DayTrading #SwingTrading #TradingPsychology #RiskManagement #PositionSizing #TraderMindset #TradingDiscipline #RetailTrading #StockTrading #MarketPsychology #TradingRules
11

Jun 11
🔥 Your Position Size Is Exposing You
One loss changing your next trade?
Too big. Simple.
No more hesitation.
No more revenge sizing.
No more emotional rollercoaster.
Size for neutrality:
Take loss → Accept → Reset → Execute.
Pros don’t chase max profit.
They chase consistency and peace of mind.
Prove discipline at current size → Then scale.
Market rewards clear thinkers.
#BourseAcademy #TradingPsychology #PositionSizing #TradeSmart #DisciplineOverEmotion #RiskManagement
2
68

Jun 11
I've been building trading systems for 8 years, and I've seen the same pattern destroy countless algo traders: they spend months perfecting entry signals but 10 minutes on risk management.
Last month, a trader showed me their "bulletproof" system with 300% backtested returns. Beautiful EMA crossovers, perfect VWAP entries. Then I asked about position sizing. "Oh, I just use 10% per trade." That's not a trading system—that's a slow-motion account explosion.
The uncomfortable truth: your edge isn't in finding the perfect signal. It's in surviving long enough for your edge to compound. Maximum drawdown limits, proper position sizing, and dynamic stop losses aren't features you add later—they're the foundation everything else builds on.
At AutomaticTrades, we learned this the hard way and baked proper risk management into every signal we generate: automatic-trades.com
What's the biggest risk management mistake you've seen in algo trading? #RiskManagement #AlgoTrading #TradingPsychology #PositionSizing #TradingRules
29
Position sizing is your silent partner in trading.
Get it right, and you can weather any storm.
Want to master this crucial skill?
Join the 50 founding spots for our risk-governance tool at just £29.99/mo.
Take t…
#PositionSizing #TradingTools #RiskManagement #FundedTrader
4

A great strategy won't save you if your position sizing is broken.
Risk 10% per trade.
Three losses.
$10,000 becomes $7,290.
You now need a 37% gain to recover.
Risk 2%? The same three losses cost $588.
The rule is simple: 1-2% per trade, no exceptions.
💡 Save this before your next trade.
🌐 Trading with structure since 1988. Open your trading account using the link in the bio.
Risk Disclaimer: Trading is risky and may lead to capital loss.
#WindsorBrokers #PositionSizing #TradingEducation #RiskManagement
13