
Mar 18
Balaji Amines Ltd
STRONG BULLISH DIVERGENCE IN BALAJI AMINES!
A very good risk-to-reward trade! (must use stop loss)
#Balajiamines
#nse #bse #nifty
#chemicalsector
#bullishdivergence
#specialitychemicals
#bullishstocks #reversalpattern

1
1
362

The FVG Pattern That Quietly Forms Near Market Tops
📲youtu.be/4blKMrBrjHs
Most traders use Fair Value Gaps to chase continuation.
Very few study what happens when they appear at extremes.
And that difference matters.
Here’s the shift:
An FVG is a 3-candle imbalance.
Candle 2 shows aggression.
Candle 1 and 3 leave a gap.
In trends, that often signals strength.
But at extended highs?
It can signal distribution.
After a strong rally…
Near resistance…
At fresh highs…
A bearish FVG forms.
Large aggressive candle.
Imbalance created.
Retail sees momentum.
Institutions may be exiting.
Here’s what to watch:
Price rallies hard →
Bearish FVG appears →
Price pulls back to fill the gap →
Gap acts as resistance →
Rejection confirms weakness.
That is often where late buyers get trapped.
The edge is not the pattern alone.
It’s the location.
FVG at support ≠ FVG at highs.
Context changes meaning.
If you study past Nifty and Bank Nifty tops,
you’ll notice imbalance candles near exhaustion phases.
Not magic.
Not prediction.
Just reading aggression differently.
Entry logic (if structure confirms): • Bearish FVG at extended highs
• Weak pullback into gap
• Rejection with structure break
• Defined stop above imbalance
This works across indices, stocks, forex, crypto —
but only when combined with trend context.
Save this.
Next time price rallies aggressively into resistance,
watch the 3-candle imbalance carefully.
Sometimes continuation…
Sometimes exit liquidity.
Understanding the difference is the real edge.
#FairValueGap #FVG #MarketStructure #SmartMoneyConcepts #PriceActionTrading #NiftyTrading #BankNifty #ReversalPattern #TradingEducation #TechnicalAnalysis #InstitutionalFlow #ChartAnalysis #TradingEdge
2
13
1,364

25 Nov 2025
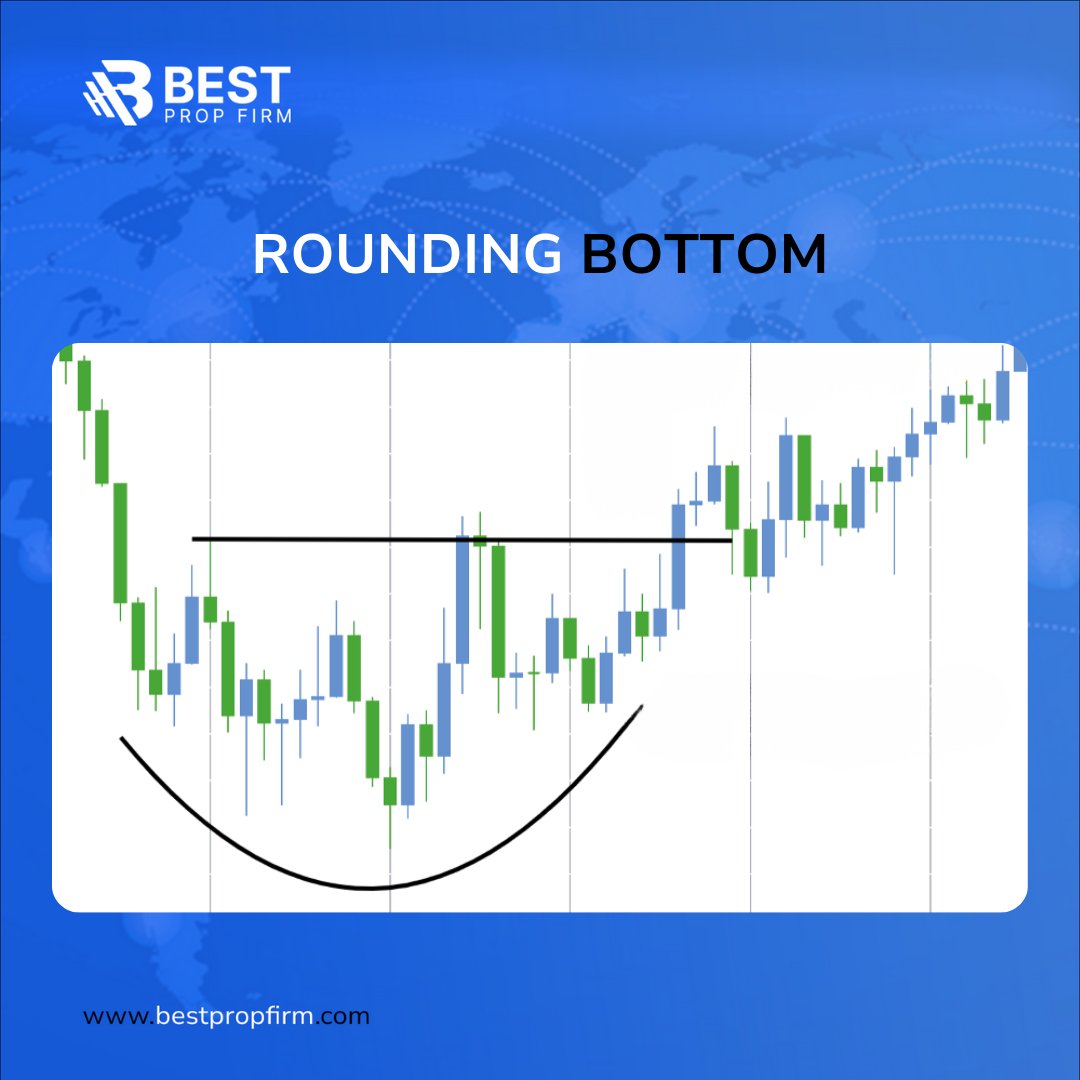
🚩 Rounding Bottom Alert!
A curve from weakness to strength - signaling momentum for a potential breakout up. 📈
Spot the base, time the reversal, ride the shift.
#RoundingBottom #ReversalPattern #PriceAction #SmartTrading
11
68

17 Nov 2025
📌 #NSDL | STRONG REVERSAL FROM OVERSOLD ZONE 🔄📈
NSDL has bounced sharply from the 78.6% Fibonacci retracement, signalling that buyers are finally stepping in after a long corrective phase.
💥 Today’s bullish candle above the Entry EMA (₹1137) adds strength.
💗 But rejection near the Fast EMA (₹1182) shows supply pressure still active.
🔍 Technical Highlights
🔵 78.6% Fib = strong demand zone
📈 Sustaining above ₹1140–₹1160 is key for further upside
🔴 Resistance: ₹1180 → ₹1235 (50% Fib zone)
🟢 Breakout above ₹1235 = trend reversal confirmation
📊 Fundamental View
🏦 India’s only listed depository play
📈 Beneficiary of rising demat accounts & market participation
🧩 Monopoly-like business with stable annuity revenues
💼 Long-term story intact despite short-term volatility
🧭 Verdict
NSDL is showing early reversal signs 🔄 but still needs a clean breakout above EMAs to start trending again.
📌 Accumulation on dips preferred for long-term investors.
⚠️ DISCLAIMER
This is a Techno-Funda analysis for educational purposes only.
❌ Not a buy/sell recommendation.
Please consult your financial advisor before investing.
#NSDL #TechnoFunda #StockMarketIndia #Fibonacci #PriceAction #TechnicalAnalysis #Investing #StockMarket #LongTermInvesting #MarketAnalysis #SwingTrading #BreakoutStocks #NSEStocks #BSEStocks #IndiaInvesting #WealthCreation #AccumulationZone #ReversalPattern #FinanceTwitter #TradingView

3
828


$APLD, $BULL, $KULR: Bullish Patterns Brewing Before Powell Speaks: Take a look at my recent youtube upload and lets get down to the technicals:
youtu.be/M682Z_6bXOQ?si=zZFN…
#APLD #KULR #BULLStock #TechnicalAnalysis $bull #webull #StockMarketToday #BullishSetup #PowellSpeech #ReversalPattern #TradingCommunity #SammyPlays #tariff #bearish #bullish
2
739

30 Jul 2025
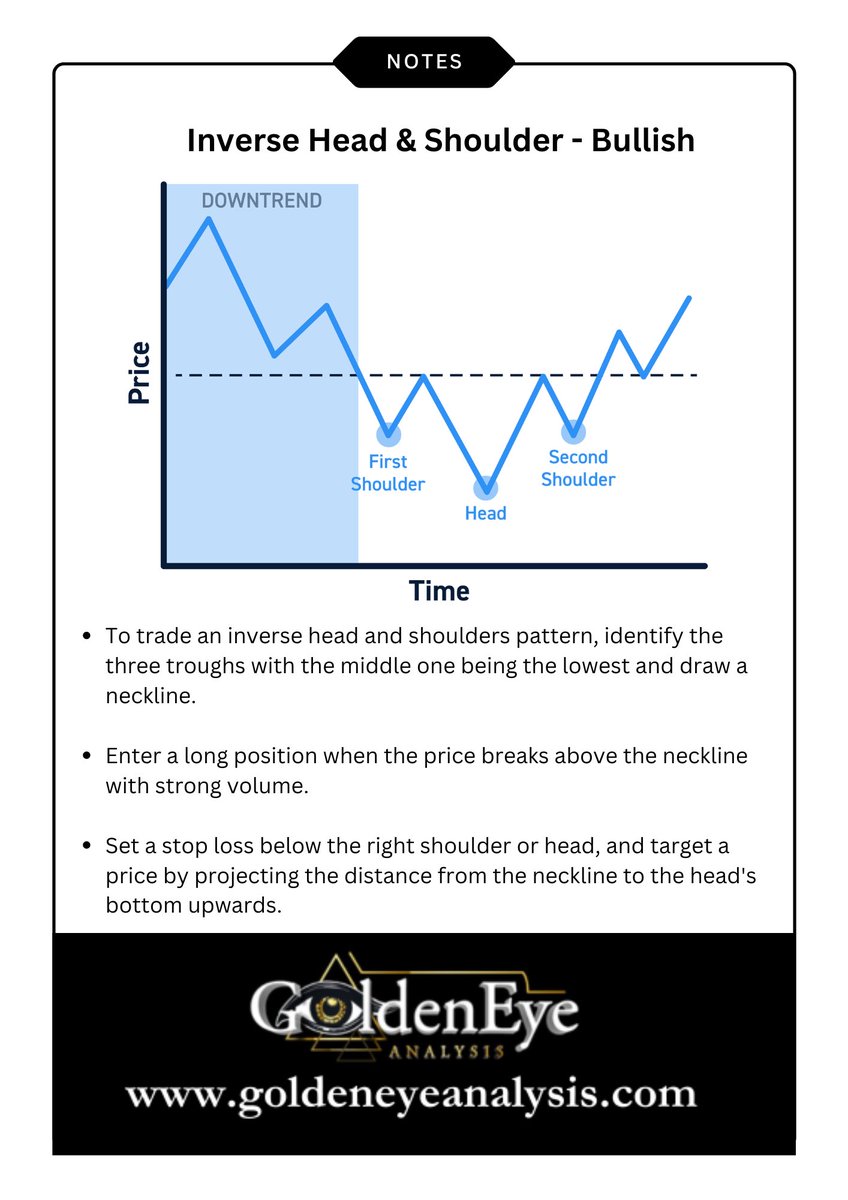
𝐆𝐨𝐥𝐝𝐞𝐧👁️ - 𝐈𝐧𝐯𝐞𝐫𝐬𝐞 𝐇𝐞𝐚𝐝 & 𝐒𝐡𝐨𝐮𝐥𝐝𝐞𝐫𝐬
The Inverse Head & Shoulders is a high-probability bullish reversal pattern that forms after a downtrend. It signals a shift in control from bears to bulls.
🔍 How to Spot It:
• 3 troughs: left shoulder, deeper head, and right shoulder
• Neckline = resistance across the swing highs between troughs
📊 Trading Plan Rules:
1.Entry: On breakout above neckline with volume confirmation
2.Stop Loss: Just below the right shoulder or the head
3.Target: Project neckline to head low distance upward
📌 Pro Insights:
• Best performance when right shoulder forms higher than left
• Success rate: ~83% when neckline breaks with volume (Bulkowski)
• Larger patterns (longer timeframes) often yield stronger breakouts
• Failure rate increases if neckline is sloped downward
• Volume should decline on the left side and rise sharply on breakout
Use this pattern to spot trend reversals early and plan trades with favorable risk/reward.
👉 Save & share with traders | Learn more at goldeneyeanalysis.com
#Trading #TechnicalAnalysis #ChartPatterns #ReversalPattern #GoldenEyeAnalysis
#GOLD #SILVER #COPPER #BITCOIN #CL #PALLADIUM #URANIUM #DXY #platinum $GLD $XAUUSD $GC $GDX $DXY $URA $WTI $SLV $COPX $BTC $PAAS $AG $NEM $URNM $URNJ $FCX $PALL $NVDA $TSLA $AAPL #XAUUSD $DXY $SILJ $SILV $GDXJ $BTC $PALL
3
3
664

29 Jul 2025
$YGG is setting up for an explosive move on the daily timeframe, forming a powerful bullish reversal pattern! 📷
The chart reveals a clear Inverse Head & Shoulders or Cup & Handle pattern, with $YGG currently consolidating near its $0.40 - $0.42 Neckline Resistance. A decisive breakout above this critical level would confirm massive demand, opening the path for a strong rally towards $0.48 - $0.50 ! Building on solid foundations for a new price discovery. 📷 #YGG #YieldGuildGames #Crypto #ReversalPattern #BreakoutWatch #Bullish

18
2
16
3,372

28 Jul 2025
⚡️Head & Shoulders Pattern
👤 Head & Shoulders - The king of reversal patterns!
Components:
🔹Left shoulder
🔹Head (higher peak)
🔹Right shoulder
🔹Neckline
Bearish when price breaks neckline. Target = Head to neckline distance projected down.
#HeadShoulders #ReversalPattern #ChartPatterns
2
78
27 Jul 2025
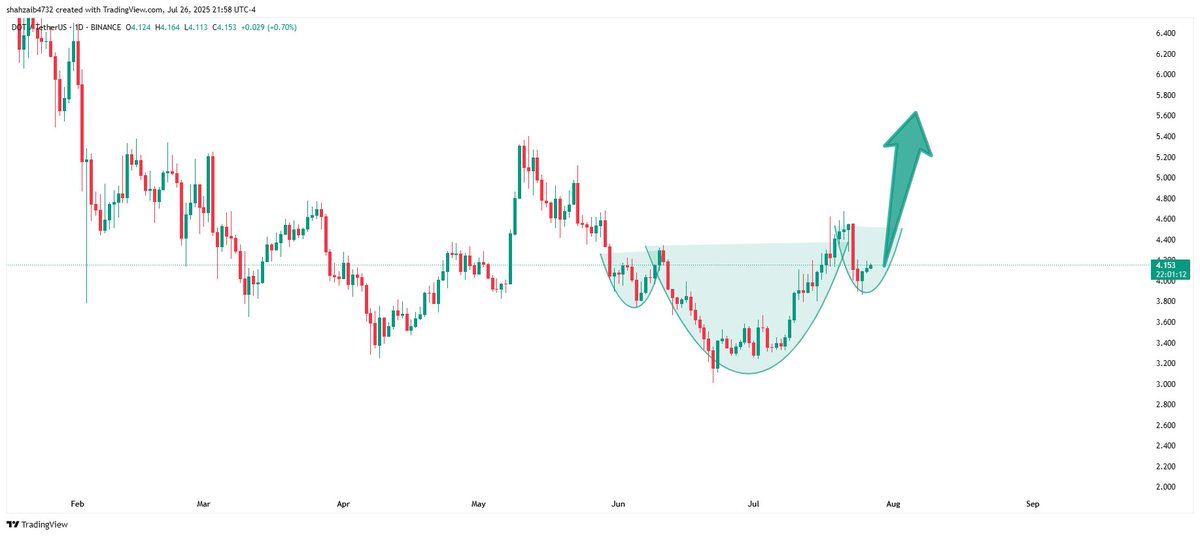
$DOT is setting up for an explosive move, forming a powerful bullish reversal pattern! 📷
The chart reveals a clear Inverse Head & Shoulders or Cup & Handle pattern, with $DOT currently consolidating near its $6.50 - $6.80 Neckline Resistance. A decisive breakout above this critical level would confirm massive demand, opening the path for a strong rally towards $8.00 - $8.50 ! Building on solid foundations for a new price discovery. 📷 #DOT #Polkadot #Crypto #ReversalPattern #BreakoutWatch #Bullish
4
2
14
6,839

27 Jul 2025
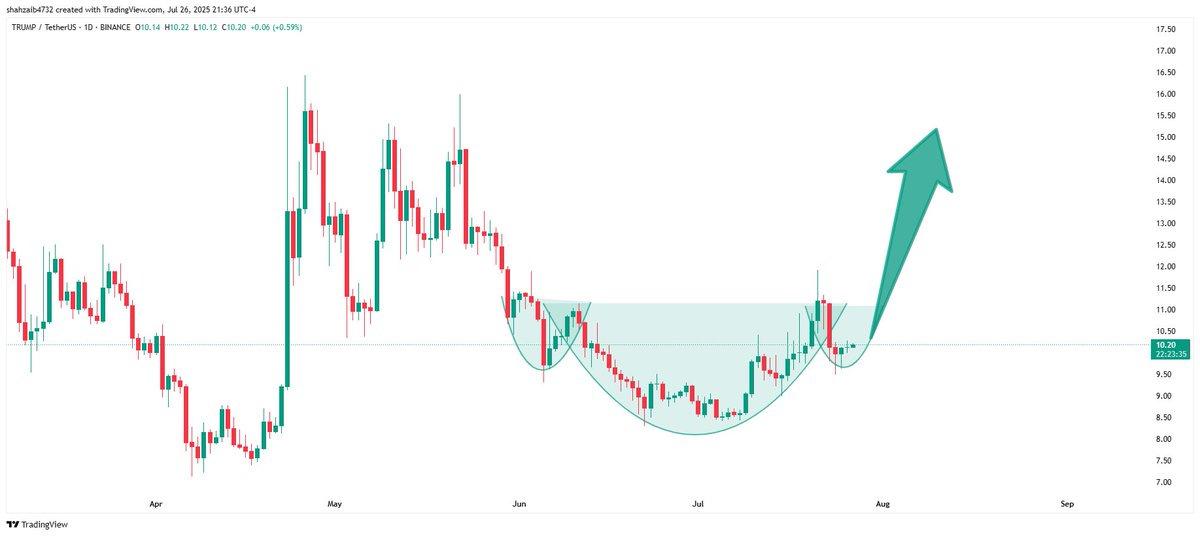
$TRUMP is setting up for an explosive move, forming a powerful bullish reversal pattern! 📷
The chart reveals a clear Inverse Head & Shoulders or Cup & Handle pattern, with $TRUMP currently consolidating near its $15.00 - $15.50 Neckline Resistance. A decisive breakout above this critical level would confirm massive demand, opening the path for a strong rally towards $25.00 - $28.00 ! Building on solid foundations for a new price discovery. 📷 #TRUMP #MemeCoin #Crypto #ReversalPattern #BreakoutWatch #Bullish
27
15
85
16,097

26 Jul 2025
$REX is on the verge of a significant breakout, forming a powerful reversal pattern! 📷📷
After a period of consolidation, $REX is challenging the upper trendline of what appears to be a bullish triangle or wedge. A decisive move above this resistance would confirm strong demand, potentially igniting a rally towards $0.045 - $0.050 ! Building on solid foundations for a major uptrend. 📷 #REX #Crypto #BreakoutWatch #ReversalPattern #Bullish

3
15
414
24 Jul 2025
$TIBBIR is forming a compelling Inverse Head & Shoulders pattern, indicating a bullish reversal! 🚀
$TIBBIR is completing this powerful reversal pattern, with a clear neckline resistance around $0.0000000085. A confirmed break above this neckline could lead to substantial upside targets. The stage is set for a significant move. ✨
#TIBBIR #MemeCoin #Crypto #ReversalPattern
26
9
48
9,789
24 Jul 2025
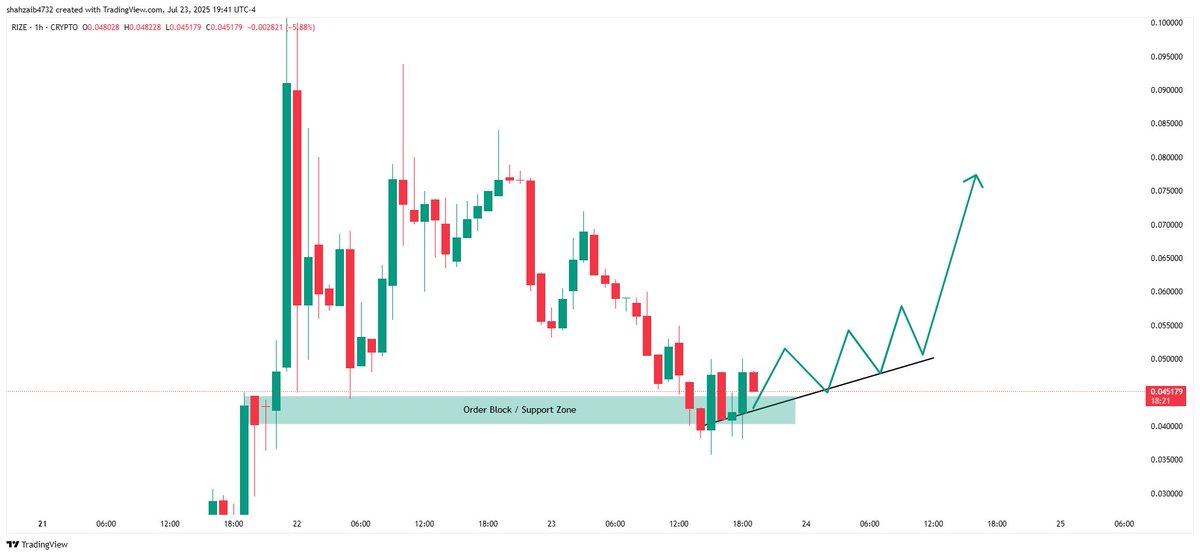
$RIZE is skillfully forming an Inverse Head & Shoulders pattern, signaling a powerful bullish reversal! 🚀
$RIZE is completing this classic reversal pattern, with a clear neckline resistance around $0.00000000008. A confirmed break above this neckline could lead to substantial upside targets. Get ready to witness a significant rise! ✨
#RIZE #MemeCoin #Crypto #ReversalPattern
21
2
12
3,213

24 Jul 2025
$GAS Gearing Up for an Explosive Breakout! ⛽🚀
A massive 'Rounding Bottom' formation is signaling a major reversal, with price recently breaking its long-term downtrend line. ✨
It's now consolidating and challenging the $3.50 - $3.60 neckline resistance. A decisive break and hold here is the key! 🔑
If confirmed, $GAS could ignite for a significant surge. Keep this chart on your top watch list!
#Crypto #GASUSDT #ReversalPattern

3
1
11
137
24 Jul 2025
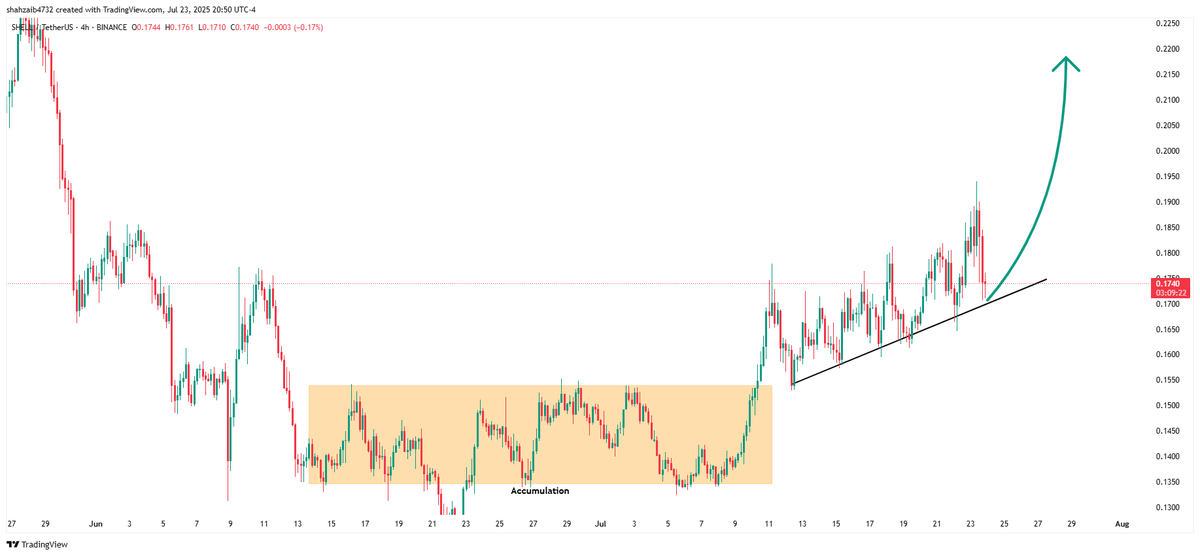
$SHELL is crafting a compelling Inverse Head & Shoulders pattern, signaling a potential bullish reversal! 🚀
$SHELL is completing this powerful reversal pattern, with a clear neckline resistance around $0.0000000000005. A confirmed break above this neckline could lead to substantial upside targets. The stage is set for a significant move. ✨
#SHELL #MemeCoin #Crypto #ReversalPattern
9
2
15
5,625
23 Jul 2025
$PPT2 is shaping up a compelling Inverse Head & Shoulders pattern, hinting at a bullish reversal! 🚀
#PPT2 is completing this powerful reversal pattern, with a clear neckline resistance around $0.0004. A confirmed break above this neckline could lead to substantial upside targets. The stage is set for a significant move. ✨
#PPT2 #Crypto #ReversalPattern #Altcoins

2
6
121
23 Jul 2025
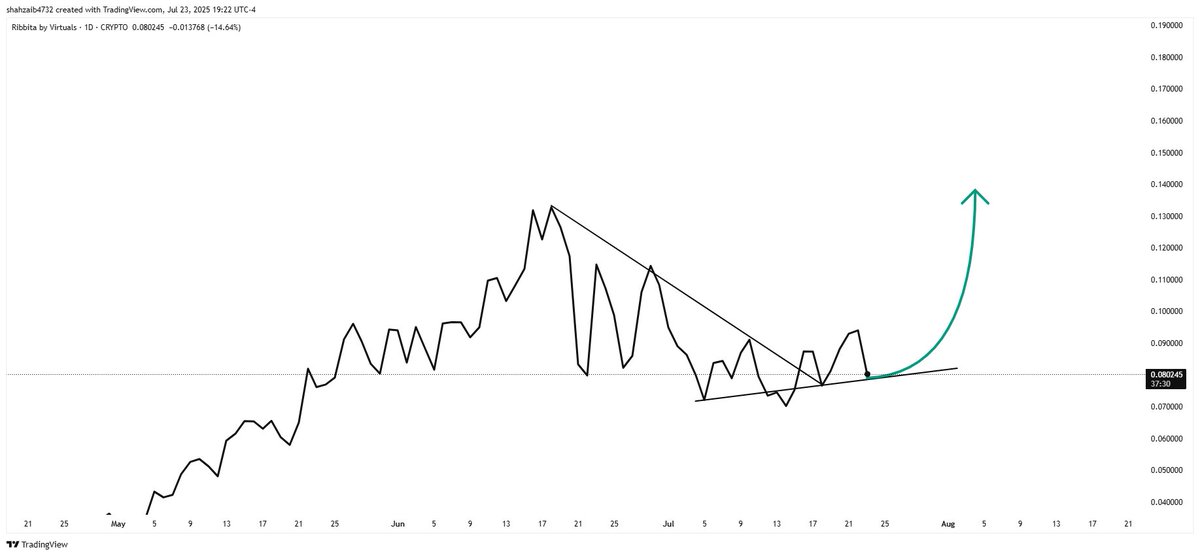
$VIRTUAL is forming a potential double bottom pattern, hinting at a bullish reversal! 📈
#VIRTUAL has found strong support around the $0.0006 - $0.0007 area, establishing a potential reversal base. A successful break above the neckline resistance would confirm this pattern and lead to significant upside. Entering a new reality.
#VIRTUAL #AI #Crypto #ReversalPattern

30
7
31
6,991

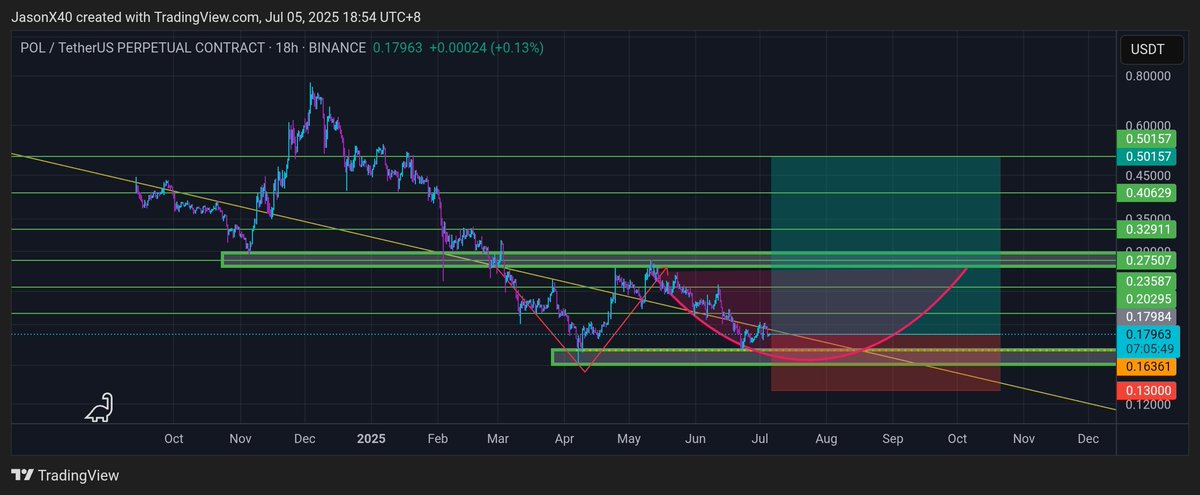
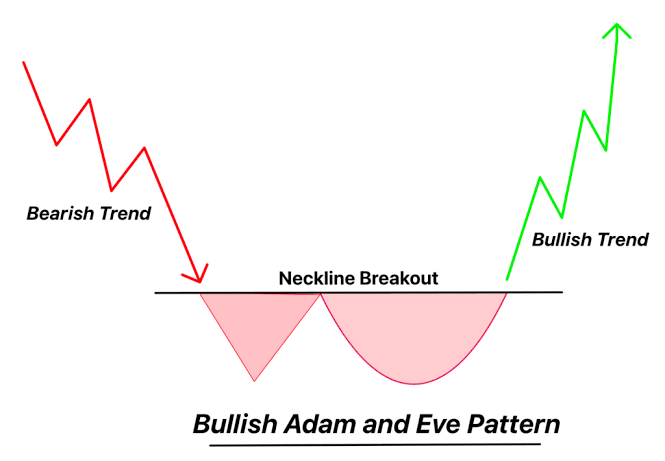
$POL — in my opinion, it's shaping up to form a classic Adam and Eve pattern 👀
If confirmed, this could lead to a strong bullish reversal 💥
#POL #AdamAndEvePattern #CryptoTA #ReversalPattern #Altcoins #BullishSetup #TradingView
3
323

24 Jun 2025
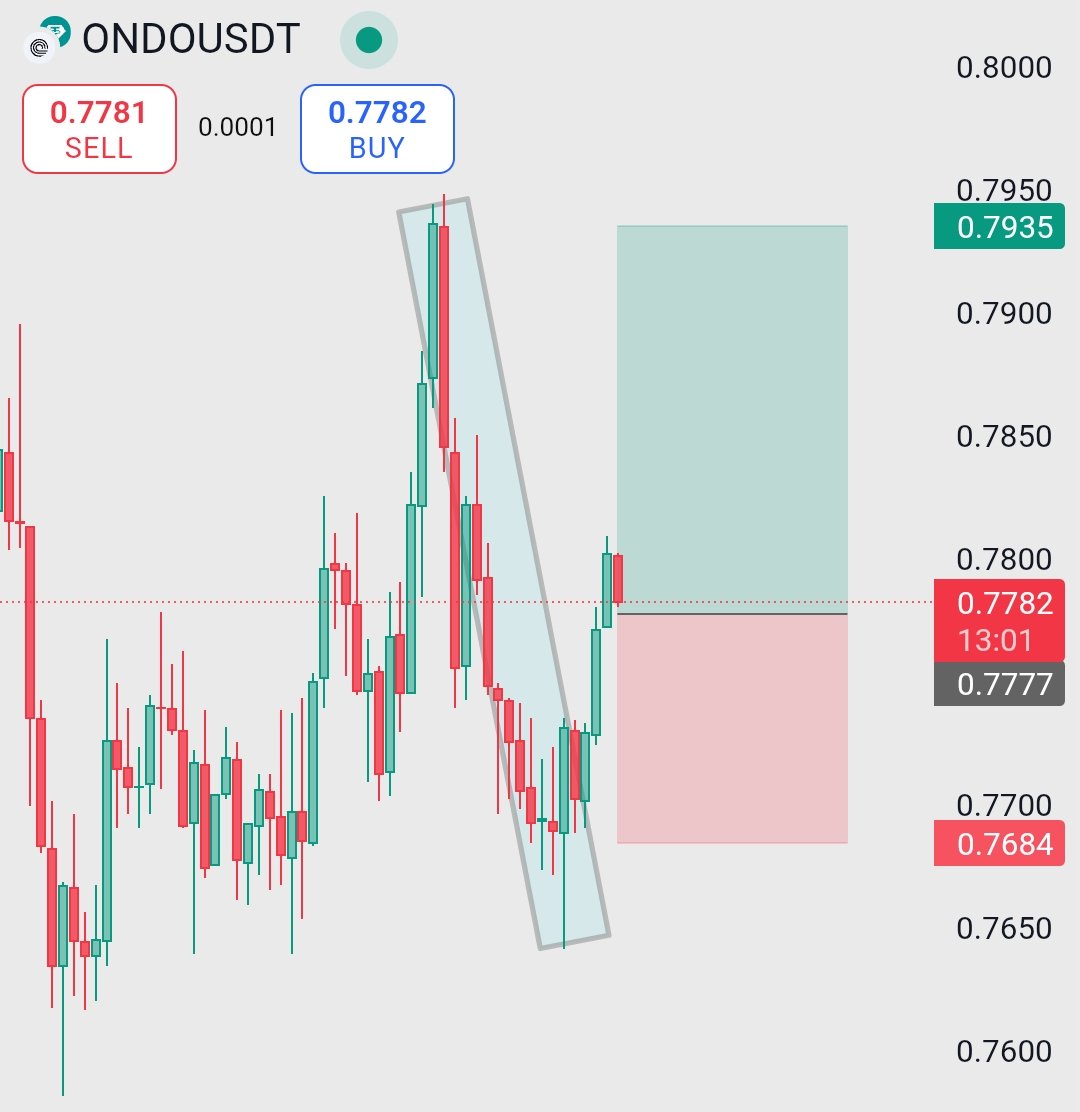
🚀 $ONDO – Bullish Reversal Breaking the Channel! 📈
ONDO just broke out of a descending channel with strength! After a steep drop, buyers stepped in hard — flipping the script with a sharp push upward.
📌 Entry: $0.7782
🎯 Target: $0.7935
🛡 Stop Loss: $0.7684
⚡
#ONDO #AltcoinSetup #BinanceTrading #ReversalPattern #CryptoBreakout
3
370