
Mar 25
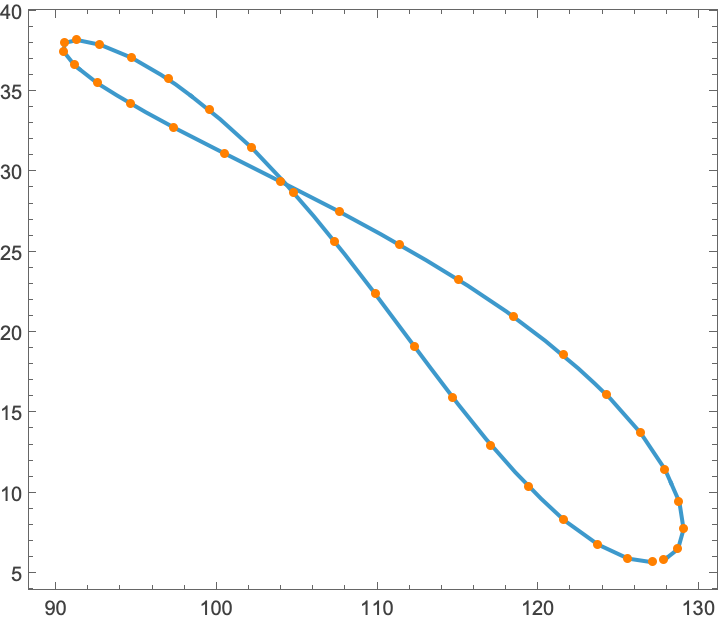
That is amazing. Here is MAthematica code to get this:
sp = SunPosition[
DateRange[DateObject[{2023, 1, 1, 9}, "Hour", "Gregorian", -4.`],
DateObject[{2023, 12, 31, 9}, "Hour", "Gregorian", -4.`], 10]];
Show[
ParametricPlot[
QuantityMagnitude[sp[t]], {t, sp["FirstTime"], sp["LastTime"]}],
Graphics[{Orange, PointSize[Medium],
Point[QuantityMagnitude[sp]["Values"]]}],
Frame -> True
]
8
498

Feb 18
Three.js SSGI WebGPU is amazing! New sunposition-webgpu looks like there is a cycles render inside the browser 🤯 #threejs
3
8
84
4,964


21 Jun 2025
太陽の位置はuniform vec3 sunPosition
が使えてるっぽい?
ただこれ、カメラの向きによるのかちょっと視線動かすだけで数字が変わるみたい
(座標情報xyzをそのままrgbに入れて実験していた)
2
194

in wz the ,,Timer Countdown screen'' you can See Sometimes prison from above and the shadows are strongly sided too Like Stadium so you are right here Im glad they Making the sunposition Like that too because its giving Maps different vibes. Urzikstan lightning is lame
2
1,080

the amazing @threejs for everything player character, projecting into cesium.
Cesium makes it easy to get Sun's position with just:
var sunPosition = Cesium.Simon1994PlanetaryPositions.computeSunPosition(julianDate);
Dumped away a lot of my own codes (like getSunPosition()) - it basically came with nearly everything I needed for a world-travel simulation
2
80

18 Feb 2025
We'd have to check-out your TV package to be sure Ralph! Just send us a DM for that at your convenience. 😊 -Philippe
50

4 Feb 2025
The Truth About the Shadow Stick Method for Navigation
#WildernessNavigation #SurvivalSkills #SunPosition #OutdoorEducation #EssentialNavigation #PioneerWisdom #ShadowAnalysis #NatureSkills #LearnWithUs #SurvivalTips
2
86


29 Nov 2023
Supponi che il 12 agosto 2024 farai il viaggio della speranza in pullman da Trento a Roma partendo alle 6 del mattino.
Su quale lato del mezzo conviene stare per stare in ombra?
Lo scopri con Sit in Shade - sitinshade.com/
#openstreetmap #sunposition #traveling

2
5
19
872


13 Oct 2023
Yes, they are harvesting them now. It is about 30 minutes from me. Marc (and the farm) grows cranberries and blueberries.
2
18


31 Aug 2023
Yeah, looks OK I guess, but have you tried <Sky distance={450000} sunPosition={[0, 1, 0]} inclination={0} azimuth={0.25} />?
1
2
99

18 Aug 2023
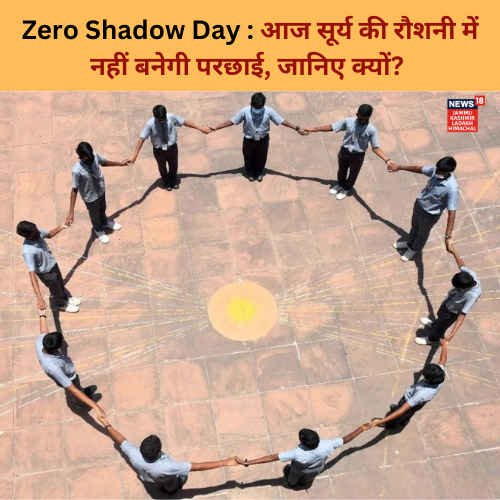
आज 'जीरो शैडो डे' यानी 'शून्य छाया दिवस' है। ऐसी खगोलीय घटना साल में 2 बार होती है। इस दिन सूर्य की किरणें सीधी पड़ने के कारण व्यक्ति या वस्तु की छाया कुछ पल के लिए गायब हो जाती है।
#NoShadowDay #ZeroShadowDay #Astrology #Shadow #SunPosition #News18JKLH
2
262

18 Aug 2023
Zero Shadow Day is a unique astronomical event when the Sun is positioned directly overhead and casts no shadow at solar noon.
#NoShadowDay #ZeroShadowDay #Astrology #Shadow #SunPosition #News18JKLH

2
288

27 May 2023
SunPositionが面白かったから、どうせ時間制限つけるしちょっと夜空をつまみ食い
夕方の時点で帰還処理にする予定だから、夕日が沈む瞬間は見れないんだけどね
1
3
211
24 Mar 2023
Hi Ralph, thanks for reaching out. These emails can certainly be annoying. Can you please forward the emails to abuse@rogers.com so they can be reviewed and blocked from our network? If you have any questions or concerns, we're just a DM away. ^rm
28

5 Mar 2023
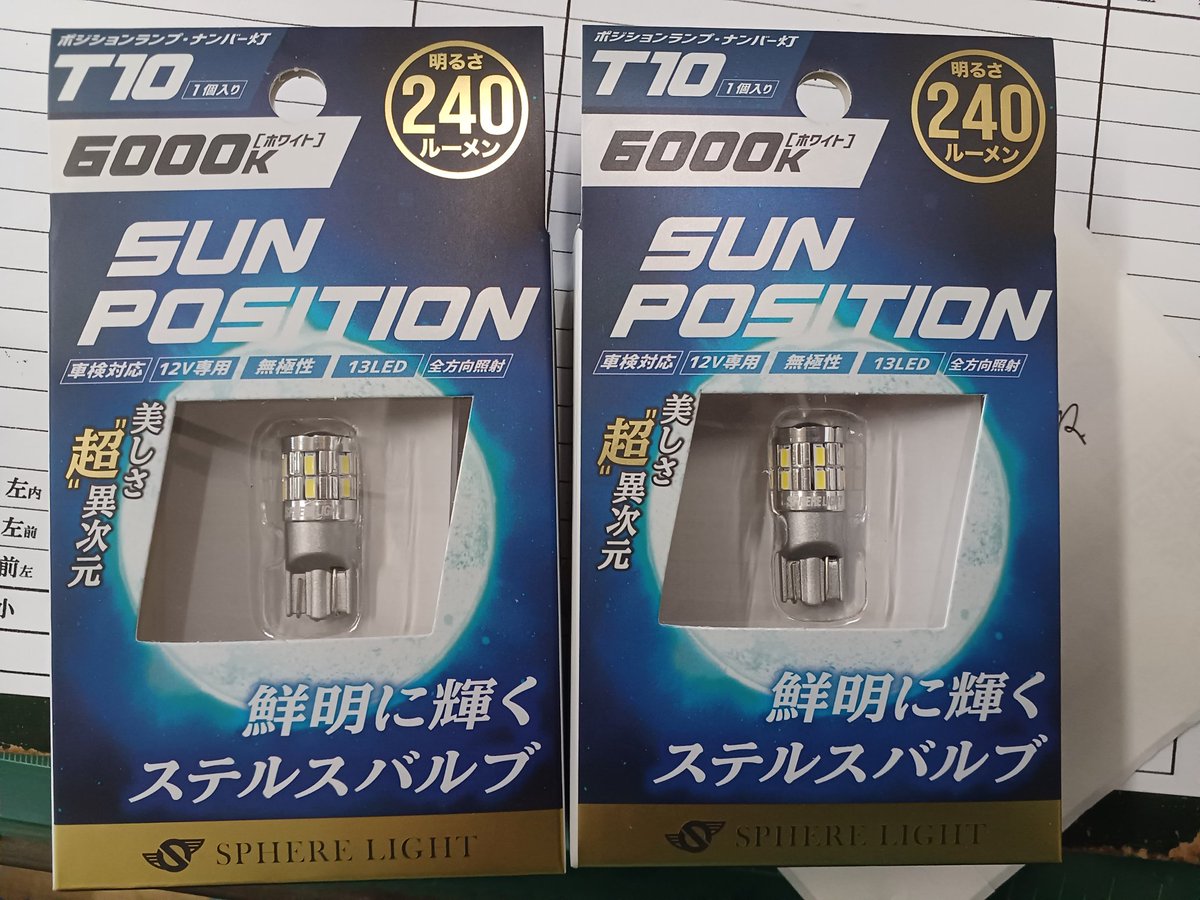
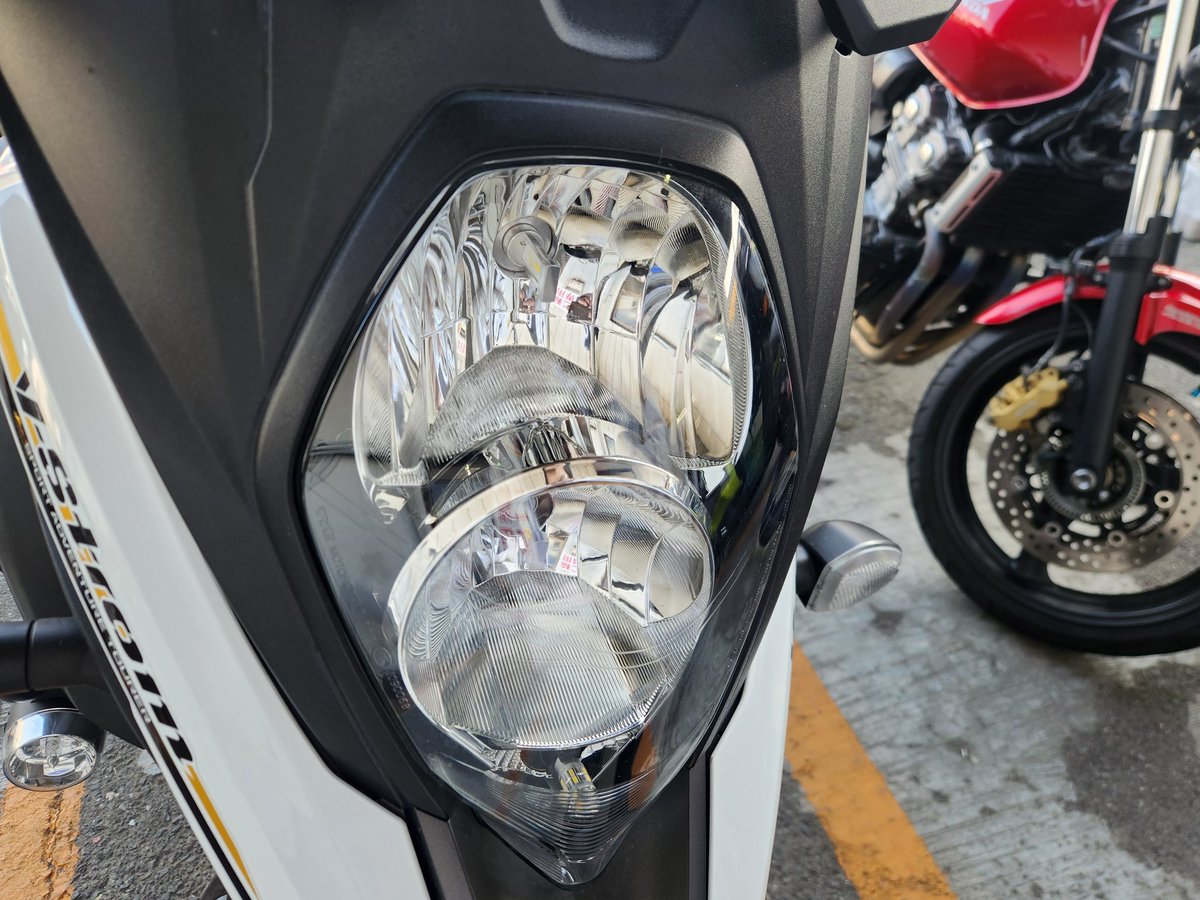
カブ主総会から帰宅後、Vストの回収に
必要なのはローだけだったけど、この際全部変えてしまえとハイとポジションもLEDにw
取り付けパーツ一覧
スフィアライト
ライジング2(ローH7,ハイH9H11)
SUNPOSITION(ポジション)
1
21
457