
Jun 10
6/6
Only two structural paths remain:
Path 1 (default continuation): Continued concentration around Treasuries, institution-controlled settlement, and big issuers — keeping the “explosive adoption but utilization-constrained” setup. This is the exact structure that benefits institutions and whales the most.
Path 2 (the path I’m aggressively betting on): Deep collateral integration utilization explosion full interoperability across chains and apps — turning tokenized assets from passive certificates into actively composable financial primitives.
When Path 2 hits, DeFi protocols, cross-chain apps, and the broader investor base will see nuclear liquidity and composability gains.
RWA’s next chapter has already begun.
The only question left: Are you still watching… or are you positioning for Path 2?
Drop your answer in the comments:
Path 1 or Path 2? Which protocols are you already positioned in?
Reply repost and I’ll drop the full Path 2 Execution Playbook next.
#RWA #OnChainRWA #TokenizedTreasuries #RealYield #InstitutionalFlows #PrivateCredit #Tokenization #CryptoAlpha
#RealYield #InstitutionalFlows #RWAPerps
8

Most people still think RWA is only about tokenized Treasuries.
That view is already outdated.
CoinDesk Research reported that tokenized assets hit a record $28.9B in May, stablecoins reached $320B, and RWA perpetual futures volume climbed to $211B.
The next wave of Web3 is not just assets on-chain.
It is 24/7 financial market infrastructure:
stablecoins, tokenized funds, tokenized stocks, and on-chain derivatives.
Follow for more RWA, Web3, and tokenization insights.
很多人还以为 RWA 只是代币化国债。
这个认知已经落后了。
CoinDesk Research 数据显示,5 月代币化资产规模创下 289 亿美元新高,稳定币市值达到 3200 亿美元,RWA 永续合约交易量升至 2110 亿美元。
Web3 的下一波机会,不只是资产上链。
而是 24/7 金融市场基础设施:
稳定币、代币化基金、代币化股票和链上衍生品。
关注我,持续分享 RWA、Web3 和资产代币化趋势。
#RWA #Web3 #Blockchain #Tokenization #RealWorldAssets #TokenizedAssets #Stablecoins #TokenizedTreasuries #TokenizedStocks #TokenizedFunds #RWAPerps #Perpetuals #DeFi #TradFi #OnChainFinance #DigitalAssets #Crypto #CapitalMarkets #MarketInfrastructure #InstitutionalAdoption #FutureOfFinance #GlobalFinance
1
24
Jun 9
7/7
💡 The next chapter of RWA will not be written by issuance volume — it will be decided by infrastructure maturity.
How long can the current concentrated structure hold? Are we about to flip into a truly distributed liquidity era?
Drop your take below:
Path 1 or Path 2?
Which chain/protocol do you believe will solve the liquidity bottleneck first?
Smash your alpha view in the comments 👇
#RWA #OnChainRWA #TokenizedTreasuries #RealYield #InstitutionalFlows #Tokenization #RWAInfrastructure
#RealYield #InstitutionalFlows #RWAPerps
6
Jun 8
6/6
🔀 Two paths. Choose wrong and RWA dies as alpha:
Path 1 (Institutional comfort zone — low alpha):
RWA stays locked around Treasuries, represented assets, and closed institutional rails.
Winners: Big institutions get stable defensive yields.
Losers: Everyone else — liquidity stays choked, adoption becomes a lie.
Path 2 (The only high-alpha outcome):
Strong cross-chain compliance portability deep private credit utilization real secondary markets turn RWA into true composable on-chain infrastructure instead of static tokenized claims.
My explicit view: Path 2 is the only way RWA keeps pace with the holder explosion.
Accelerating interoperability and private credit liquidity right now is how you front-run the next trillion-dollar category.
Real-world impact:
Path 2 wins → Your bags come alive: cross-chain, lendable, yields multiply.
Path 1 wins → Hundreds of billions sit on-chain rotting while institutions cash out and retail is left in a liquidity desert.
This is the decisive moment.
Tell me below:
Which path do you see playing out — Path 1 or Path 2? Why?
Builders: What’s the #1 interoperability pain point you’re trying to solve right now?
Drop your take 👇 Let’s call the real inflection point together.
#RWA #OnChainRWA #TokenizedTreasuries #PrivateCredit #RealYield #InstitutionalFlows #TokenizedStocks #DeFiAlpha
#RealYield #InstitutionalFlows #RWAPerps
17
Jun 7
6/6
My final call: RWA has only two structurally viable futures — but only Path 2 lets it truly take off:
Path 1: Stay concentrated around Treasury-backed collateral and institution-controlled settlement — keeping today’s “safe but narrow” infrastructure phase alive.
Path 2: Mass migration into perpetual trading, tokenized equities, private credit, and multi-chain ecosystems — turning RWA into a genuinely diversified, liquid financial layer.
Which path wins? It depends on whether secondary activity and composable infrastructure finally outrun pure issuance volume.
The data will decide — and it’s deciding fast.
This is the final window. Wait any longer and you’ll watch institutions devour the next liquidity feast while you’re stuck on the sidelines.
What’s your read — Path 1 or Path 2?
Reply right now, tag your RWA friends, and let’s call the inflection point together!
#RWA #OnChainRWA #TokenizedTreasuries #RealYield #InstitutionalFlows #RWAPerps
14
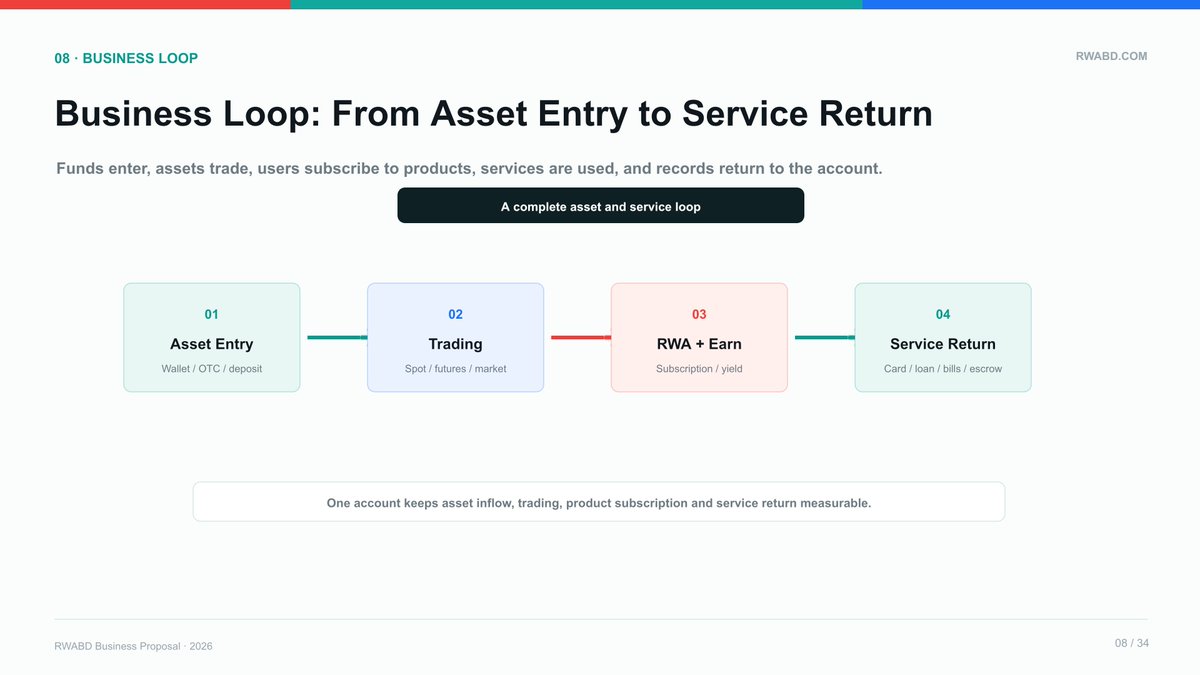
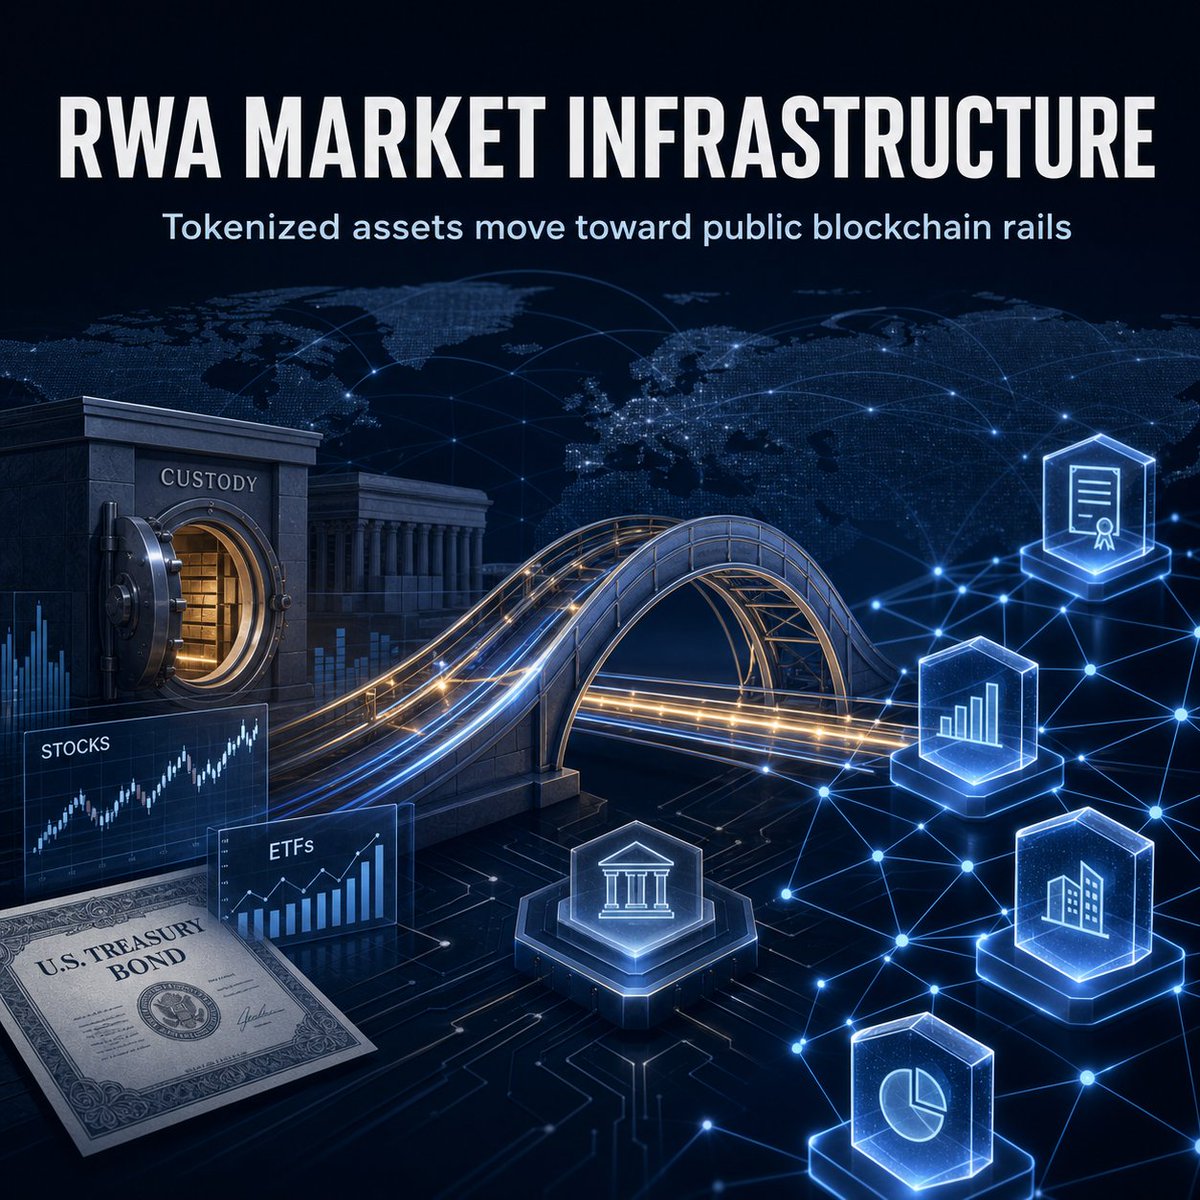
RWA is moving from crypto narrative to market infrastructure.
DTCC plans to connect DTC-tokenized assets to Stellar, bringing traditional assets like stocks, ETFs, and U.S. Treasuries closer to public blockchain rails.
This is the real RWA story:
not just token issuance, but regulated settlement, asset mobility, and institutional-grade financial infrastructure.
RWA 正在从加密叙事走向市场基础设施。
DTCC 计划将 DTC 代币化资产接入 Stellar,让股票、ETF 和美国国债等传统资产更接近公链金融轨道。
这才是 RWA 真正的主线:
不只是发行 Token,而是受监管的结算、资产流动性和机构级金融基础设施。
#RWA #Tokenization #RealWorldAssets #DTCC #Stellar #XLM #TokenizedAssets #TokenizedSecurities #TokenizedTreasuries #ETF #USTreasuries #Web3 #Blockchain #Crypto #DigitalAssets #OnChainFinance #TradFi #DeFi #InstitutionalAdoption #CapitalMarkets #MarketInfrastructure #FutureOfFinance
9
10
95


May 16
🚀 Stellar Welcomes YLDS, the First SEC-Registered Yield-Bearing Stablecoin
The crypto industry has just crossed a major milestone. Figure Technology Solutions has officially launched YLDS, the first SEC-registered yield-bearing stablecoin, on the Stellar network. Behind this announcement lies far more than just another digital dollar — it may represent the birth of a completely new asset class combining yield generation, regulatory compliance, and institutional-grade blockchain infrastructure. 🌐💵
For years, the idea of a stablecoin capable of generating yield while remaining fully compliant with U.S. securities laws seemed nearly impossible. Between SEC scrutiny during the Gary Gensler era and the lack of a clear framework for blockchain-based financial products offering returns, previous attempts repeatedly ran into regulatory walls.
With YLDS, that era may officially be over.
💰 What Is YLDS?
Figure Technology Solutions, the fintech company founded in 2018 by former SoFi CEO Mike Cagney, announced the launch of YLDS on Stellar. The product is issued by Figure Certificate Company and registered with the SEC under Rule 506(c), following a Form D filing submitted on March 15, 2026.
Unlike traditional stablecoins such as USDT or USDC, YLDS distributes yield directly to holders. 📈
🔑 Key Features of YLDS
🪙 USD-pegged stablecoin
🏦 Backed 100% by U.S. Treasury bills and cash equivalents
🔒 Custodied by BNY Mellon
📊 Estimated yield around 4.8% APY
⏳ Interest accrues daily
⚡ Monthly automated on-chain payouts via Soroban smart contracts on Stellar
🔄 T 1 redemption through Stellar anchors
🏛️ Available only to accredited investors and qualified institutions
💵 Minimum investment: $10,000
YLDS effectively replicates the mechanics of a money market fund — but entirely on-chain.
Mike Cagney summarized the vision clearly:
“We built YLDS to do what banks do with your deposits: hold dollars, earn yield, move money, but onchain and regulated.”
⚖️ Built Around Regulation, Not Against It
The key difference between YLDS and traditional stablecoins lies in its legal structure.
YLDS is not classified as a payment stablecoin. Instead, it is legally registered as a security with the SEC. This distinction allows the product to distribute yield while remaining compliant with U.S. securities law.
That means:
✅ Full KYC/AML verification
🛡️ SEC-compliant framework
👔 Restricted access to accredited investors
📑 Transparent legal structure
Rather than attempting to avoid regulation, Figure embraced it from day one.
This approach sharply contrasts with earlier yield-bearing stablecoin projects that faced accusations of offering unregistered securities.
🌟 Why Stellar?
The choice of Stellar is highly strategic.
Stellar has quietly become one of the leading blockchain infrastructures for payments and tokenized real-world assets (RWAs). In 2025 alone, the network processed over $55.6 billion in stablecoin payment volume and hosts more than $2 billion in tokenized assets.
Major financial players already active on Stellar include:
WisdomTree
Franklin Templeton
Ondo Finance
📊 Stellar currently ranks among the top blockchain ecosystems for RWAs globally.
The recent integration of institutional-grade RedStone oracles also helped prepare Stellar for more advanced financial products like YLDS.
According to Raja Chakravorti from the Stellar Development Foundation:
“YLDS expands access to dollar-denominated products combining yield, usability, and global reach.”
🏦 A Threat to USDT and USDC?
Yield-bearing stablecoins could significantly reshape the stablecoin market.
Today, issuers like Tether and Circle retain all the revenue generated from reserve assets backing USDT and USDC. Holders receive no yield, despite billions earned through Treasury exposure.
YLDS flips that model by passing the yield directly to institutional users. 💸
📊 Quick Comparison
ProductYieldSEC RegisteredAudienceUSDTNone❌RetailUSDCNonePartialRetailBUIDL (BlackRock)~4.2%✅InstitutionalYLDS~4.8%✅Institutional
YLDS currently offers a higher yield than BlackRock’s tokenized fund BUIDL, although the counterparty risk profile differs significantly.
🌐 The Rise of Tokenized Institutional Cash
YLDS arrives at a time when institutions are actively searching for blockchain-based treasury solutions that remain fully compliant.
The U.S. money market industry alone exceeds $6 trillion in assets. Even a small migration toward tokenized yield-bearing products could transform the financial landscape.
Tokenized treasury products offer several advantages:
⚡ Faster settlement
🔄 Automated on-chain operations
🔍 Greater transparency
🌍 Cross-border interoperability
Many analysts believe the tokenized real-world asset market could surpass $2 trillion by 2028.
YLDS positions itself directly within that trend.
⚠️ Challenges and Risks
Despite its strong narrative, YLDS still faces several important hurdles.
💧 Liquidity Constraints
Unlike USDT or USDC, YLDS is legally structured as a security and operates with T 1 redemption.
This may discourage institutions requiring instant liquidity.
🚪 Restricted Access
YLDS is not accessible to retail investors:
Accredited investors only
$10,000 minimum
Strict compliance onboarding
This is clearly an institutional B2B product.
📉 Adoption Remains Unproven
Success will largely depend on adoption by:
fintech companies
neobanks
institutional treasury managers
Figure has already secured approximately $50 million in initial commitments, including partnerships with WisdomTree.
🔮 Possible Scenarios for YLDS
🚀 Bullish Scenario — Stellar Becomes the Institutional Stablecoin Hub
In this scenario:
YLDS surpasses $500 million AUM by the end of 2026
Expansion to Sui succeeds
More issuers launch SEC-registered yield-bearing stablecoins
Stellar could emerge as a leading infrastructure for institutional tokenized dollars.
Estimated probability: 35%
📈 Base Scenario — A Successful Institutional Niche Product
YLDS finds a strong but limited institutional audience without disrupting the broader stablecoin market.
Assets stabilize between $100M and $300M.
Estimated probability: 45%
📉 Bearish Scenario — Limited Adoption
Liquidity issues or regulatory complications slow adoption significantly.
In this case, YLDS remains under $50 million AUM over the long term.
Estimated probability: 25%
👀 Key Metrics to Watch
Several indicators will determine whether YLDS truly succeeds:
📊 Total market capitalization growth
🔄 Trading volume on Stellar DEXs
🏦 Fintech and neobank integrations
⚖️ SEC regulatory developments
💰 Yield competitiveness vs traditional money markets
🌐 Growth of Stellar’s RWA ecosystem
The first major milestone will likely be surpassing $100 million AUM in the coming months.
🧠 Final Thoughts
The launch of YLDS could mark the beginning of a major shift in institutional on-chain finance.
For the first time, a product combining:
yield generation 📈
SEC compliance ⚖️
institutional custody 🏦
Treasury-backed reserves 💵
automated blockchain distribution 🌐
is operating within a fully regulated framework.
The question is no longer whether yield-bearing stablecoins are possible.
The real question is whether they can scale enough to compete with traditional money market funds and reshape the institutional stablecoin industry over the next decade.
The next 24 to 36 months will be critical. ⏳🚀
#️⃣ #Crypto #Bitcoin #Ethereum #Stellar #XLM #Stablecoin #YieldBearingStablecoin #YLDS #SEC #Blockchain #CryptoNews #DeFi #RWA #Tokenization #TokenizedAssets #MoneyMarket #TreasuryBills #USDC #USDT #Fintech #Neobank #InstitutionalCrypto #Soroban #BNYMellon #Figure #FigureMarkets #Web3 #DigitalAssets #CryptoMarket #Altcoins #Finance #TradFi #OnChainFinance #TokenizedTreasuries #Bullish #CryptoInvesting #RealWorldAssets #CryptoTrading #SECCompliance #FintechNews #BlockchainTechnology #CryptoCommunity #XRP #TokenEconomy #CryptoUpdate #Investing #Yield #PassiveIncome #TokenizedFinance #FinancialMarkets

1
13
54
1,520
May 15
🚨 Franklin Templeton Has Tokenized $1 Billion on Stellar — And Kraken Just Opened the Door to Wall Street 🚀
The crypto market continues to move deeper into institutional finance. Franklin Templeton, one of the world’s largest asset managers, now manages over $1 billion in tokenized assets through its BENJI fund — and the blockchain powering it is none other than Stellar ($XLM). 🌐
The latest major development?
👉 Kraken has officially integrated BENJI, strengthening the bridge between traditional finance and blockchain infrastructure.
💰 BENJI: Tokenized U.S. Treasuries on Blockchain
BENJI is Franklin Templeton’s tokenized fund offering exposure to U.S. Treasuries through blockchain technology.
Instead of relying solely on traditional financial rails, investors can hold fund shares as digital tokens while maintaining exposure to one of the safest asset classes in the world. 🏛️
This model brings several key advantages:
✅ Near-instant settlement
✅ 24/7 accessibility
✅ Lower operational costs
✅ Greater transparency
✅ Improved liquidity potential
Tokenized Real World Assets (RWAs) are quickly becoming one of the strongest narratives in crypto — and tokenized Treasuries are leading the charge. 📈
🌟 Why Stellar?
Franklin Templeton’s choice of Stellar is far from random.
For years, Stellar has positioned itself as a blockchain optimized for payments and financial asset issuance.
The network offers:
⚡ Fast transactions
💸 Extremely low fees
🏦 Institution-friendly infrastructure
🌱 Energy efficiency
🛠️ Native asset tokenization tools
As financial giants search for scalable and compliant blockchain solutions, Stellar is emerging as a serious contender.
Franklin Templeton choosing Stellar sends a strong message to the market:
Institutions are no longer experimenting with blockchain.
They are building real financial products on it.
🐙 Kraken Accelerates Institutional Adoption
Kraken’s integration of BENJI marks another major step toward mainstream adoption.
As one of the most respected crypto exchanges globally, Kraken now gives broader market access to tokenized Treasuries through blockchain infrastructure.
This could potentially unlock:
🔹 More institutional capital entering crypto
🔹 Easier access to U.S. Treasury exposure for crypto investors
🔹 Deeper convergence between TradFi and DeFi
The walls between Wall Street and crypto continue to crumble. 🏦➡️🌐
💎 XLM Is Becoming Financial Infrastructure
This development also puts fresh attention on Stellar’s native token: XLM.
While Ethereum still dominates much of the tokenization market, Stellar is quietly positioning itself as a highly efficient alternative for institutions seeking lower costs and operational efficiency.
The narrative is shifting:
Stellar is no longer just a payment network.
It is becoming institutional financial infrastructure.
When billions of dollars in real-world assets move on-chain, the market starts paying attention. 👀
📊 Is Tokenization the Next Mega Trend?
Many analysts believe tokenized assets could become a multi-trillion-dollar market over the next decade.
Industries already exploring tokenization include:
🏢 Real estate
📜 Bonds
📈 Stocks
🏦 Money market funds
🪙 Commodities
Major financial institutions such as BlackRock, JPMorgan, Citi, and Franklin Templeton are already heavily involved.
The message is becoming increasingly clear:
Blockchain is no longer just speculative technology.
It is evolving into the infrastructure layer of global finance. 🌍
🔥 Conclusion
With over $1 billion tokenized on Stellar, Franklin Templeton has validated a real institutional use case for blockchain technology.
Kraken’s integration of BENJI further strengthens this momentum.
For years, the crypto industry waited for Wall Street to arrive.
Now it looks like Wall Street is already here. 🚀
And Stellar may become one of the invisible rails powering the future of finance.
#XLM #Stellar #StellarLumens #BENJI #FranklinTempleton #Kraken #Crypto #Blockchain #RWA #RealWorldAssets #Tokenization #TokenizedAssets #TokenizedTreasuries #USTreasuries #TradFi #DeFi #InstitutionalAdoption #Web3 #CryptoNews #Altcoins #Finance #DigitalAssets #OnChain #Bullish #CryptoMarket #Fintech #WallStreet #AssetTokenization #FutureOfFinance #CryptoTwitter #XRP #Ethereum #Bitcoin #Investing #TokenizedFinance #FinancialInfrastructure #CryptoAdoption #BlockchainTechnology #RWAs #MoneyMarketFund #CryptoCommunity #Altseason #Layer1 #Payments #CryptoInvesting #SEC #BlackRock #JPMorgan #TokenEconomy #StellarNetwork

4
5
44
590

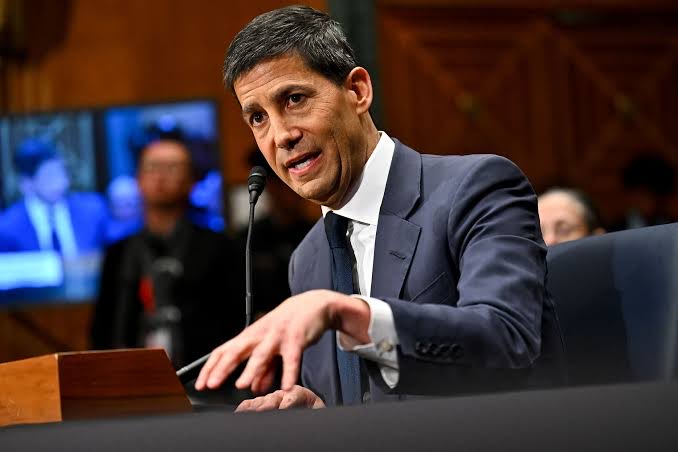
💰Congratulations Kevin Warsh as new FED Chair
- For next 9–14 months Kevin Warsh will get interest rates to 3% likely before MidTerms.
- Markets will rip higher and Trump-world will hail him as the anti-powell savior who finally delivered.
- 2027 Fully on-chain and expect the unexpected. #CouldBeThrownUnderTheBus #MAGA #KevinWarsh #FedChair #InterestRatesTo3 #AmericaFirstEconomy #TokenizedTreasuries #OnChainFuture #RahuRising #WEFWatch #StellarPredictions #MarketsRipHigher

BREAKING: The US Senate has officially confirmed Kevin Warsh as the next Chairman of the Federal Reserve to replace Jerome Powell.
2
167

May 13
🏦 JPMorgan เปิดกองทุนตลาดเงินแบบ Tokenized กองที่ 2 บน Ethereum ต่อจาก MONY 🚀
.
JPMorgan กำลังเปิดตัวกองทุนใหม่ชื่อ #JLTXX หรือ OnChain Liquidity-Token Money Market Fund บน Ethereum ครับ
.
จุดสำคัญคือ นี่ไม่ใช่กองแรก แต่เป็น กองทุนตลาดเงินแบบ Tokenized กองที่ 2 ของ JPMorgan บน Ethereum ต่อจาก #MONY (My OnChain Net Yield Fund) ที่เปิดตัวไปก่อนหน้านี้ครับ
.
📌 อธิบายแบบเข้าใจง่าย
.
1️⃣ MONY (My OnChain Net Yield Fund) = เน้นฝั่งนักลงทุนสถาบันที่ต้องการบริหารสภาพคล่องแบบ Onchain
.
2️⃣ JLTXX = ออกแบบมาเพื่อรองรับความต้องการของผู้ออก Stablecoin ที่ต้องถือสินทรัพย์สำรองคุณภาพสูงตามกฎหมายใหม่ของสหรัฐฯ
.
พูดง่าย ๆ คือ JPMorgan ไม่ได้แค่มาทดลองบน Blockchain แล้วจบ แต่กำลังเริ่มต่อยอดโปรดักต์จริงบน Ethereum อย่างต่อเนื่องครับ 🌐
.
📍กองนี้จะลงทุนใน
.
💵 U.S. Treasurys (พันธบัตรรัฐบาลสหรัฐ)
.
💵 Overnight Repo ที่มี Treasury หรือเงินสดเป็นหลักประกัน
.
นั่นแปลว่า @ethereum กำลังถูกใช้เป็นรางการเงินจริงมากขึ้นเรื่อย ๆ และ Narrative อย่าง RWA (Real-World Assets), Stablecoin Infrastructure, และ Onchain Finance ก็กำลังชัดขึ้นเรื่อย ๆ เช่นกันครับ 🔥
.
#JPMorgan #MONY #JLTXX #Ethereum #RWA #Stablecoin #Tokenization #OnchainFinance #TokenizedTreasuries #ETH #คริปโต #การลงทุน #peterpriew #CryptoSociety #เรียนรู้แบ่งปันเติบโต

May 12

JUST IN: JPMorgan to launch tokenized money-market fund on Ethereum.
1
3
7
780

May 10
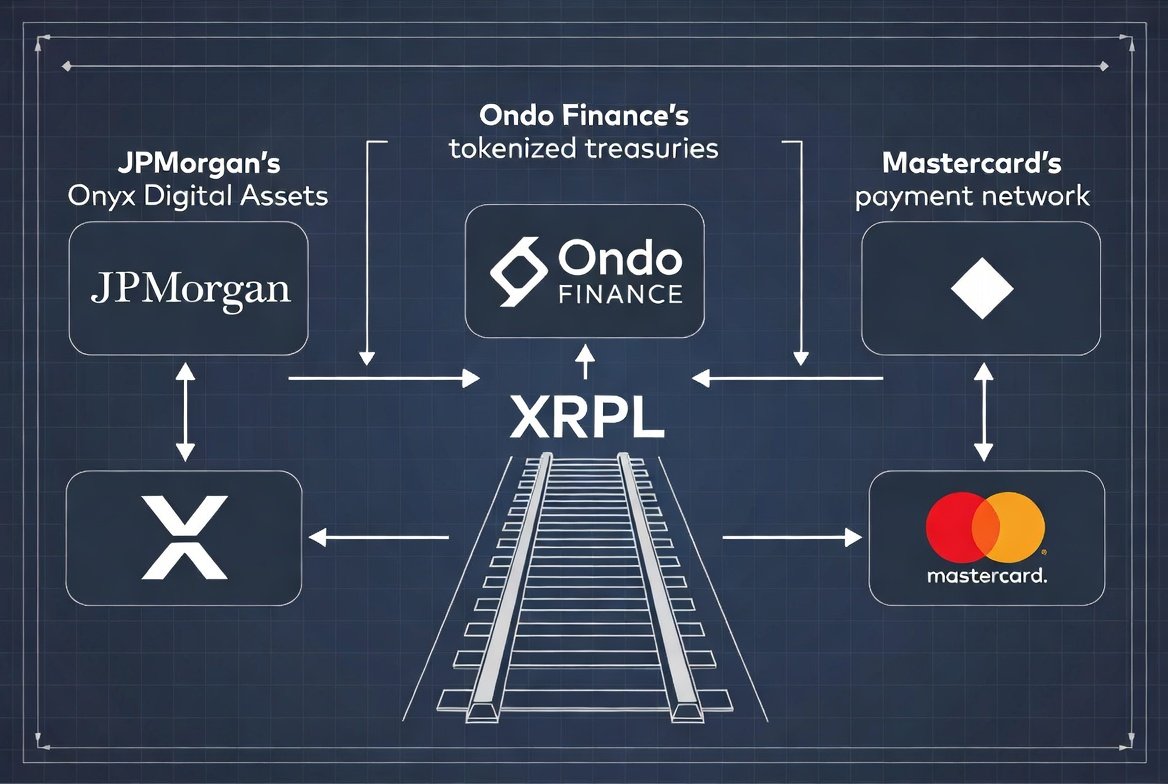
🚀 JPMorgan just teamed up with Ripple, Mastercard & Ondo to settle tokenized US Treasuries on the XRP Ledger!
💎 Cross-border redemption completed — tokenized assets moving on public blockchain rails while dollar settlement flows through traditional banking. Real institutional adoption in motion.
This is how TradFi and crypto converge. How big is this for XRP Ledger and RWAs? Drop your take below 👇
#XRP #XRPL #TokenizedTreasuries #RWA #Ripple @Ripple @XRP
1
16
97
1,539

🧵 XRP LEDGER MILESTONE THREAD
1/ 🚨 HISTORIC FIRST: JPMorgan, Mastercard, Ripple & Ondo Finance just pulled off the first-ever near real-time cross-border, cross-bank redemption of tokenized U.S. Treasuries on the XRP Ledger (XRPL).
Public blockchain meets traditional banking — huge leap for institutions and 24/7 global settlement. 🏦🔗
2/ How it actually went down step-by-step:
- Ripple redeemed part of its Ondo Short-Term U.S. Government Treasuries (OUSG) tokenized on XRPL.
- Ondo handled the on-chain redemption.
- Fiat instructions went through Mastercard’s Multi-Token Network.
- Landed on Kinexys by J.P. Morgan.
- JPMorgan settled USD straight into Ripple’s Singapore bank account via correspondent network.
Whole thing took under 5 seconds — even after banking hours.
3/ Why this is massive:
- First cross-border, cross-bank tokenized Treasury redemption on a public ledger in real time.
- XRPL just proved it can plug directly into Wall Street giants for RWA settlement.
- Unlocks true 24/7 global liquidity — goodbye T 2 delays.
- Ripple called it a real step toward 24/7 financial infrastructure.
4/ XRP popped on the news. Analysts say this is the strongest proof yet that XRPL is built for tokenized Treasuries and cross-border payments. Trillions in RWA volume could flow through public chains like this.
5/ Official partners (announced May 6):
• Ondo Finance
• Kinexys by J.P. Morgan
• Mastercard Multi-Token Network
• Ripple / XRPL
Covered by The Street, CoinDesk, AMBCrypto, CryptoBriefing, Yahoo Finance — all details match perfectly.
What’s your take? Tokenized Treasuries finally going mainstream on public rails? More banks incoming? 👇
#XRP #XRPL #Ripple #JPMorgan #Mastercard #OndoFinance #TokenizedTreasuries #RWA
2
116
May 7
🏦 RWA กำลังไปไกลกว่าที่หลายคนคิด…ตอนนี้เริ่มเชื่อม Blockchain เข้ากับระบบธนาคารจริงแล้ว 🚀
.
Mastercard, Ondo, Kinexys by J.P. Morgan และ Ripple เพิ่งทดสอบ redeem สินทรัพย์พันธบัตรสหรัฐแบบโทเคน (Tokenized U.S. Treasuries) บน XRP Ledger สำเร็จ
.
📍 จุดสำคัญ คือ ธุรกรรมนี้ทำ ข้ามประเทศ, ชำระเงิน เกือบเรียลไทม์ (near real-time) และเกิดขึ้นได้แม้ นอกเวลาทำการธนาคาร
.
🚨 นี่คือสัญญาณว่า ตลาดการเงินแบบ 24/7 ไม่ได้เป็นแค่ไอเดียแล้ว แต่มันกำลังเริ่มเชื่อม Public Blockchain เข้ากับระบบการเงินจริงทีละขั้นครับ 😎
.
#RWA #TokenizedTreasuries #Blockchain #RealWorldAssets #peterpriew #CryptoSociety #เรียนรู้แบ่งปันเติบโต
May 6

Today, Mastercard, @OndoFinance, Kinexys by @JPMorgan, and @Ripple successfully completed a landmark transaction connecting a public blockchain with interbank settlement rails.
Together, we’re laying the groundwork for 24/7 global markets that never close.

2
5
717
May 6
🚨 Institutional milestone unlocked.
Ondo Finance, Kinexys by J.P. Morgan, Mastercard, and Ripple just completed the first cross-border real-time settlement of tokenized U.S. Treasuries (OUSG) outside banking hours.
Flow: OUSG redemption on XRP Ledger → Mastercard routing → J.P. Morgan delivery → Ripple USD account.
This is real bridging between public blockchains and traditional finance.
24/7 tokenized markets are no longer future — they’re happening now.
What does this mean for the broader RWA and XRP ecosystem? Your take 👇
@Ripple @OndoFinance #Ondo #XRP #TokenizedTreasuries #RWAs #RealWorldAssets #CrossBorder #InstitutionalAdoption

3
66

Apr 28
On-chain RWA Data Analysis & Tokenization Metrics (Apr 28, 2026)
Capital continues to expand across tokenized RWA, but utilization remains structurally constrained despite rising market size. As of April 28, 2026, distributed asset value has reached ~$30.5B ( 11% 30d), while DeFi active TVL remains around $1.9–2.0B, highlighting a persistent gap between issuance and actual on-chain usage. This reflects a structure where growth is driven by asset onboarding rather than composability— a condition that would be invalidated if DeFi utilization begins to scale alongside issuance, reducing idle capital across major asset classes.
The current market structure aligns with a constrained expansion phase, where asset value continues to rise but remains functionally underutilized. Liquidity is concentrated not only at the issuer level but also at the chain level, with Ethereum maintaining structural dominance. Across major RWA segments—stablecoins, commodities, and tokenized securities—Ethereum continues to anchor institutional activity, reinforcing a liquidity clustering dynamic even as alternative chains gain incremental traction.
At the capital behavior level, flows appear concentrated and defensive, rather than broadly expansionary. Treasury-backed assets and private credit products continue to absorb the majority of capital, reflecting a preference for stable yield over composable usage. Meanwhile, newer ecosystems such as Solana show localized growth, with approximately $1.5B in RWA market cap and ~$600M in DeFi TVL, suggesting pockets of higher utilization but still limited systemic impact. This indicates that capital is not yet rotating aggressively but instead consolidating within trusted structures.
Two key metrics define this phase: DeFi utilization rate (active TVL vs total RWA value) and issuer-level inflows/outflows. These metrics are critical because they directly capture whether capital is becoming productive or remaining idle. A sustained increase in utilization rate would signal a transition toward composability-driven growth, while rising outflows from dominant issuers could indicate early-stage liquidity redistribution.
Historically, RWA markets tend to evolve from issuance-driven growth into utilization-driven expansion. Early phases are characterized by high concentration and low composability, followed by gradual integration into DeFi primitives such as collateral, lending, and derivatives. The current structure remains consistent with the early-to-mid transition phase, though regulatory developments—such as tokenized fund frameworks—may accelerate the shift toward standardized, liquid markets.
Two structural paths emerge from here. If utilization remains low while issuance continues to grow, the system would stay in a constrained expansion phase with increasing idle capital. Alternatively, if composability improves and DeFi usage scales alongside asset growth, this would signal a transition toward a more integrated and productive RWA ecosystem. Both scenarios remain structurally viable, depending on how capital flows evolve across issuers, chains, and use cases.
#RWA #OnChainRWA #TokenizedTreasuries #RealYield #InstitutionalFlows

2
16
Apr 25
On-chain RWA Data Analysis & Tokenization Metrics (Apr 25, 2026)
Capital continues to flow into tokenized RWA, but liquidity remains concentrated among leading issuers and dominant chains. Over the past 24 hours (April 24–25, 2026), tokenized funds, private credit, and Treasuries drove total distributed asset value above $300B, while active market capitalization surged to $25.2B (5x YoY), marking a clear transition from narrative-driven attention to infrastructure-focused utilization. This structural phase would be disrupted if top issuer outflows consistently exceeded inflows, triggering liquidity shifts across the ecosystem.
The current market structure reflects a highly compressed expansion phase, where Ethereum leads with $16.2B in RWA TVL (≈55%), followed by BNB ($3.81B), Solana ($1.4B), and Stellar ($1.3B). While Treasuries anchor liquidity, alternative assets—tokenized stocks and PE—have accelerated growth, with PE distributed value up ~118% over 30 days. This clustering suggests expansion is still concentrated, and liquidity remains structurally uneven across issuers and chains, despite broadening market participation.
At the capital behavior level, flows are concentrated yet selective, blending new inflows with internal rotation. Top Treasury issuers dominate net capital absorption, while emerging assets attract targeted allocations. For example, tokenized equities and private credit inflows outpaced redemptions by approximately 1.5–1.8x, reflecting an active reallocation phase rather than uniform distribution. Institutional capital is deploying strategically across assets and chains, underscoring a hybrid phase of expansion plus rotation.
Key metrics to monitor in this structure include issuer-level inflows/outflows and the issuer concentration ratio, both highly sensitive to liquidity shifts. Elevated concentration makes redemption events impactful, whereas distributed inflows across new asset classes signal early-stage expansion. Sustained outflows at top issuers or declining concentration would trigger a transition toward a more distributed liquidity structure. Tracking these metrics through tools like Dune ensures actionable monitoring of structural shifts.
Historically, similar phases show a pattern: initial concentration in Treasuries, followed by gradual rotation into higher-yield or more composable assets, such as tokenized stocks, real estate, or credit instruments. The current on-chain dynamics mirror this historical pattern but exhibit faster diversification and heightened inter-chain competition, consistent with an infrastructure adoption phase.
Looking forward, two structural paths emerge: one where capital remains concentrated within top issuers and chains, sustaining a compressed expansion; another where redemption-driven rotation disperses liquidity across chains and emerging asset classes, marking the start of a broader distribution phase. Both remain neutral possibilities, contingent on evolving capital flows and issuer activity.
#RWA #OnChainRWA #TokenizedTreasuries #RealYield #InstitutionalFlows #Ethereum #TokenizedEquities
1
191
Apr 22
On-chain RWA Data Analysis & Tokenization Metrics (Apr 22, 2026)
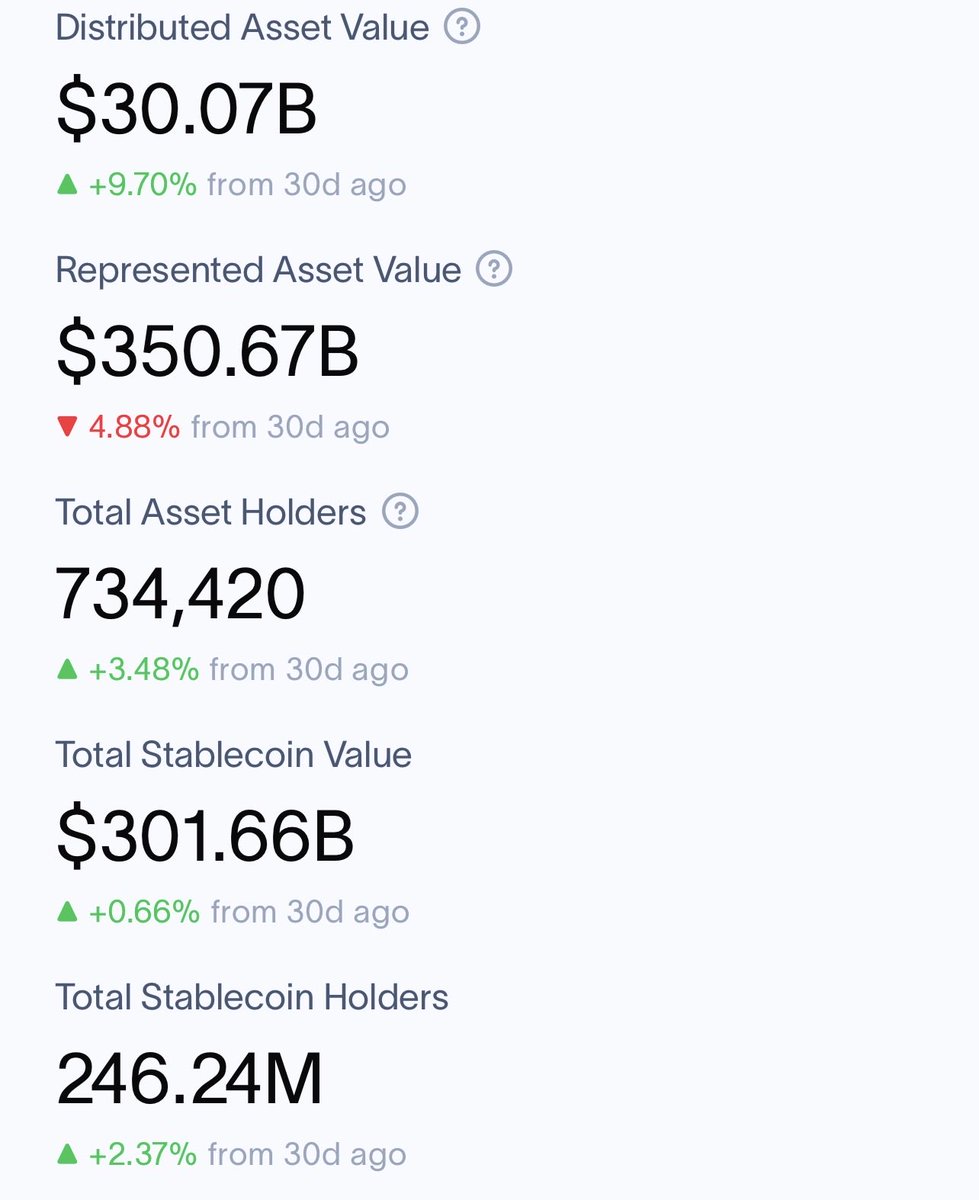
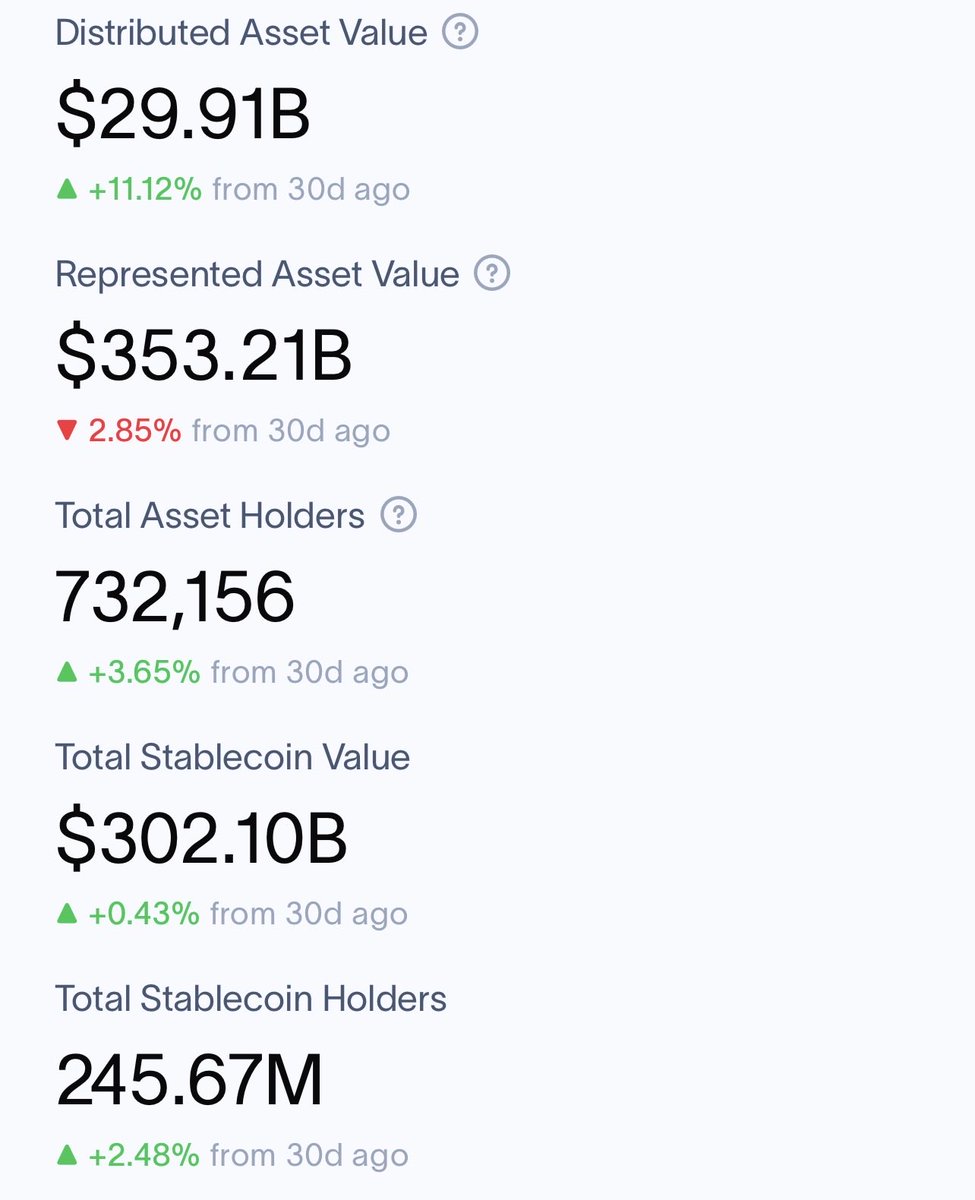
RWA capitalization is accelerating, but on-chain liquidity remains unevenly distributed across asset classes. Over the past 24 hours, total distributed on-chain asset value has reached approximately $29.91B, driven by both tokenized Treasuries and private credit, while DeFi composability data indicate that a substantial share of these assets is yet to be actively utilized. This structure reflects concentrated capital allocation among top issuers and high-value private credit, a pattern that would shift if redemption velocity consistently exceeded new issuance by 1.5x, potentially destabilizing current liquidity clustering. Tracking issuer-level inflows and cross-asset movement is critical to validate this stage.
The current market structure shows RWA expansion is concentrated rather than uniform. Tokenized Treasuries account for roughly $13.4B, while private credit and real estate debt now surpass $14B, together representing over 40% of total on-chain RWA holdings. Issuer concentration remains high: the top 3 holders control approximately 65–68% of total TVL, confirming a compressed liquidity phase rather than broad dispersion. The structural stage aligns with early rotation patterns, where capital reallocates among high-yield or emerging asset categories without substantially increasing overall network-wide liquidity.
Institutional capital behavior demonstrates both concentration and selective expansion. New inflows into high-utilization assets, such as syrupUSDC private credit, exceeded $283M with a utilization rate of 22.5%, outperforming BUIDL’s 0.62%, indicating active deployment rather than passive holdings. Capital remains concentrated among a few issuers, while rotation from Treasuries into private credit and infrastructure assets is underway. This inflow-to-redemption ratio—currently approximately 1.8x—highlights a defensive yet opportunistic posture among institutions seeking yield through composable on-chain instruments .
Monitoring for structural transitions requires attention to two key metrics. First, issuer-level 30-day inflows/outflows must be tracked, as sudden outflows from the top 3 issuers would signal a potential liquidity shift. Second, redemption velocity relative to new issuance volume serves as a critical trigger; sustained velocity exceeding issuance by 1.5x would move the network from a concentrated expansion phase into dispersive stress.
Historically, similar structural stages have occurred when private credit and non-Treasury assets began to surpass 30–40% of RWA holdings. Previous episodes show that such concentration tends to coincide with issuer-level reallocation and gradual DeFi composability adoption, creating measurable liquidity pockets that precede broader on-chain yield generation. The current phase appears consistent with these historical patterns, with the added novelty of early AI infrastructure tokenization and emerging tokenized equities driving incremental diversity in asset deployment.
Two neutral evolution paths are evident. One scenario extends the current issuer concentration trend, further compressing liquidity while gradually expanding private credit and infrastructure allocations. The alternative involves redemption-driven dispersion, in which concentrated Treasuries and private credit holdings are partially unwound, redistributing liquidity across a broader set of issuers and asset types. Both paths remain structurally consistent with observed inflow and composability metrics, contingent on capital rotation and redemption velocity dynamics.
#RWA #OnChainRWA #TokenizedTreasuries #RealYield #InstitutionalFlows #PrivateCredit #AIInfrastructure
2
3
39