

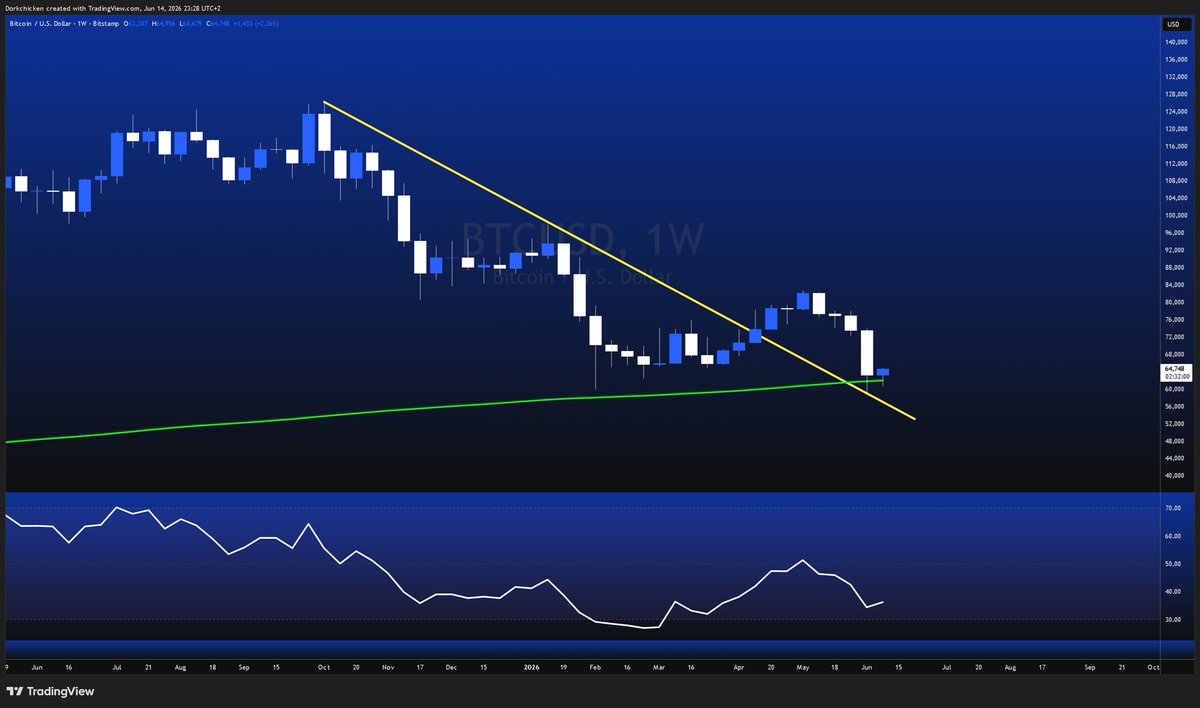
$BTC Weekly Close Update 📈
So far, Bitcoin has checked several major bullish boxes:
• Diagonal trendline breakout and successful retest ✅
• 200-Week Moving Average tested and holding ✅
• Most importantly, weekly RSI is showing a bullish divergence ✅
Price tested support while momentum made a higher low. Historically, that’s often how major reversals begin.
The bears had their shot. Now it’s up to the bulls to follow through.
#Bitcoin #BTC #Crypto #Bullish #RSI #TechnicalAnalysis #BitcoinNews #Investing #Markets #HODL


Jun 8

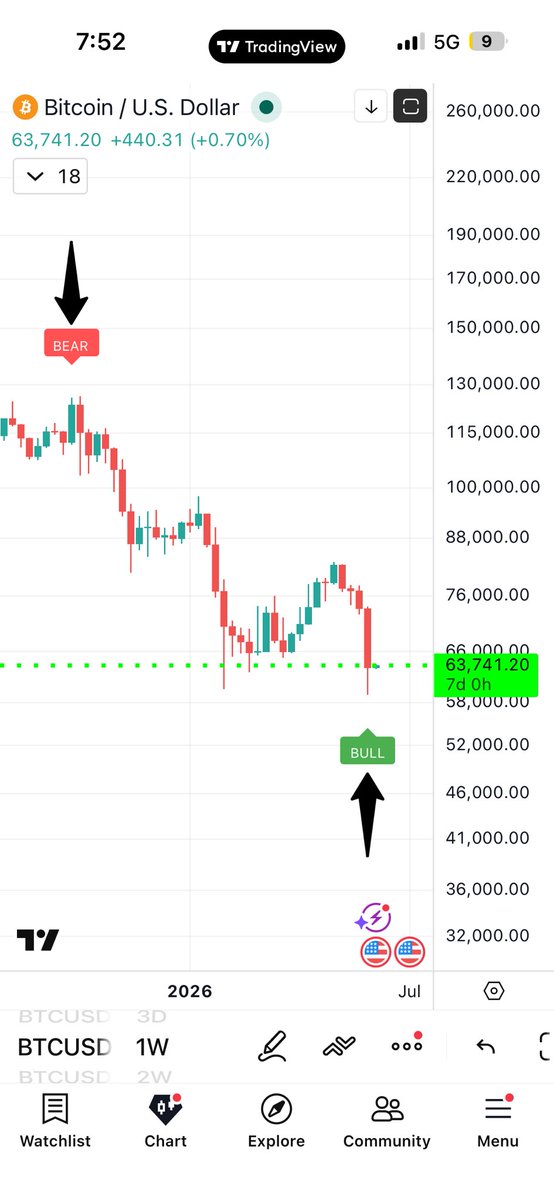
#Bitcoin
Bearish divergence at $126K = Top. 📉
Bullish divergence at $60K = ? 🤔📈
Comment below. 👇🚀₿
1
1
120
Dr. Madhava Reddy retweeted

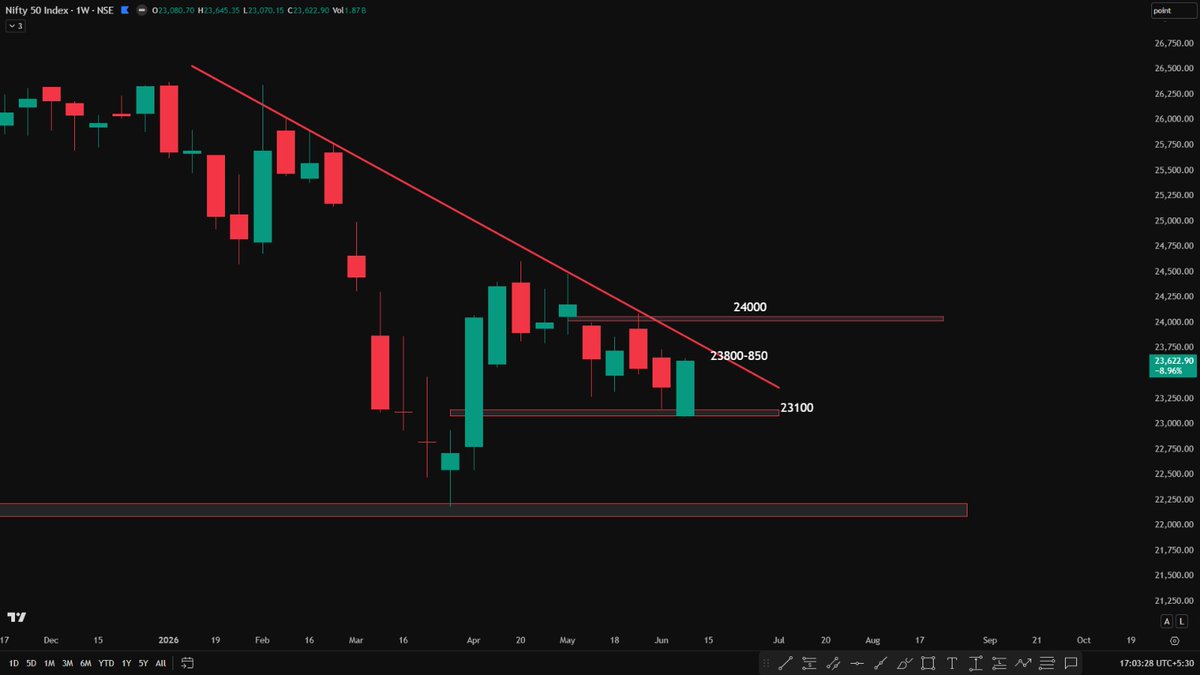
#Nifty
Weekly Timeframe:
The next major resistance zone is 23850-24000 (check the trendline on the chart). The trend will turn decisively bullish only above this zone. Below this, trend is sell on rise only.
Daily Timeframe:
Nifty has broken out of its range and closed strongly above 23500, which should act as support tomorrow.
The next resistance is at 23850. The short-term trend remains bullish as long as Nifty stays above 23500.
For Tomorrow:
If Nifty breaks Friday's high, it can move towards 23850, which is a crucial resistance level for the next bullish leg.
If it fails to break Friday's high, it may remain range bound between 23450–23650.
A break below 23450 could trigger fresh selling pressure again. Levels are marked on the chart.


10
2
54
6,089

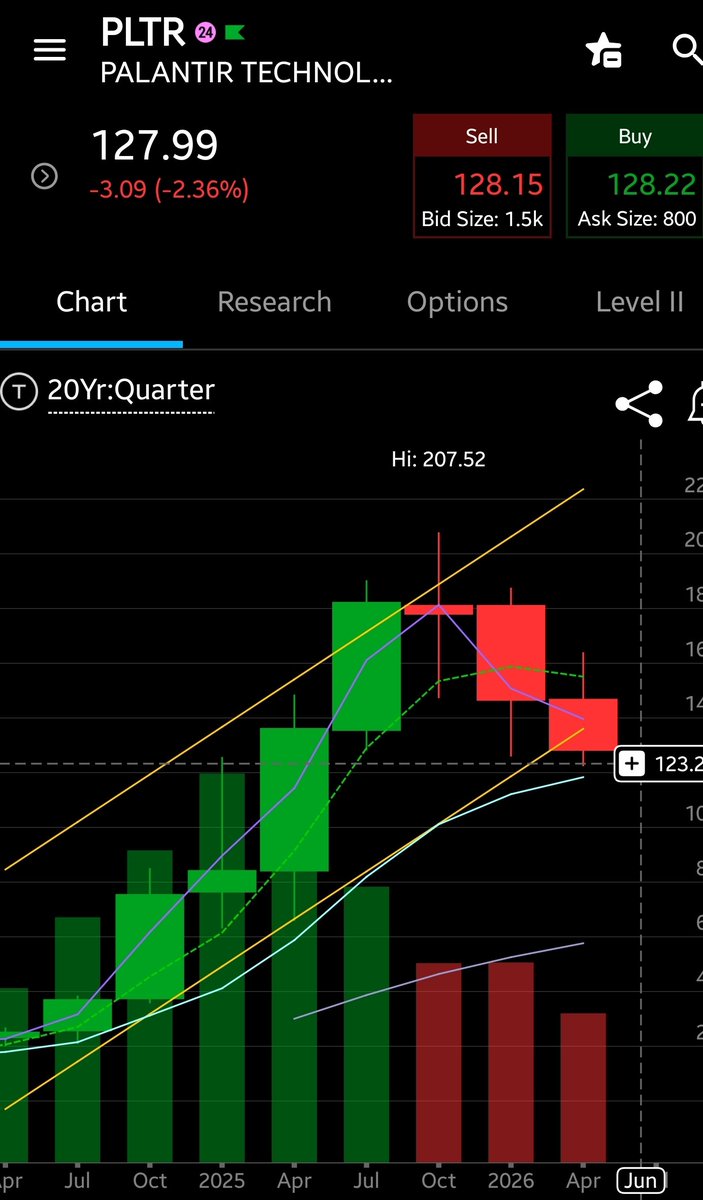
👇💶 Quarterly recovers above lower yellow trendline at $136.03 end of June.
Jun 12

Quarterly view on $PLTR: Long-term breakout intact despite the recent cooldown from $207 highs.
Palantir is executing perfectly — 85% revenue growth in Q1, U.S. commercial 133%, insane margins, and raised FY guidance for 61% growth.
AI demand isn't slowing. Consensus targets $190 with room to $250 .
Buy the dip in the best AI software story out there. Chart fundamentals = bullish AF
11

The Trendline remains your friend for $ETH.
Price continues to respect this line. Even had a liquidity sweep below.
Widespread ALT relief comes on a reclaim of the $2400 level.

3
3
40

TRENDLINE EXPLAINED
New YouTube video on my channel @festusforex #forextrading #trendline #festusforex #strategyanalysis

1
3

$AAPL Trade Idea: June 18th 285P 💡
📉 Trigger: 289.62
🎯 Target: 285.38
🛑 Stop: 291
AAPL closed at 291.13, down 1.52% with another weak close. We broke 305 and 300 over the last week and have been basing in a tight range between 287 and 296 trying to defend. 289.62 is the recent low and the level to defend on the downside. A trendline break under 289.62 opens up continuation into 285.38 next. A reclaim back over 295 stops out the put and starts to look more constructive for a bounce.

1
2
508
Avatarhash retweeted

Couple hours left until the $BTC weekly close, so far we have:
• A diagonal trendline breakout and retest.
• The 200W MA and lower Bollinger Band tested and holding.
• RSI showing a bullish divergence
3
3
39
1,011

31m
$BTC Like I said, bullish momentum, not advisable shorting.
Trendline and daily support broken, price pumped till weekly resistance.
Shorting now, stop loss supertitgh.
Jun 12

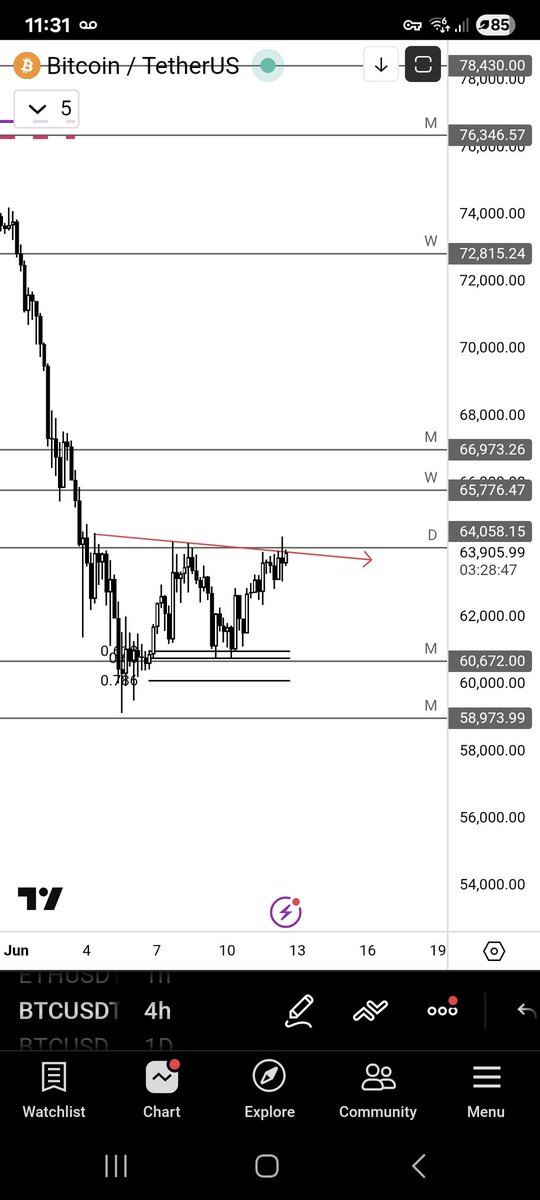
$BTC could be printing an SFP (swing failure pattern) at daily level within the local structure. However, the broader trend is still bullish, and price is holding a daily demand zone.
Ideally, I’d like to see sellers step in more aggressively and take clearer control before considering any bearish continuation.
68

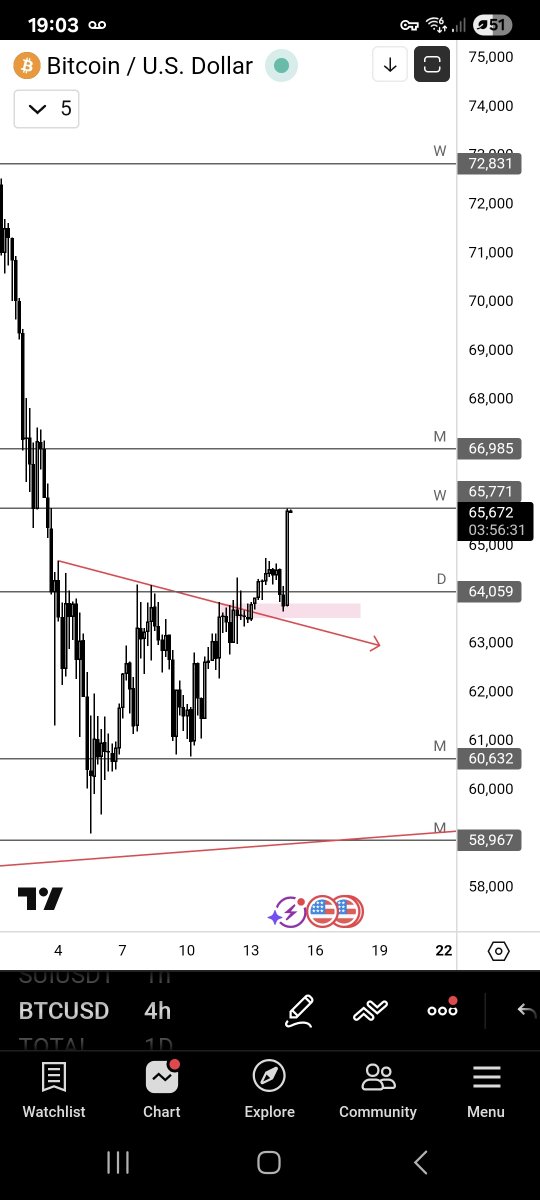
Both trendlines are valid, but they serve different purposes.
Blue Line (1): Macro timeframe structure
Black Line (2): Current active trendline, with more recent touches and stronger market reaction.
For the most accurate short-term read, Line 2 carries more weight

4

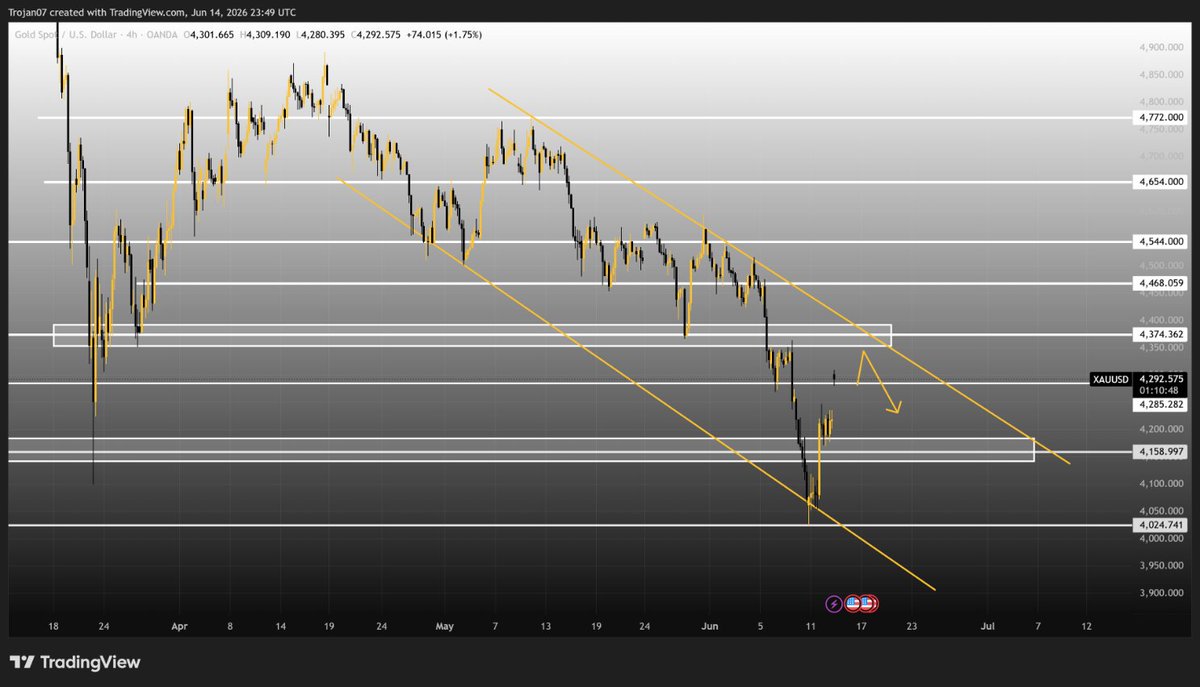
This is my outlook for gold tomorrow.
Market is Overall bearish so I will have to just ride the wave.
Waiting for market to hit the upper trendline which also happens to be my key AOI, and wait to see how the market reacts at that level .
What do y'all think?
12


📐 What’s left on the macro chart.
The 2022 descending trendline break still exists on the weekly chart. But below the weekly EMA, with the mirror pattern invalidated, that break alone carries far less weight.
1
9
kara simmons retweeted

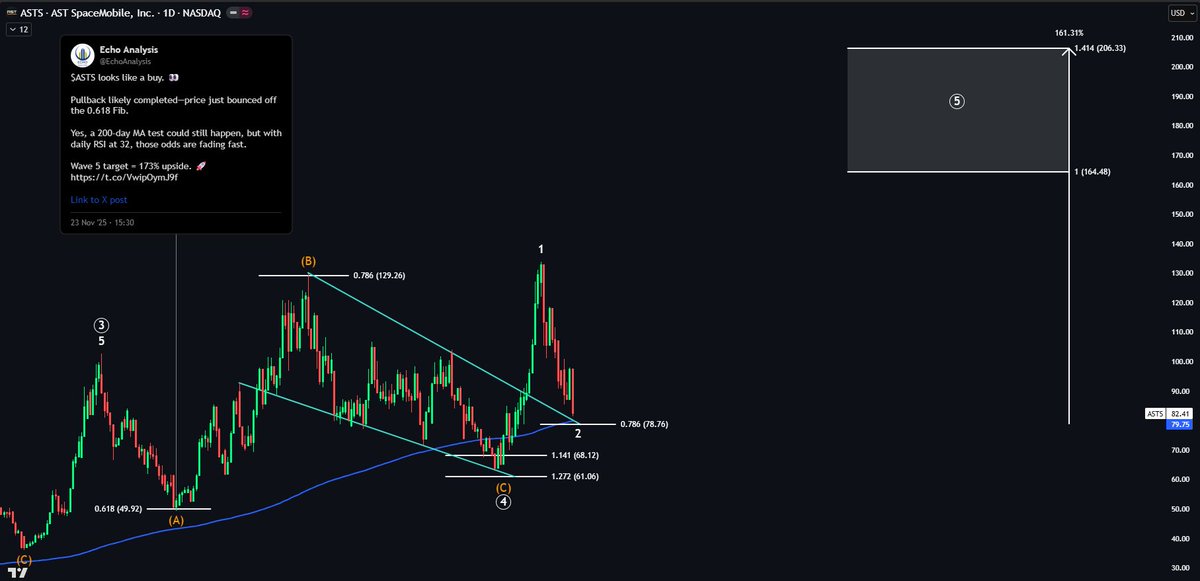
$ASTS Fear creates opportunity 👀
Price is approaching the 200DMA, 0.786 fib and trendline confluence.
Expecting support here before moving up to Wave 5.
Wave 5 target: 161% 🚀
Jun 7

$ASTS I am even more bullish 👀
Price down 12% on Friday but this looks set to be a subwave 2, meaning larger upside ahead.
Price has found some support at the 0.618 fib. Happy adding here and at the 50DMA.
Wave 5 target: 127% 🚀

3
2
42
4,778

$ROP is flirting with a major trendline breakout. This is a classic "quality compounder" setup—Roper’s ability to leverage its vertical software model provides defensive stability, while the technicals are finally signaling that the worst of the consolidation is over. Watching the $370 level closely; if we clear it on volume, the path is wide open to test higher resistance clusters.
🐂 Bull Level: Claim $375.00 to trigger a structural move toward $410.00 .
🐻 Bear Level: $350.00 must hold as the primary floor; a break here invalidates the breakout.
#ROP #RoperTechnologies #Compounder #Software #hovdid

28

In hindsight, it was simply the retest of a trendline I’d been watching all day. Bummer that I didn’t stick to this idea.
Let’s see how this week develops as I still think $BTC going to catch up with its HTF downtrend soon and this is only a corrective move.

28

WTI Oil trading 3.62% lower at $81.24 after the US and Iran confirm they have reached a deal to halt the war and to resume traffic through the Strait of Hormuz as of Friday.
Given the uncertainties around the next round of negotiations over the next 60 days, particular around the nuclear aspect, it’s hard to see crude falling too much further from here immediately. More so as nations use the reopening of the Strait to replenish depleted energy supplies and refill SPRs. Furthermore prices had fallen heavily in recent sessions on renewed expectations of a deal so likely we are seeing some profit taking on shorts - aka "sell the rumour buy the fact."
If crude oil finishes the day much above $82.50ish (above trendline support), it leaves the door open for a rebound back into the mid $90's. Conversely a failure to do so would suggest a deeper pullback into the mid $70's is underway.
#OOTT

1
215
xoptions retweeted

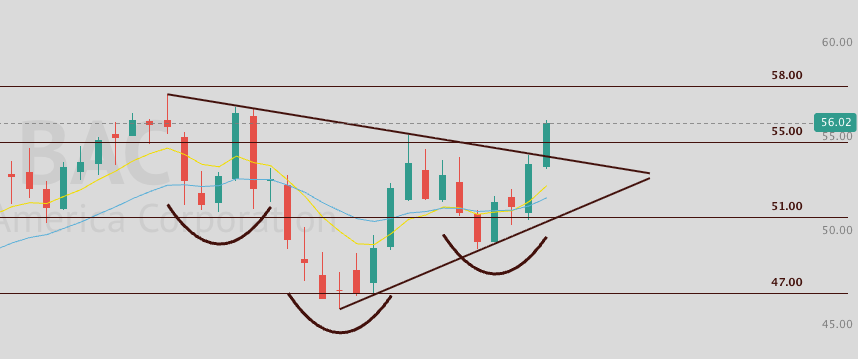
$BAC
Stock is showing a beautiful reversal pattern breaking above the weekly trendline. When you also look at the pattern this is an inverted head and shoulders that is brewing with the measured move of 10 points.
Keep this stock and sector on watch along with $JPM looks like 60 can be targeted here soon If you want a backtest entry here you are looking for a 55-53 level to hold. 58 near term target and 66 as the extended target or a measured move here.
PT: 66 [Add Time]
11
2
39
4,932


HS retweeted

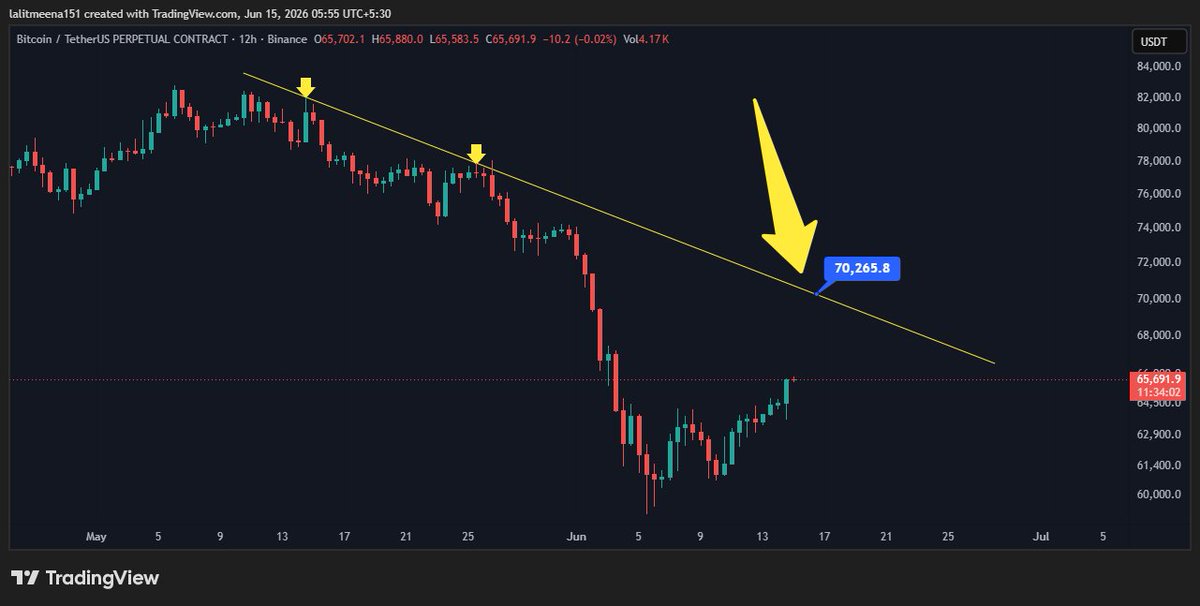
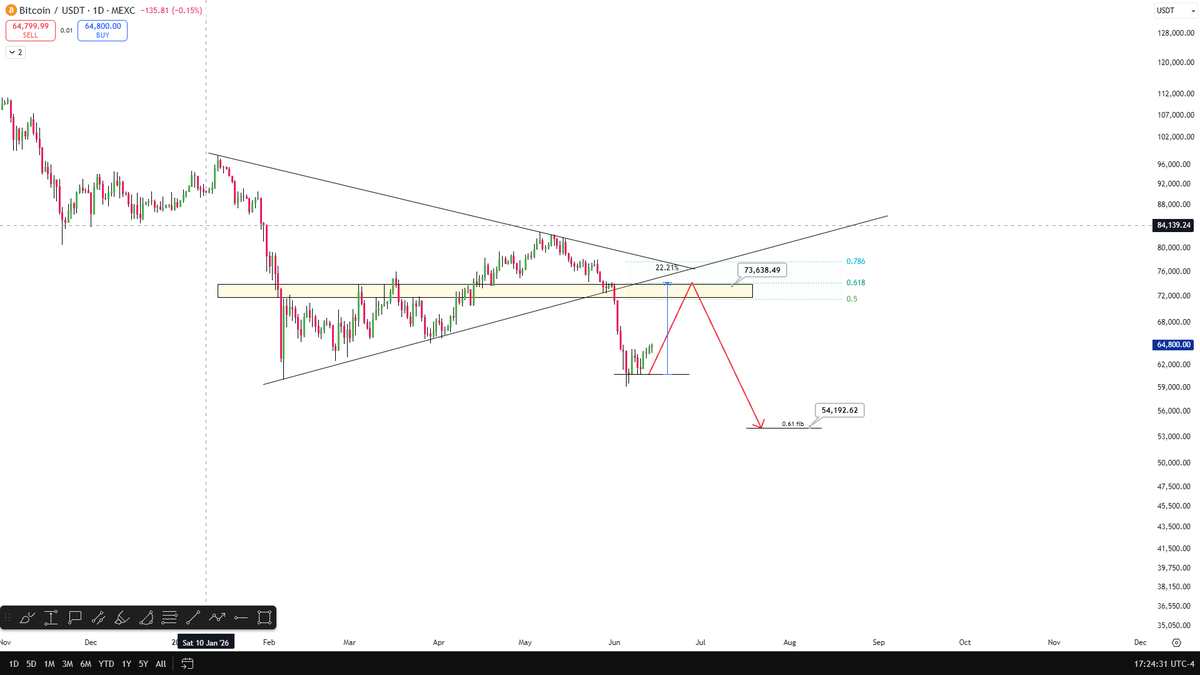
Bitcoin lost its key trendline and the $70K support.
The recent bounce looks corrective.
As long as $BTC remains below resistance, lower prices remain the most likely outcome.
$57.8K first.
$54K next.
22
8
116
7,675