
13 Nov 2018
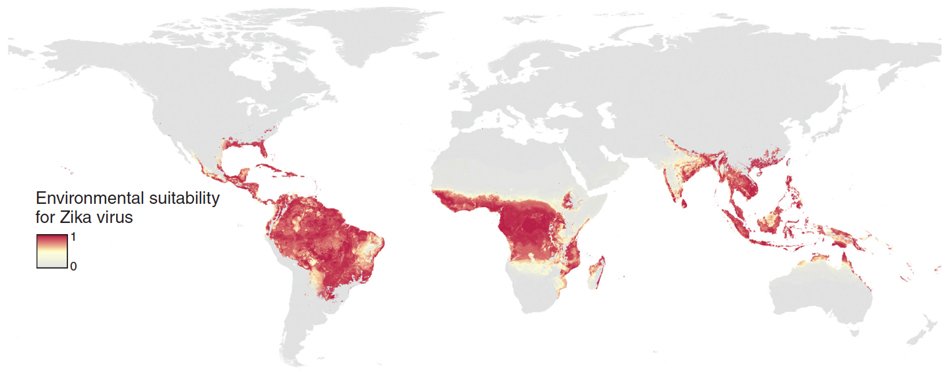
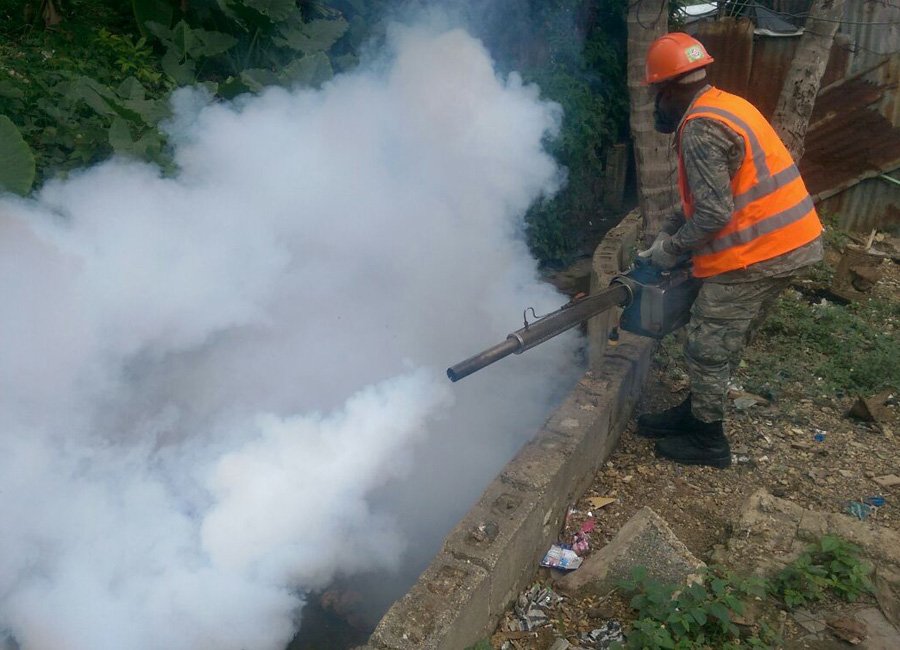
Zika zone: researchers map the environments that foment the spread of #zika to better inform travelers and public health officials.
goo.gl/WRQThM @NASAEarthdata @MOUGK @harvardmed @JaneyMessina @UniofOxford @ciesin #LPDAAC #mosquitoes #MODIS #UseDAACData
1
2
9 Nov 2018
Zika zone: Knowing a mosquito’s terrain may help officials halt the spread of the #zika virus. goo.gl/WRQThM @NASAEarthdata @MOUGK @harvardmed @JaneyMessina @UniofOxford @ciesin #LPDAAC #mosquitoes #MODIS #UseDAACData
5
5
5 Nov 2018
Zika zone: researchers map the environments that foment the spread of #zika to better inform travelers and public health officials.
goo.gl/WRQThM @NASAEarthdata @MOUGK @harvardmed @JaneyMessina @UniofOxford @ciesin #LPDAAC #mosquitoes #MODIS #UseDAACData

9
3
11 Oct 2018
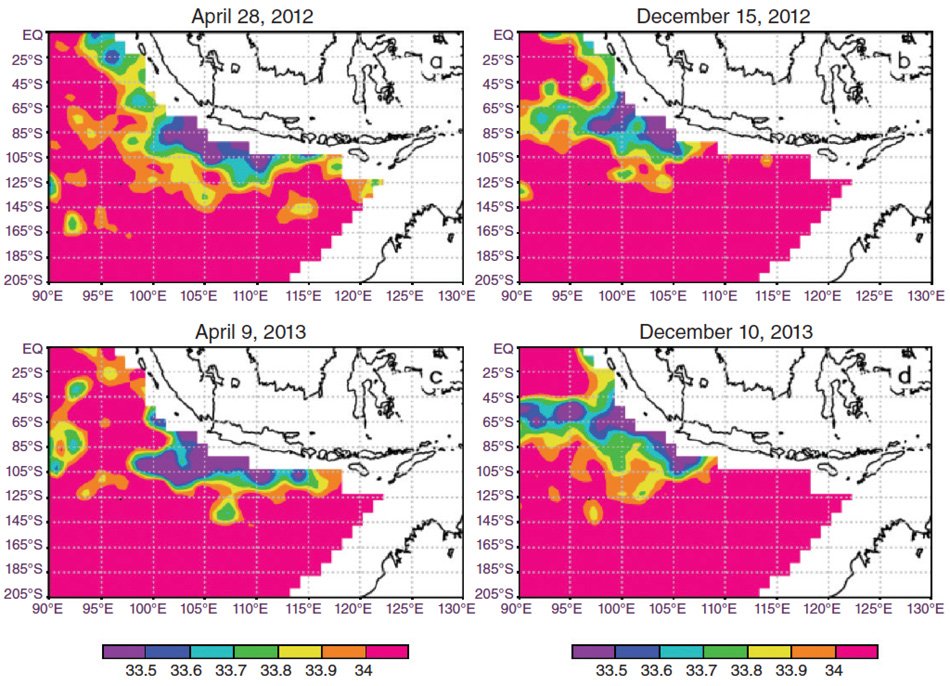
From Indonesia to India: Rain and fresh water are ingredients in the ocean’s everyday water cycle, but the oceans are a pot that is never completely stirred. goo.gl/isM2B1 @podaac @NASAEarthData #UseDAACData #oceans #salinity
3
3 Oct 2018
From Indonesia to India: Rain and fresh water are ingredients in the ocean’s everyday water cycle, but the oceans are a pot that is never completely stirred.
goo.gl/isM2B1 @podaac @NASAEarthData #UseDAACData #oceans #salinity

2
12 Sep 2018
Drought on the range: Long term drought takes a toll on Texas #rangelands, but monitoring soil moisture from satellite might help predict when and where #drought might strike. goo.gl/t6wFqr @NSIDC @NASASMAP #UseDAACData #LPDAAC #soilmoisture

1
2
23 Aug 2018
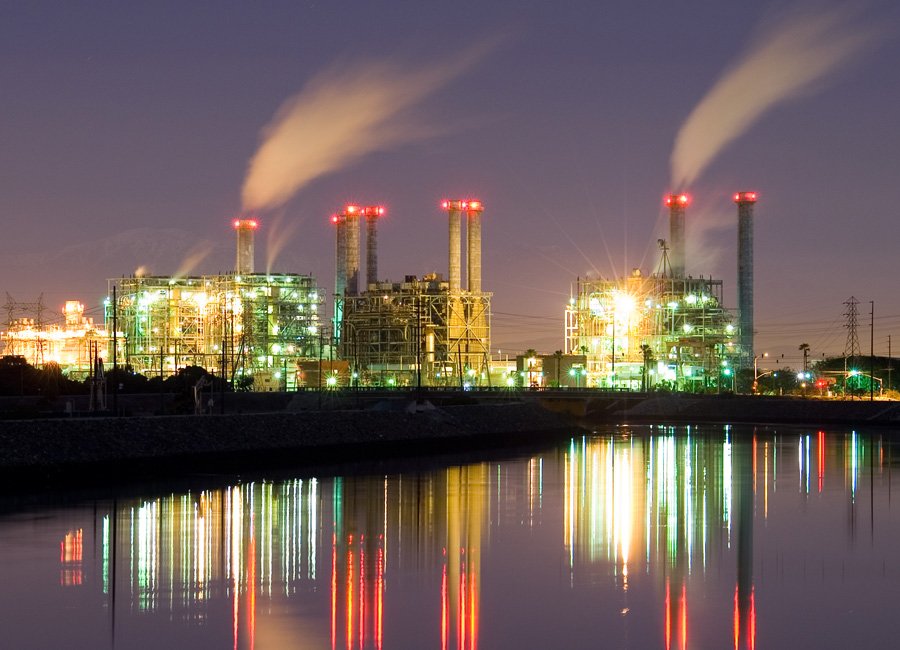
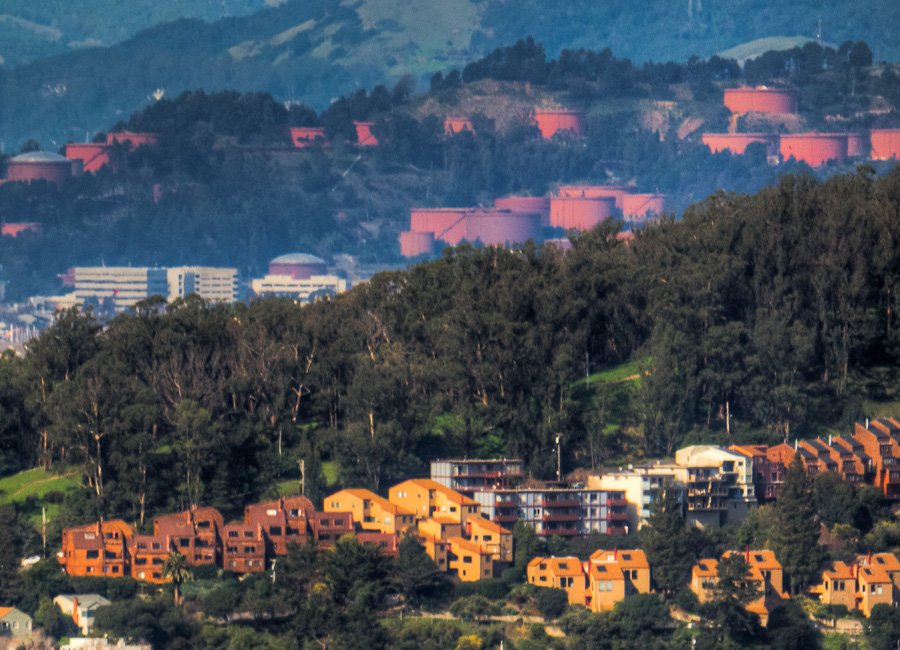
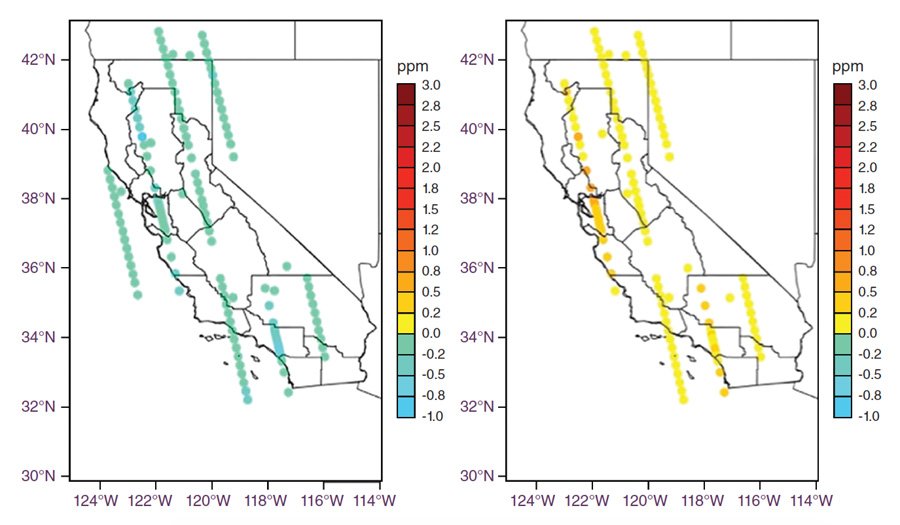
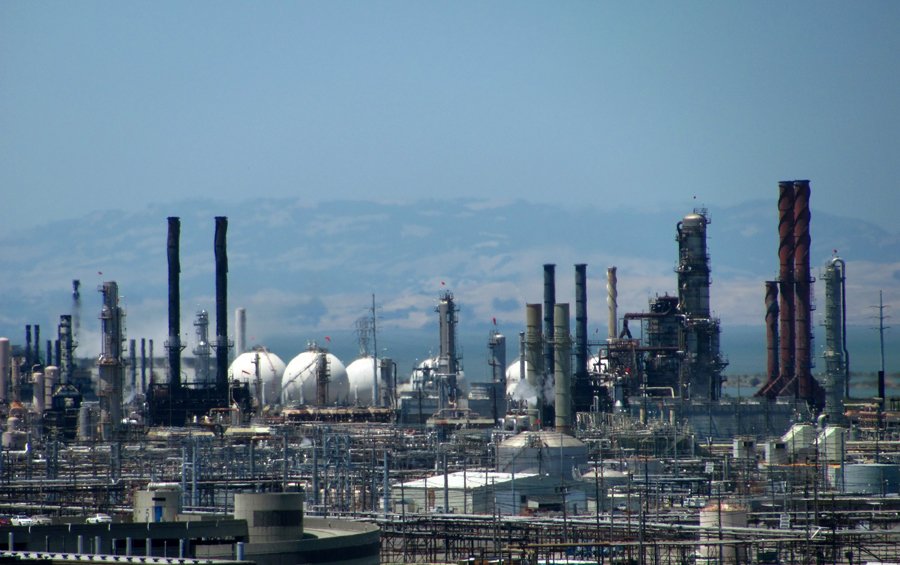
Carbon control: Monitoring air quality in California means tracking where air pollution comes from, how it flows, and how it interacts with the environment. goo.gl/tP15c9 @IamOCO2 @NASAEarthData #UseDAACData #California #airpollution #greenhousegas #NASAOCO2

2
2
21 Aug 2018
Carbon control: Can radiocarbon and satellite data help researchers track California's greenhouse gas emissions? goo.gl/tP15c9 @NASA_GESDISC @ORNLDAAC @ucdavis @BerkeleyLab @IamOCO2 #airpollution #greenhousegas #California #UseDAACData

1
2
17 Aug 2018
Carbon control: Can radiocarbon and satellite data help researchers track California's greenhouse gas emissions? goo.gl/tP15c9 @iamOCO2 @NASAJPL @ORNLDAAC @NASA_GESDISC @ucdavis @BerkeleyLab #UseDAACData #aripollution #California #greenhousegas

5
2
14 Aug 2018
Carbon control: Monitoring air quality in California means tracking where air pollution comes from, how it flows, and how it interacts with the environment. goo.gl/tP15c9 @IamOCO2 #UseDAACData #California #airpollution #NASAOCO2
3
2

#UseDAACData: Effects of Land Cover Change on the Hydrology of an Amazonian Basin buff.ly/2LR3Jg0 via @Water_MDPI Get #data from #LBA_ECO at: buff.ly/2LQOqns
2
12 Jul 2018
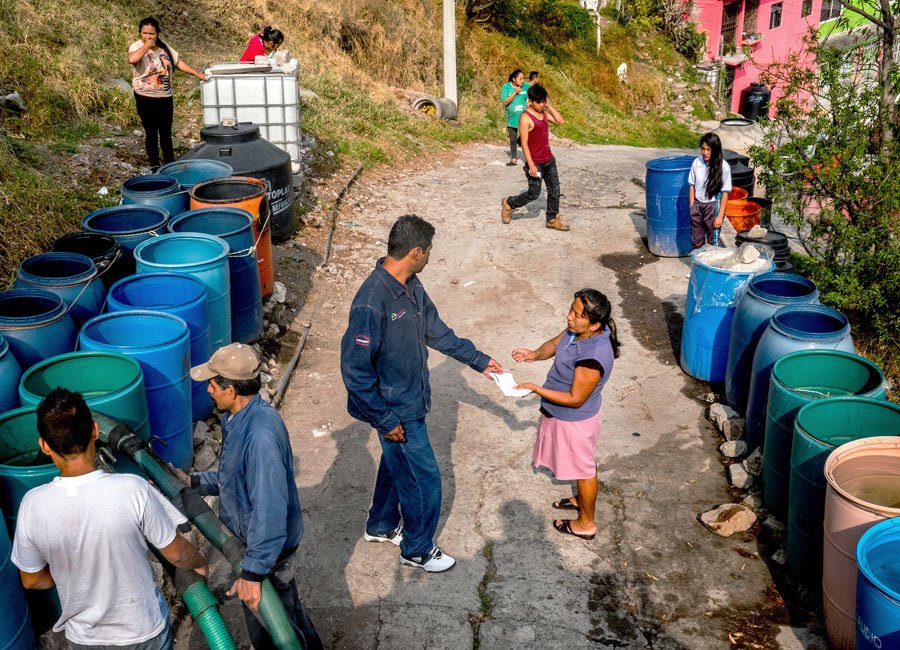
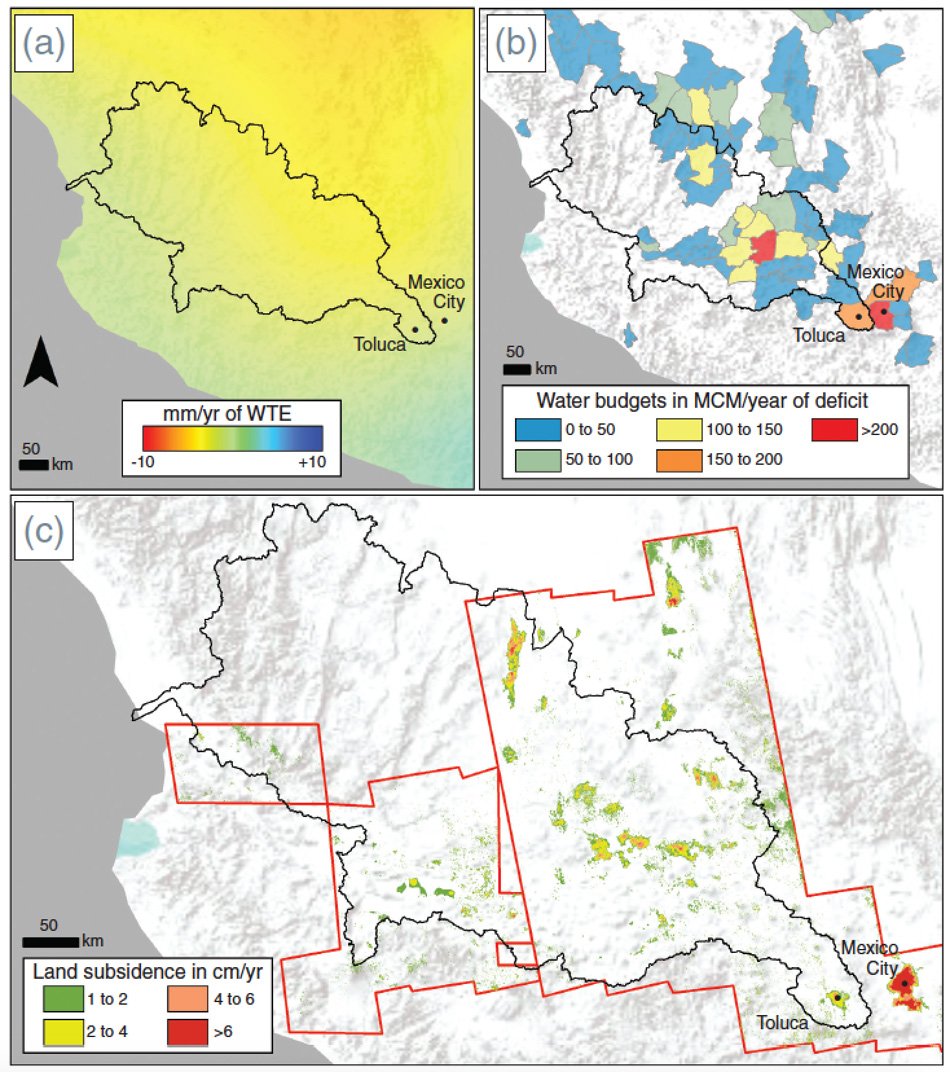
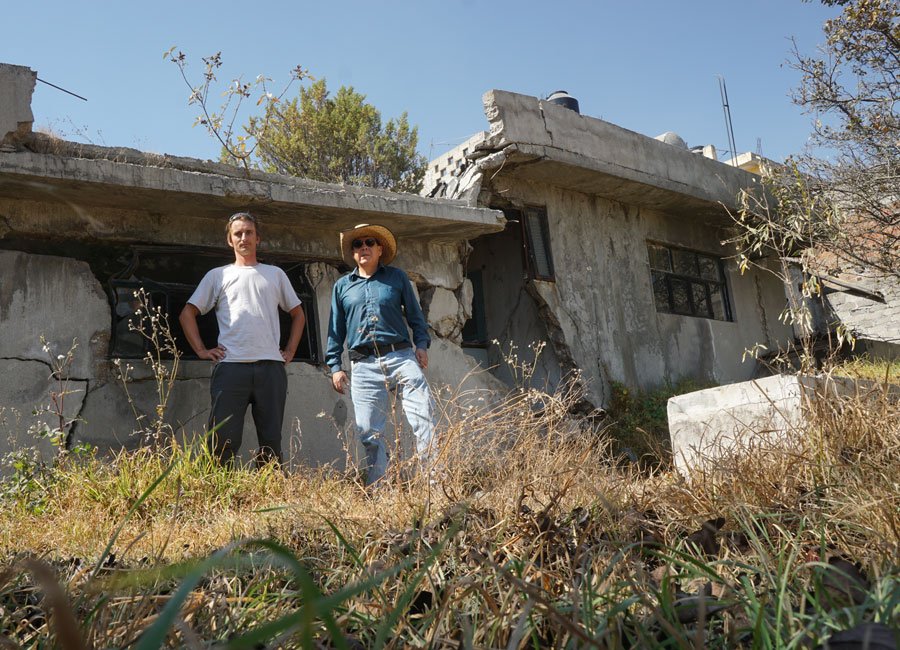
Closed season: In Mexico’s escalating water crisis, mapping groundwater depletion helps researchers get to the bottom of missing groundwater. goo.gl/vYY44c #UseDAACData #Mexico #groundwater #aquifer #ALOS #PALSAR #NASAGRACE #watercrisis

9
6
11 Jul 2018
Closed season: Mapping groundwater depletion in #Mexico helps researchers get to the bottom of missing #groundwater and subsiding land. goo.gl/vYY44c @Ak_Satellite @podaac @NASA_GESDISC @ciesin @JAXA_en @CNRS @UnivRennes1 @NRCan @vizcarran #ALOS #PALSAR #UseDAACData

4
3
10 Jul 2018
Closed season: Groundwater depletion and subsiding aquifers plague many parts of Mexico, so researchers explore where this water is going. goo.gl/vYY44c @NASAEarthData #groundwater #Mexico #aquifers #watercrisis #ALOS #PALSAR #UseDAACData
1
1
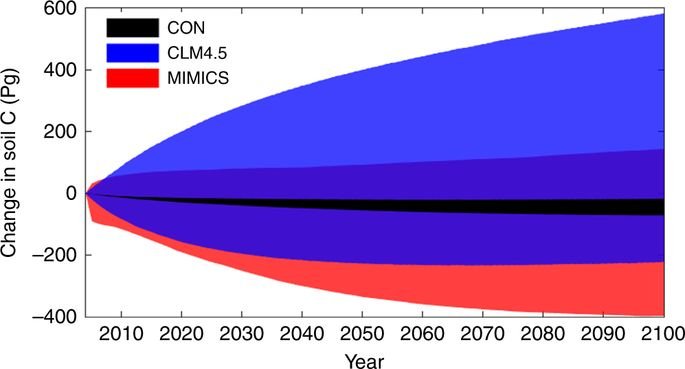
#UseDAACData: Model structures amplify uncertainty in predicted soil carbon responses to climate change @NatureComms #soil
buff.ly/2JC29O3
Soil data @ORNLDAAC: buff.ly/2JALWZz
2
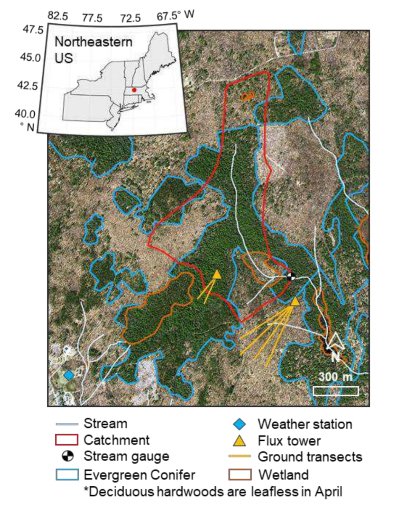
#UseDAACData: A new paper discusses warming-induced earlier greenup and reduced stream discharge in temperate mixed forest catchment @AGU
buff.ly/2Hj3bfZ
Data: buff.ly/2J9SNwU
3
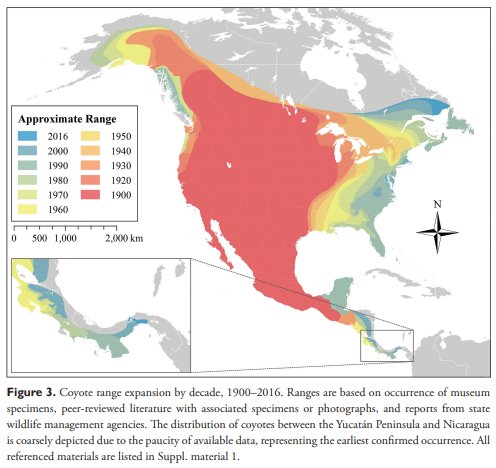
#UseDAACData: Paper: Mapping the expansion of coyotes across North & Central America #wildlife #coyotes @NASA_Earthdata #ISLSCP_II
buff.ly/2sEsOma
Data: buff.ly/2kLm5mJ
2
5
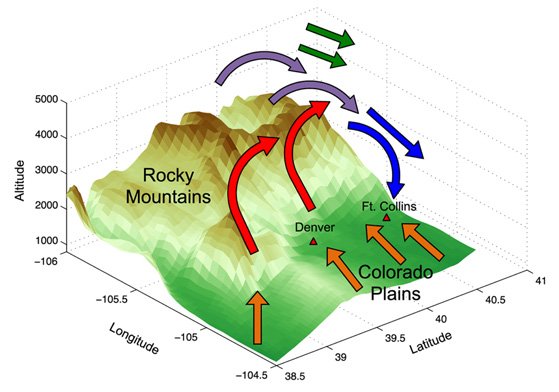
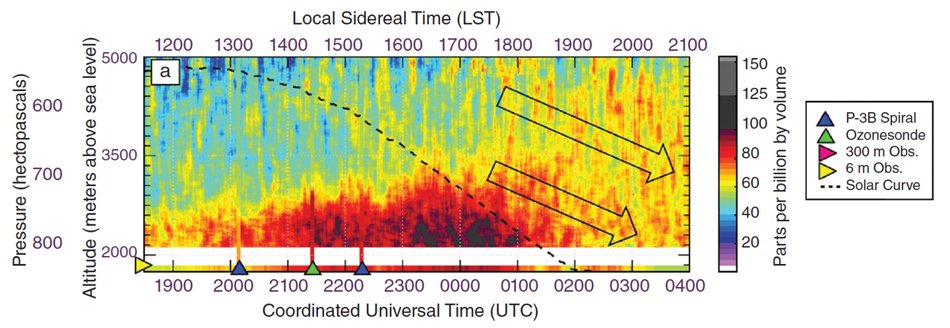
4 Jun 2018
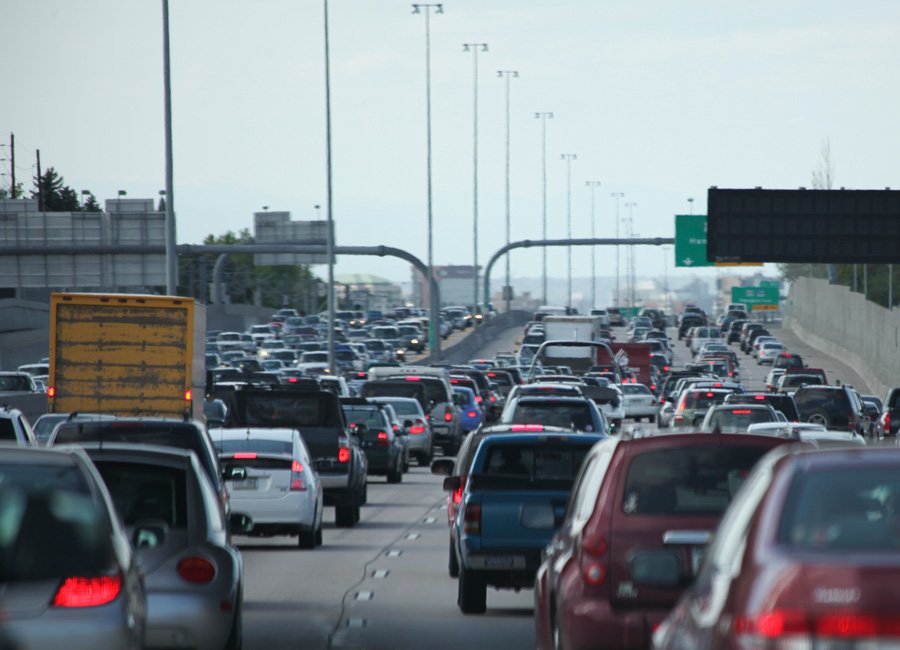
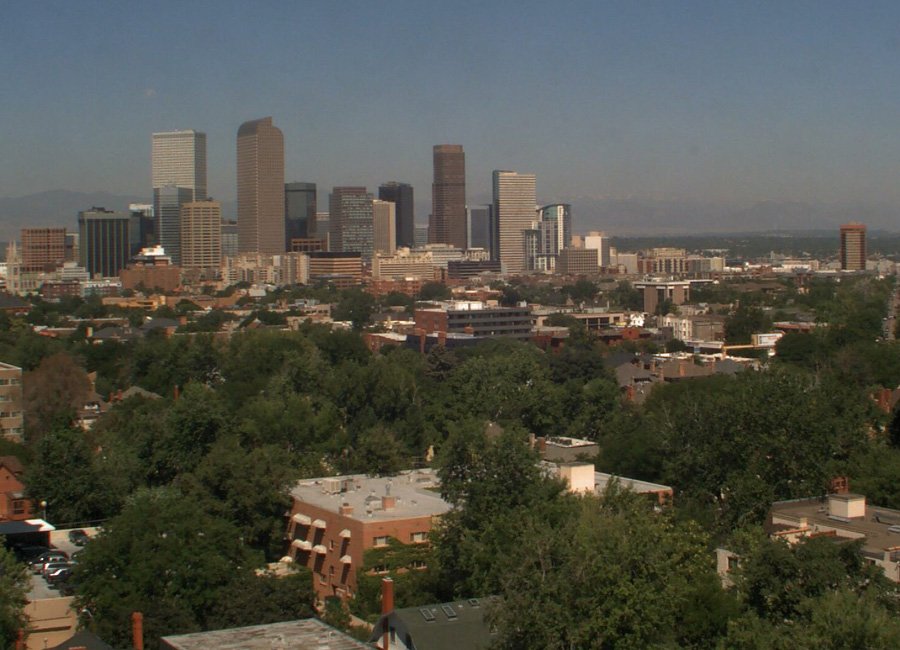
A rising problem: High background levels of ozone make it hard for cities like Denver, Colorado, to meet air quality standards. Why does ozone remain so hard to control? goo.gl/gVvdu6 @NASA_Langley @NASAEarthData @lknaranjo #UseDAACData #airpollution #airquality #ozone
10
8
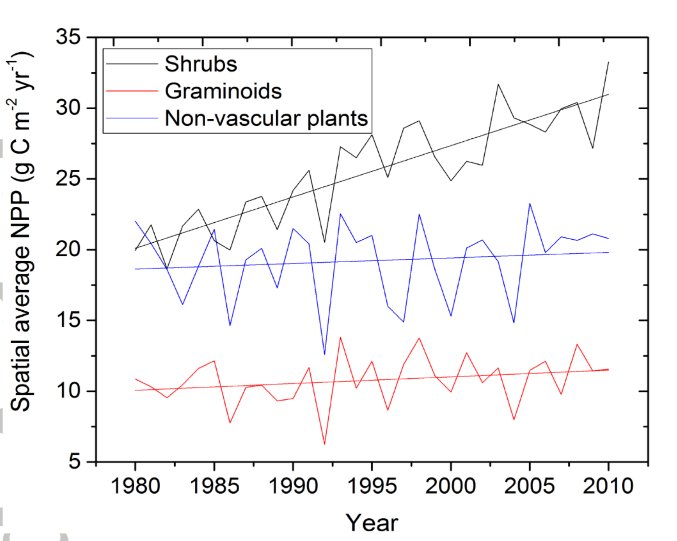
#UseDAACData: 21st century shrub expansion in NA Arctic tundra. Paper here: buff.ly/2rWIGR8
Get the data: buff.ly/2GCLis3 #NGEE
2
3
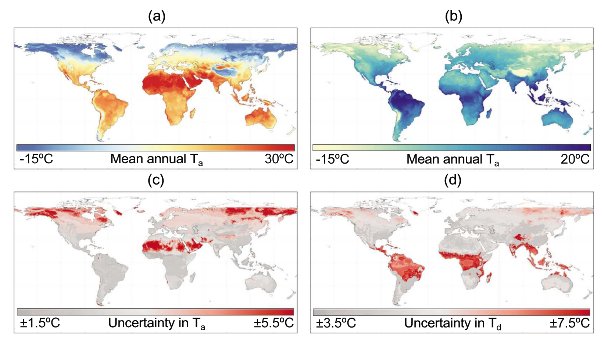
#UseDAACData: Global Validation of MODIS Near-Surface Air and Dew Point Temperatures @theAGU
buff.ly/2jVzicn
Data: buff.ly/2Ijhfrb
2
8