
Mar 6
You don’t need advanced SQL to solve most business problems.
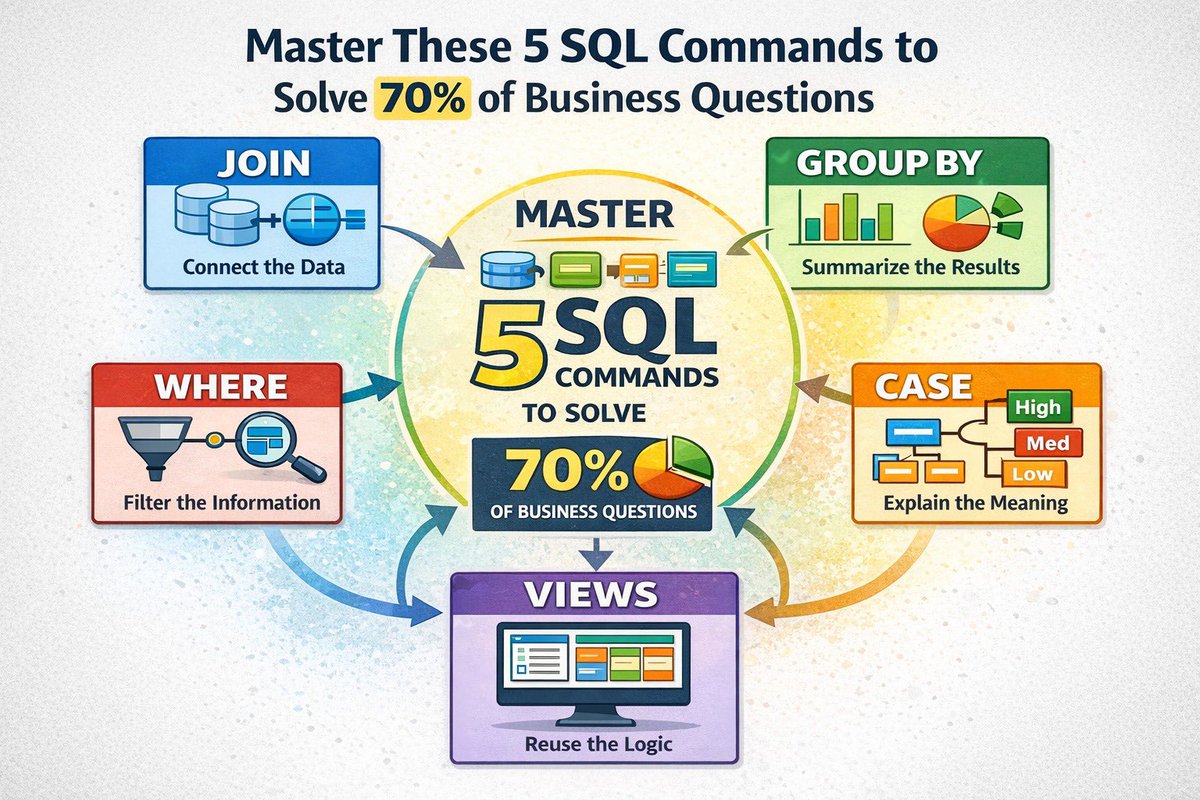
Master these 5 commands and you’ll answer 70% of them.
JOIN
GROUP BY
WHERE
CASE
VIEWS
When I first started writing SQL, I assumed analytics was about complex queries.
Nested subqueries.
Window functions.
Advanced tricks.
But after working on real business reporting, I realized something surprising.
Most insights don’t come from advanced syntax.
They come from mastering five core pillars that power almost every real-world report.
Let’s break them down.
🔗JOIN: Connecting the dots
Business data never lives in one table.
Customers
Transactions
Products
Regions
They are all stored separately.
If you can’t JOIN tables, you can’t tell the full story.
Example:
A retail company wants to know their top customers by total sales.
Customer details live in one table.
Sales transactions live in another.
SELECT Cus.CustomerName, SUM(Sal.SalesAmount) AS TotalSales
FROM Sales Sal
JOIN Customers Cus
ON Sal.CustomerID = Cus.CustomerID
GROUP BY Cus.CustomerName
ORDER BY TotalSales DESC
JOIN is what transforms fragmented data into meaningful business insight.
📊GROUP BY: Turning transactions into decisions
Executives don’t care about millions of rows.
They care about summaries.
Questions like:
• How much did we sell per region?
• Which product category performs best?
• What does monthly revenue look like?
That’s what GROUP BY delivers.
SELECT Region, MONTH(OrderDate) AS Month, SUM(SalesAmount) AS TotalSales
FROM Sales
GROUP BY Region, MONTH(OrderDate)
ORDER BY Region, Month
GROUP BY converts raw activity into metrics people can act on.
🚪WHERE: The gatekeeper
Every dataset contains noise
You rarely want everything
You want the right slice of data
WHERE acts like a filter that decides what actually enters your analysis.
Example:
“Show me paid invoices from last quarter.”
SELECT *
FROM Invoices
WHERE PaymentStatus = 'Paid'
AND InvoiceDate BETWEEN '2025-07-01' AND '2025-09-30'
Without WHERE, reports become cluttered and misleading.
🏷CASE: Translating data into business meaning
Numbers alone rarely tell the full story
Businesses often need classification and interpretation
Instead of raw numbers, leaders want categories like:
High Value Customers
Medium Value Customers
Low Value Customers
That’s where CASE becomes powerful.
SELECT
CustomerName,
SUM(SalesAmount) AS TotalSales,
CASE
WHEN SUM(SalesAmount) >= 100000 THEN 'High Value'
WHEN SUM(SalesAmount) >= 50000 THEN 'Medium Value'
ELSE 'Low Value'
END AS CustomerSegment
FROM Sales
GROUP BY CustomerName
CASE helps translate raw data into business language decision-makers understand.
🧱 VIEWS: The reusable blueprint
As projects grow, analysts repeat the same logic again and again.
Joining the same tables
Filtering the same data
Building the same summaries
Views solve this
A VIEW is a saved query that behaves like a virtual table.
CREATE VIEW v_SalesSummary AS
SELECT Cus.Region, Prod.Category, SUM(Sal.SalesAmount) AS TotalSales
FROM Sales Sal
JOIN Customers Cus ON Sal.CustomerID = Cus.CustomerID
JOIN Products Prod ON Sal.ProductID = Prod.ProductID
GROUP BY Cus.Region, Prod.Category
Now analysts can simply run:
SELECT * FROM v_SalesSummary
WHERE Region = 'West'
Views help:
• standardize business logic
• reduce repeated heavy joins across reports
• improve consistency across dashboards
In some systems, it can even store precomputed results and improve performance for large datasets
So in simple terms:
- JOIN connects the data
- WHERE filters it
- GROUP BY summarises it
- CASE explains what it actually means
- VIEWS help scale and reuse the logic
Most broken reports trace back to one of these being misunderstood
Without JOIN
data stays fragmented
Without GROUP BY
reports become unreadable
Without WHERE
analysis becomes irrelevant
Without CASE
data lacks business meaning
Without VIEWS
logic becomes inconsistent.
Master these five, and SQL suddenly becomes much simpler.

2
7
26
1,428


𝗦𝘂𝗯𝗾𝘂𝗲𝗿𝗶𝗲𝘀 𝘃𝘀 𝗖𝗧𝗘𝘀.
As an analyst, you’ll use both. But knowing WHEN to use each one matters.
Let me break it down.
𝗦𝘂𝗯𝗾𝘂𝗲𝗿𝘆:
A query nested inside another query.
SELECT CustomerName, TotalSpent
FROM Customers
WHERE TotalSpent > (
SELECT AVG(TotalSpent)
FROM Customers
)
𝗖𝗧𝗘 (𝗖𝗼𝗺𝗺𝗼𝗻 𝗧𝗮𝗯𝗹𝗲 𝗘𝘅𝗽𝗿𝗲𝘀𝘀𝗶𝗼𝗻):
A temporary named result set you define at the top of your query.
WITH AvgSpend AS (
SELECT AVG(TotalSpent) AS AvgAmount
FROM Customers
)
SELECT CustomerName, TotalSpent
FROM Customers
WHERE TotalSpent > (SELECT AvgAmount FROM AvgSpend)
Both do the same thing. But they’re not interchangeable.
𝗪𝗵𝗲𝗻 𝘁𝗼 𝘂𝘀𝗲 𝗦𝘂𝗯𝗾𝘂𝗲𝗿𝗶𝗲𝘀:
→ Quick, one-off calculations
→ Simple filtering (WHERE or HAVING clauses)
→ When you only need the logic once
→ Short queries where clarity isn’t an issue
Example: “Show me customers who spent more than average.”
𝗪𝗵𝗲𝗻 𝘁𝗼 𝘂𝘀𝗲 𝗖𝗧𝗘𝘀:
→ Complex multi-step logic
→ When you need to reference the same calculation multiple times
→ Readability matters (someone else will read this)
→ Building layered analysis (Step 1 → Step 2 → Step 3)
Example: RFM segmentation.
Calculate customer metrics → Assign tiers → Segment based on tiers.
That’s 3 layers of logic. CTEs let you chain them cleanly.
𝗧𝗵𝗲 𝗯𝗶𝗴𝗴𝗲𝘀𝘁 𝗲𝗱𝗴𝗲 𝗖𝗧𝗘𝘀 𝗵𝗮𝘃𝗲: 𝗖𝗵𝗮𝗶𝗻𝗶𝗻𝗴.
With subqueries, nested logic gets messy fast. You’re wrapping queries inside queries inside queries.
With CTEs, you build in steps:
WITH CustomerMetrics AS (
-- Step 1: Calculate metrics
),
CustomerTiers AS (
-- Step 2: Assign tiers using CustomerMetrics
),
CustomerSegment AS (
-- Step 3: Segment using CustomerTiers
)
SELECT * FROM CustomerSegment
Each CTE references the one before it. Clean. Readable. Modular.
Try doing that with subqueries. You’ll hate your life.
𝗥𝘂𝗹𝗲 𝗼𝗳 𝘁𝗵𝘂𝗺𝗯:
→ If your query has more than 2 levels of logic, use a CTE.
→ If you’re repeating the same subquery, use a CTE.
→ If someone else will read your code, use a CTE.
→ If you need to chain multiple steps, CTEs are non-negotiable.
Subqueries are fine for quick answers. CTEs are for analysis you’ll actually use.
Which one do you prefer?
#SQL #DataAnalysis #Datafam #SQLTips

12
50
397
16,602

22 Oct 2024
Interesting to see Revolut's potential India entry while all sorts of Fintechs are already dime-a-dozen here and competing with each other aggressively.
The specific part that is interesting is their focus: "Given India’s low GDP per capita, the realistic size of Revolut’s market in the country was 'pretty much' the top 10 to 15 per cent of its 1.4bn population, 'which is sizeable'. That’s the segment that also consumes Netflix, that consumes your Apple products… that travels and travels internationally as well - the global India. They have friends and family overseas, they’ve probably studied overseas, worked overseas and come back or vice versa".
#fintech #marketing #customersegment #targetaudience #digital

4
3
8
2,335

23 Feb 2024
It's essentially a rebuild of the Script editor. I agree it would be valuable as you'd have competition!
I think Shopify want to push for an ecosystem, instead of providing these things natively, which would possibly be 'side quests'? Was the old script editor too heavy on support?
They have a great UI in ShopifyQL and the CustomerSegment editor, which I had originally tried to replicate (not so easy).
I'd also argue they could of built some form of PP upsells/blocks natively, but decided not to.
You can see some movement in the new 'FunctionSettings' admin UI component for cart/checkout validations.
Maybe it's politics? Maybe it's money? Maybe it's resource? Perhaps part of a strategy? Perhaps they're about to release a Scripts editor v2?
2
2
188

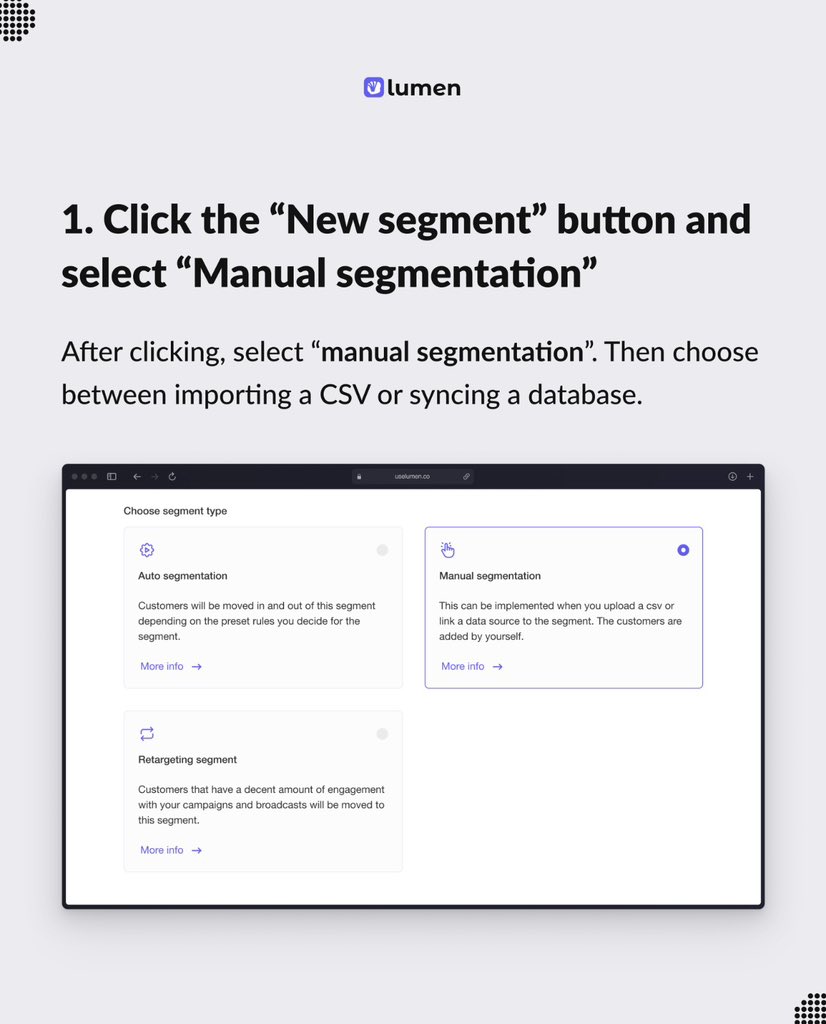
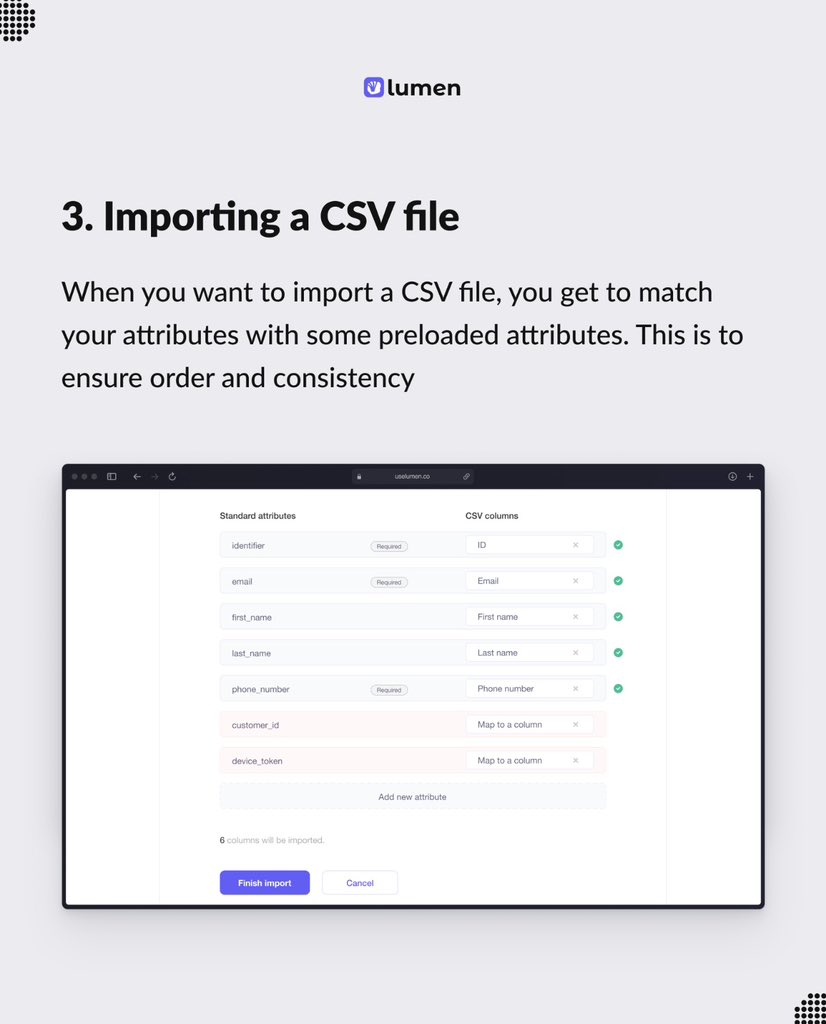
Got an existing email list and CSV?
You can create a manual segment and reaching out to your customers at the click of a button.
Get started today on uselumen.co
#emaillist #uselumen #customersegment


1
4
6
152

7 Jul 2023
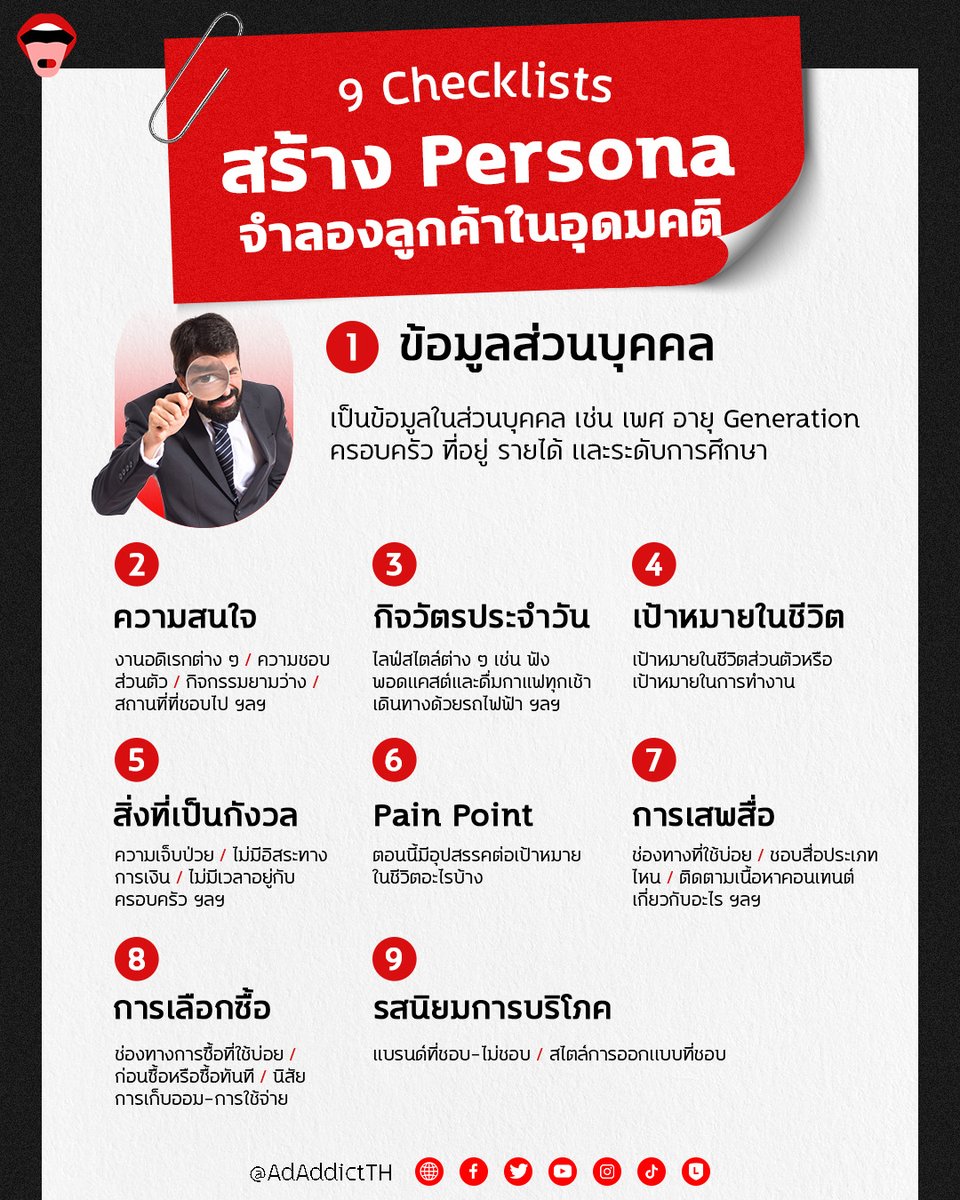
9 Checklists สร้าง Persona จำลองลูกค้าในอุดมคติ จะคิดโปรฯ ก็ง่าย จะทำยอดขายก็พุ่ง !
อ่านความรู้แบบบเต็ม ๆ ได้ที่ : bit.ly/3NEwxJE
#ADADDICT #knowledge #CustomerSegment #Pesona #Customer
1
5
1
227

3 Aug 2022
เข้าถึงกลุ่มเป้าหมายพลังซื้อตัวจริง ด้วย Audience Segment จาก The 1 for Business marketingoops.com/news/biz-n…
#The1
#The1forBusiness
#CustomerSegment
#MarketingOops
2
4

5 Apr 2022
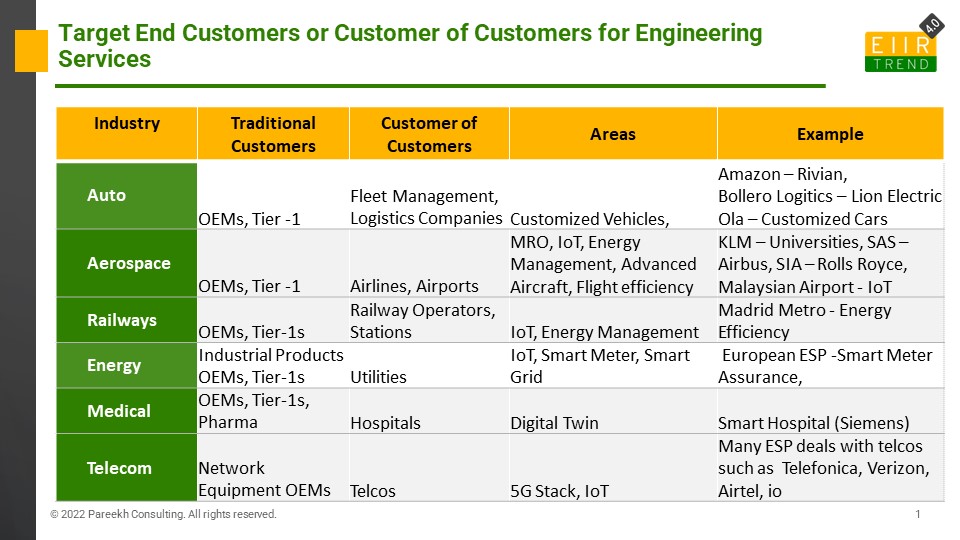
Targeting End Customers: Engineering Service Providers’ Growth Strategy
Our PoV: lnkd.in/gHNJmHBC
#EIIRTrend #engineering #strategy #customersegment #growth
13
274

12 Mar 2022
16) shout out to your clients and other related #brands and #startups
17) Ask clients how they found you out
18) post a fill in the blank
19) talk about common mistakes people in your #customersegment make
20) share favorite sources of your content
4
3

11 Mar 2022
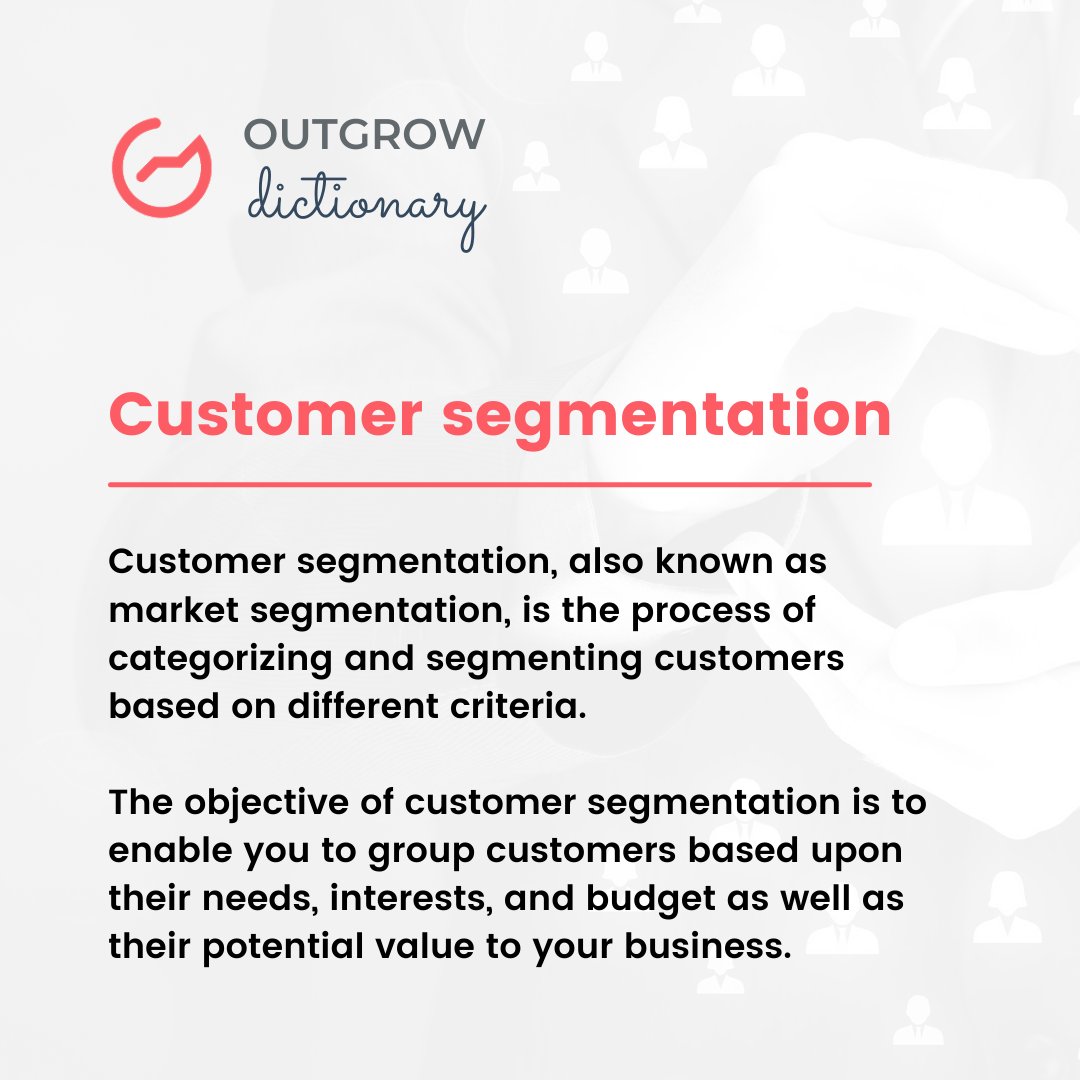
Sending targeted and useful information to your customers can improve their experience. Segmenting customer contact information can help you do this.
#customersegment #customersegmentation #segmentation #customers #audiencesegmentation
2
4

28 Feb 2022
Thank you @Ship2BFound for helping us with the validation of our #CustomerSegment and #ValueProp. We definitely learnt a lot with you. Let’s keep growing 🚀
1
2

5 Nov 2021
Today we had a lecture about the #customersegment of our #business model. This part involves us identifying our stakeholder and how we should market our #product towards them. #PeoriaMET #PeoriaMETEng

28 Aug 2020
#BizConcept #CustomerSegment
#BizTweak
For your Township based enterprise, do you have a profile of your ideal customer?
43%
Yes, Pretty 100% Sure!
14%
Not Yet.
43%
We are doing research
7 votes • Final results
3

WATCH the VIDEO on BinaPavo's YouTube:
youtu.be/oBClvAS0onI
#BusinessModelCanvas #BMC #Leadership #ValueProposition #Customer #Finance #CustomerSegment #Revenue #Cost #Marketing #BinaPavo #Lspace #TheLearningSpace #ThinkBig #Series #Webinars #ADFIM
2

18 Jun 2020
WATCH the VIDEO on BinaPavo's YouTube:
youtu.be/oBClvAS0onI
#BusinessModelCanvas #BMC #Leadership #ValueProposition #Customer #Finance #CustomerSegment #Revenue #Cost #Marketing #BinaPavo #Lspace #TheLearningSpace #ThinkBig #Series #Webinars #ADFIM
1

17 Apr 2020
Don't lump people into the same #customersegment based on income alone. Look deeper, understand their differences, give them what they really need. #customerexperience #DataAnalytics blastpoint.co/blog/a-tale-of…
2
3

11 Dec 2019
In the process of releasing a new #Product to a new #Customersegment or planning to cross-sell an existing product to existing customer groups? Make use of this important metric to break down the numbers into manageable levels. Read more to find out. spanglobalservices.com/blog/…
1

31 Aug 2019
Talking about the #threeleadingprinciples in sales, he said - "#Sales is not a #job. It is not about money. It is not targeted at a #customersegment. Sales is a #lifeskill and we are selling one of the three things all the time - #product, #service or an #idea."
1
7

7 Jan 2019
Why wait?💀Did you know that we build #SalesLists? We identify your #CustomerSegment then find & #compile the #data. #DigitalOrigin is ready to help! Are you ready? #WebDesign #DigitalMarketing #SEO #SEM #PPC #EDDM #BizDev #Wordpress #WooCommerce #Linux #SalesTips 😎
1
2