

Jun 10
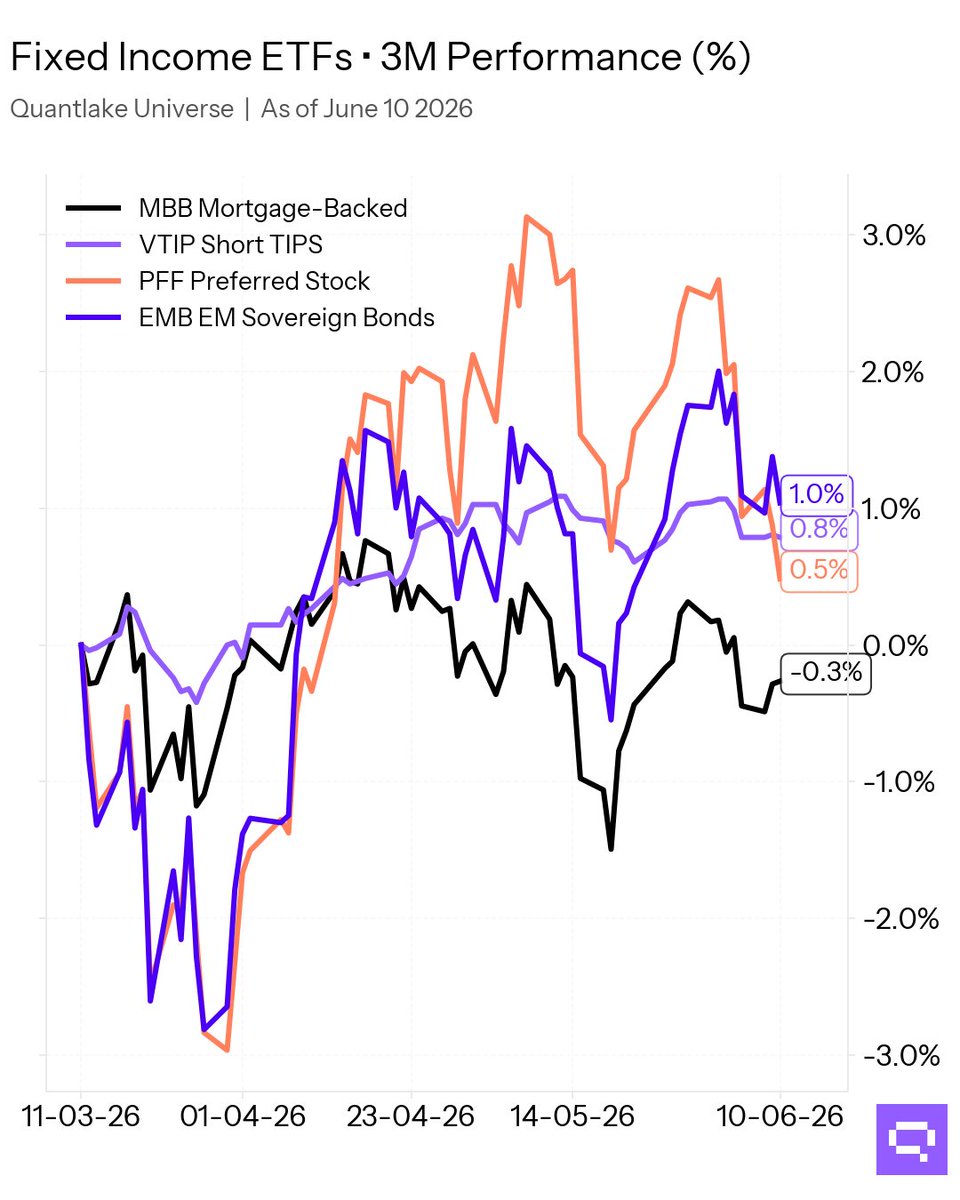
Income and EM credit lag fixed income while mortgages hold firmer on a muted day.
► Today's Movers
Outperformers: Mortgage-Backed $MBB 0.02% (3M: -0.3%), Short TIPS $VTIP -0.02% (3M: 0.8%)
Underperformers: Preferred Stock $PFF -0.39% (3M: 0.5%), EM Sovereign Bonds $EMB -0.33% (3M: 1.0%)
► 3M Leaderboard
Strong: High Yield Bonds $JNK 1.1%, EM Sovereign Bonds $EMB 1.0%, High Yield $HYG 1.0%
Weak: Long Treasuries $TLT -1.5%, 7-10yr Treasuries $IEF -1.4%, Int. Treasuries $VGIT -1.1%
► Signals to Monitor
• Volatility Compression: $BNDX, $LQD
#MortgageBacked #ShortTIPS #PreferredStock
1
23

Jun 5
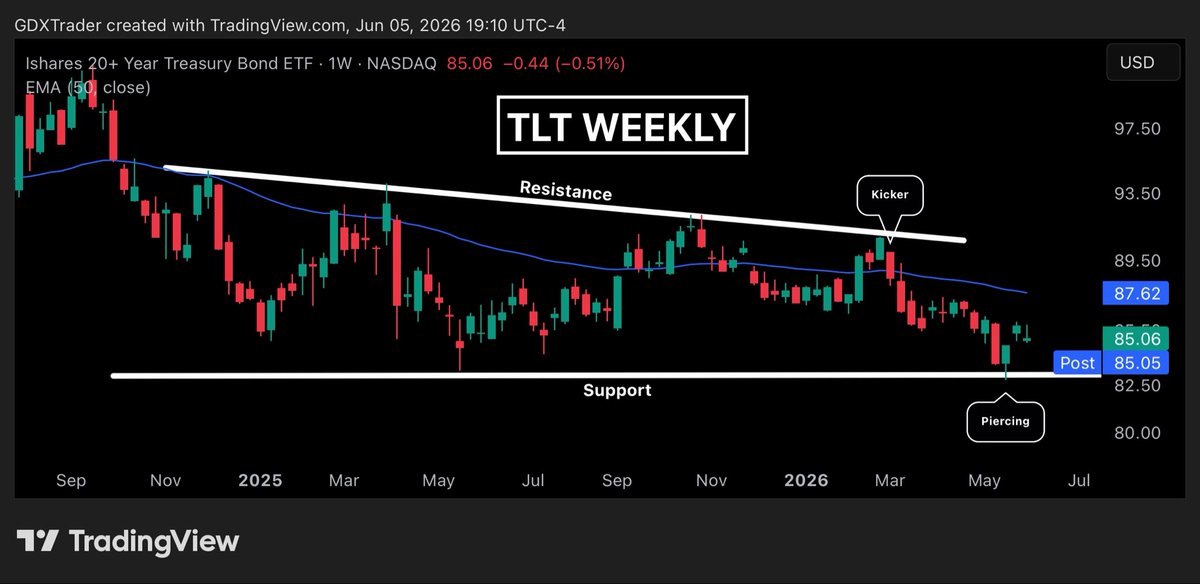
$TLT
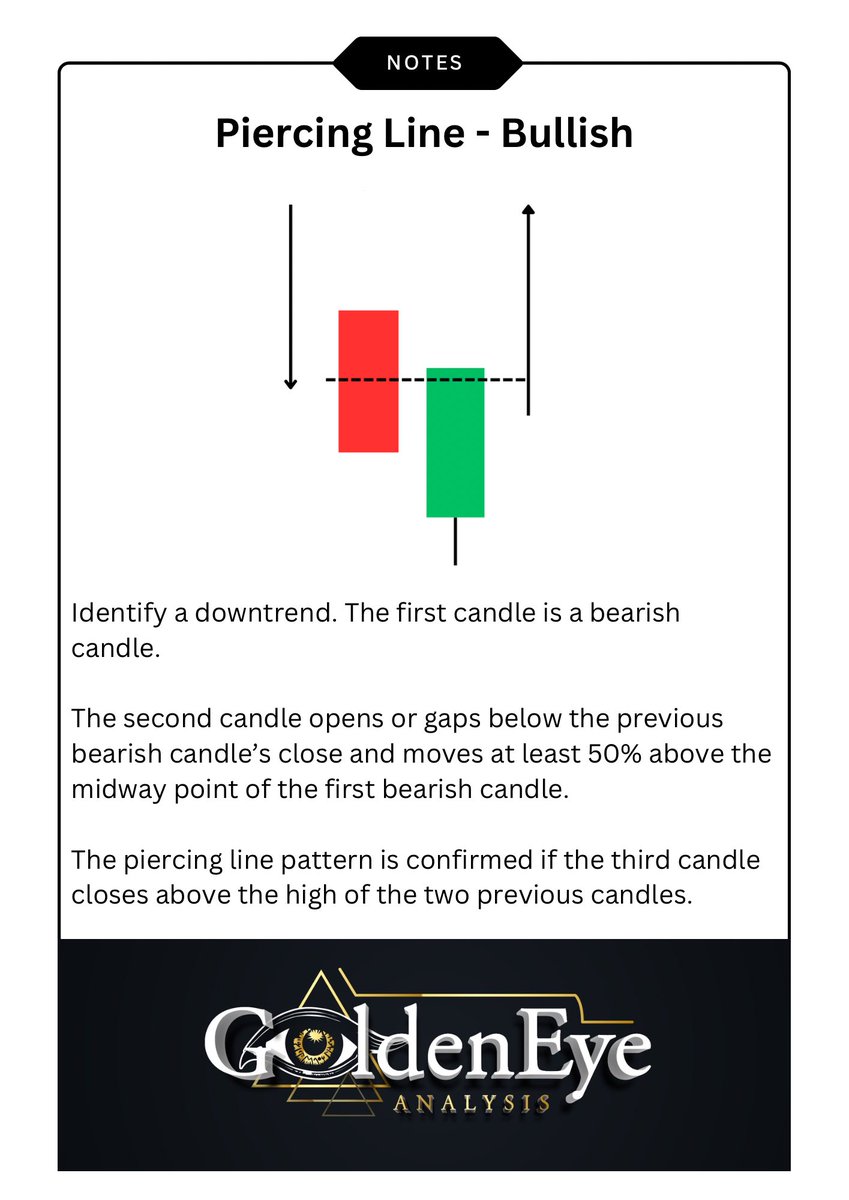
$TLT attempted to pivot higher following the piercing line candle we highlighted on May 24.
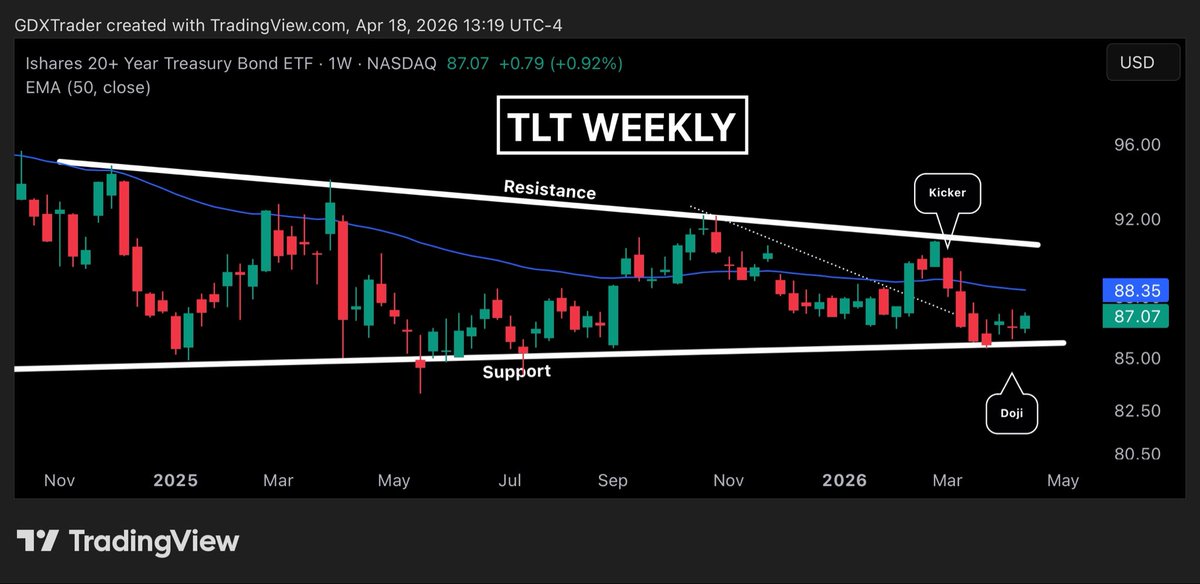
The following week produced bullish continuation, but buyers failed to close above the highs of the prior two candles, leaving the reversal unconfirmed.
This week’s green candle carries a long upper wick along with a lower high, lower low and close, signaling continued seller pressure.
From a psychology standpoint, bulls are unable to gain traction while bears defend pivot attempts.
Bulls want a close above the high of the last large bearish candle. The descending triangle remains intact with price still trading below key moving averages.
Join us at goldeneyeanalysis.com to learn Japanese candlestick patterns.
$IEF $SHY $VGIT $GOVT $TLH $EDV $ZROZ $BND $AGG $SCHR $SPTL $VGSH
May 24

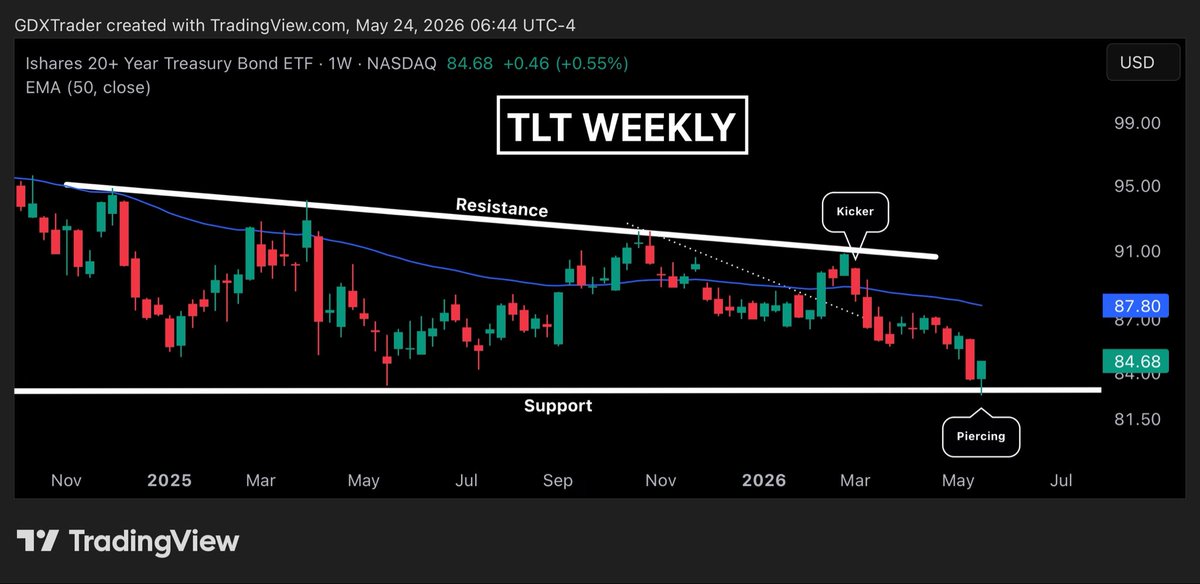
$TLT
$TLT printed a piercing line candle at horizontal support, signaling that bond prices may be attempting to stabilize after recent weakness tied to rising yields and downside pressure.
The weekly session initially traded lower, but $TLT recovered strongly and closed deep into the prior candle’s body, showing support is still being respected at this level.
Treasury bulls now want confirmation follow-through above the piercing line high to increase the probabilities of a pivot low reversal and a broader relief bounce in longer-duration bonds.
Join us at goldeneyeanalysis.com to learn Japanese candlestick patterns.
$IEF $SHY $TLH $GOVT $BND $AGG $LQD $HYG $TMF $ZROZ $EDV $TIP
2
4
2,215
May 31
$TLT
$TLT is continuing to show signs of a potential trend reversal following the bullish piercing line candle we highlighted last weekend at key horizontal support.
That candle signaled bond buyers stepping in aggressively to defend this demand zone after sellers had controlled the trend for several weeks.
Last week, buyers followed through with a gap up bullish continuation candle, confirming the initial reversal signal and suggesting a pivot low may be forming.
For traders seeking to learn effective Japanese candlestick strategies, in-depth technical concepts, detailed chart setups, and our post-market technical analysis video newsletter covering popular commodities, where we teach these approaches and more, join us at goldeneyeanalysis.com.
Discord: discord.com/invite/e4PEY2UcE…
$IEF $SHY $TLH $GOVT $BND $AGG $VGIT $EDV $ZROZ $SCHR $SPTL $TMF

May 24
$TLT
$TLT printed a piercing line candle at horizontal support, signaling that bond prices may be attempting to stabilize after recent weakness tied to rising yields and downside pressure.
The weekly session initially traded lower, but $TLT recovered strongly and closed deep into the prior candle’s body, showing support is still being respected at this level.
Treasury bulls now want confirmation follow-through above the piercing line high to increase the probabilities of a pivot low reversal and a broader relief bounce in longer-duration bonds.
Join us at goldeneyeanalysis.com to learn Japanese candlestick patterns.
$IEF $SHY $TLH $GOVT $BND $AGG $LQD $HYG $TMF $ZROZ $EDV $TIP
1
4
2,159

May 27
Pension funds have been hiding in plain sight.
Billions flowing into one Treasury ETF every quarter. Most retirees don't even know it exists.
$VGIT. Vanguard Intermediate-Term Treasury. 4.15% yield. Zero corporate credit risk. Tax-exempt from state and local.
Institutions figured this out years ago. 13F filings show them loading up every quarter.
Retail investors keep buying broad bond funds with corporate debt mixed in. Pension funds won't touch those.
4
2
71
6,054

May 20
Building a tax-efficient portfolio requires careful consideration of your investment strategy. It's not just what you invest in.
Here are two key principles:
1. Limit Fund Distributions with Broad, Low-Cost ETFs
Nearly all funds make taxable distributions. Your goal: minimize them.
•Broad, low-cost index ETFs are usually best—they’re less likely to generate capital gains compared to narrow or actively managed funds.
•The broader the fund, the lower the yield tends to be, which further improves tax efficiency.
•🚩 Funds marketed for “income generation” (think $JEPI, etc.) may sound appealing but are generally a bad idea, especially if tax efficiency is the goal.
2. Use Fewer Funds
The more funds you hold, the more rebalancing you’ll need to. Every time you sell winners to buy losers, you may generate a tax bill.
Example:
•Simple portfolio: $VTI (total U.S. stock market) $VGIT (high-quality bonds).
•Complex portfolio: $VOO (S&P 500) $VO (mid-cap) $VB (small-cap) $VGIT. Together, these stock funds approximate $VTI.
Now imagine a flat year for markets:
•With the simpler portfolio, there’s little need to rebalance. So, there’s no taxable gains.
•With the complex portfolio, VOO may outperform while VO and VB lag. Rebalancing means selling VOO, realizing gains, and paying taxes.
👉 Both portfolios end up with similar allocations, but the simpler one is far more tax-efficient.
1
2
560

LEON COOPERMAN JUST UPDATED THEIR $3 BILLION STOCK PORTFOLIO
This is everything he held as of the end of Q1 2026
Vertiv $VRT: $800.8M
Rocket Companies $RKT: $287.6M
Energy Transfer $ET: $268.7M
Pelagos Insurance $PLGO: $186.4M
MP Materials $MP: $184.8M
Apollo Global $APO: $181.7M
Mirion $MIR: $154.8M
Sunoco $SUN: $115.0M
OneMain $OMF: $107.0M
WillScot $WSC: $99.4M
Cigna $CI: $93.5M
Ashland $ASH: $92.7M
Lithia Motors $LAD: $91.1M
Elevance Health $ELV: $90.0M
Atlas Energy $AESI: $77.4M
Capital One $COF: $69.4M
KBR $KBR: $64.3M
SunOpta $STKL: $60.5M
Manchester United $MANU: $56.8M
Enterprise Products $EPD: $53.9M
Motorola Solutions $MSI: $53.0M
USA TODAY $TDAY: $45.8M
Amazon $AMZN: $44.7M
GE HealthCare $GEHC: $41.1M
Google $GOOGL: $29.8M
Vanguard S&P 500 $VOO: $29.8M
Sea Limited $SE: $29.0M
Finance of America $FOA: $25.6M
DiaMedica $DMAC: $12.3M
Arbor Realty Trust $ABR: $9.2M
EAFE Index $EFA: $5.9M
iShares Core MSCI Europe $IEUR: $2.8M
Vanguard FTSE Europe $VGK: $2.1M
Japan ETF $EWJ: $1.9M
Vanguard Intermediate $VGIT: $1.5M
iShares MSCI Canada $EWC: $720K
Vanguard Tax-Exempt $VTEB: $641K
iShares MSCI Pacific $EPP: $419K
Franklin FTSE Canada $FLCA: $296K
Horizon Space Acquisition $HSPT: $10K
(Source @ralliesai)
3
284

May 15
LEON COOPERMAN JUST UPDATED THEIR $3 BILLION STOCK PORTFOLIO
This is everything he held as of the end of Q1 2026
Vertiv $VRT: $800.8M
Rocket Companies $RKT: $287.6M
Energy Transfer $ET: $268.7M
Pelagos Insurance $PLGO: $186.4M
MP Materials $MP: $184.8M
Apollo Global $APO: $181.7M
Mirion $MIR: $154.8M
Sunoco $SUN: $115.0M
OneMain $OMF: $107.0M
WillScot $WSC: $99.4M
Cigna $CI: $93.5M
Ashland $ASH: $92.7M
Lithia Motors $LAD: $91.1M
Elevance Health $ELV: $90.0M
Atlas Energy $AESI: $77.4M
Capital One $COF: $69.4M
KBR $KBR: $64.3M
SunOpta $STKL: $60.5M
Manchester United $MANU: $56.8M
Enterprise Products $EPD: $53.9M
Motorola Solutions $MSI: $53.0M
USA TODAY $TDAY: $45.8M
Amazon $AMZN: $44.7M
GE HealthCare $GEHC: $41.1M
Google $GOOGL: $29.8M
Vanguard S&P 500 $VOO: $29.8M
Sea Limited $SE: $29.0M
Finance of America $FOA: $25.6M
DiaMedica $DMAC: $12.3M
Arbor Realty Trust $ABR: $9.2M
EAFE Index $EFA: $5.9M
iShares Core MSCI Europe $IEUR: $2.8M
Vanguard FTSE Europe $VGK: $2.1M
Japan ETF $EWJ: $1.9M
Vanguard Intermediate $VGIT: $1.5M
iShares MSCI Canada $EWC: $720K
Vanguard Tax-Exempt $VTEB: $641K
iShares MSCI Pacific $EPP: $419K
Franklin FTSE Canada $FLCA: $296K
Horizon Space Acquisition $HSPT: $10K
(Source @ralliesai)


16
32
287
65,304

By “broad market index funds”, that includes bond index funds like $BND. Individual government bonds (bills, notes, and bonds) and bond ETFs that aren’t index funds like $SGOV $VGIT etc. are also good choices.
I think most people should probably have a pretty sizable amount of stock market exposure at 65. This depends on many variables, but for most people it probably should be 20% and more commonly in the 50-60% range or even higher.
And it also may be reasonable for younger people, even 18 year olds to have a bond allocation. It depends on many variables
2
92

Apr 27
もう今月の配当まとめ行きます笑
Mslsx 22.16
PMZIX 49.17
PHYQX 33.36
PELBX 8.25
NPSFX 22.14
JPDRX 28.96
JMSFX 35.55
FIQZX 17.55
BRHYX 41.57
QWESQ 4.67
IGLD 1264.13
FIKMX 29.09
VTEB 4.10
VGIT 17.83
BSV 25.74
JMTG 31.73
JEPQ 2021.03
JEPI 17.16
IEI 11.89
SCHO 1.05
GPIX 36.06
→続く
1
7
326
Apr 18
$TLT
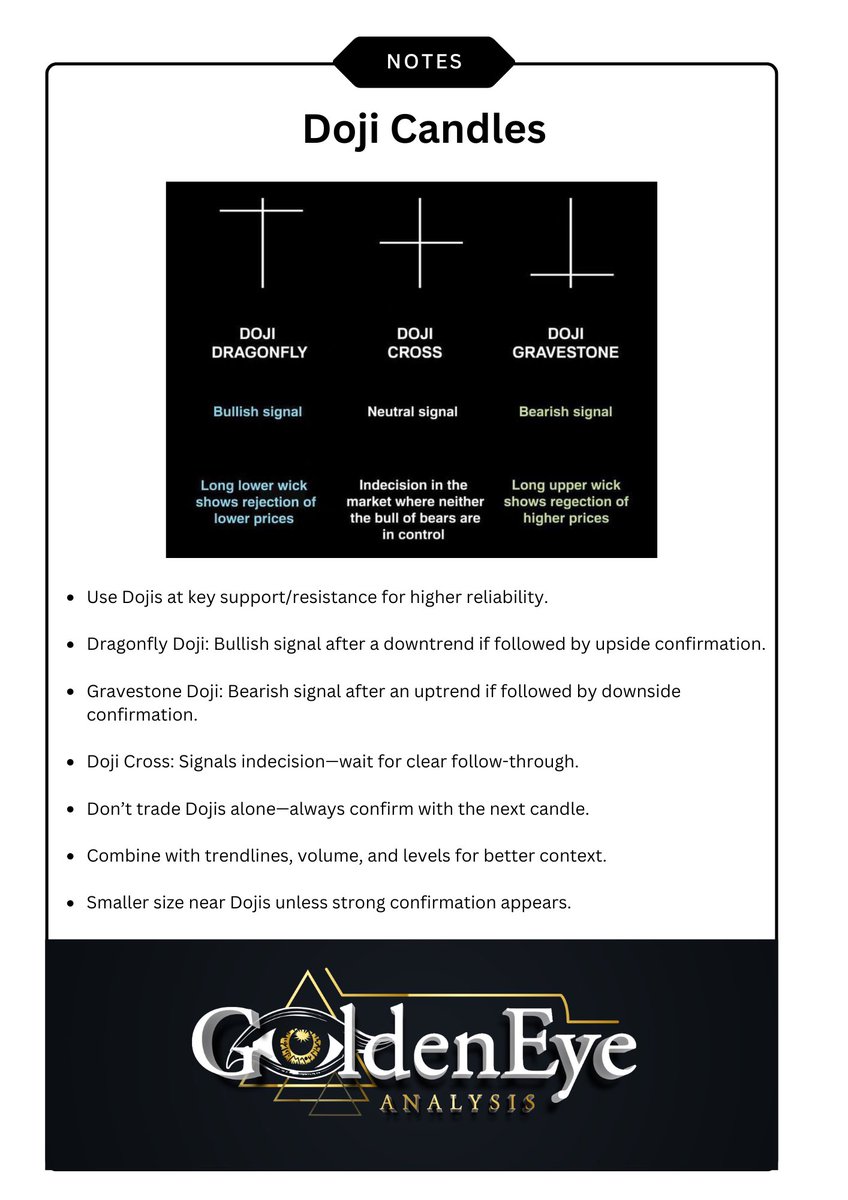
Two weeks ago, $TLT printed a doji at horizontal support of its descending triangle, signaling indecision as selling pressure stalled.
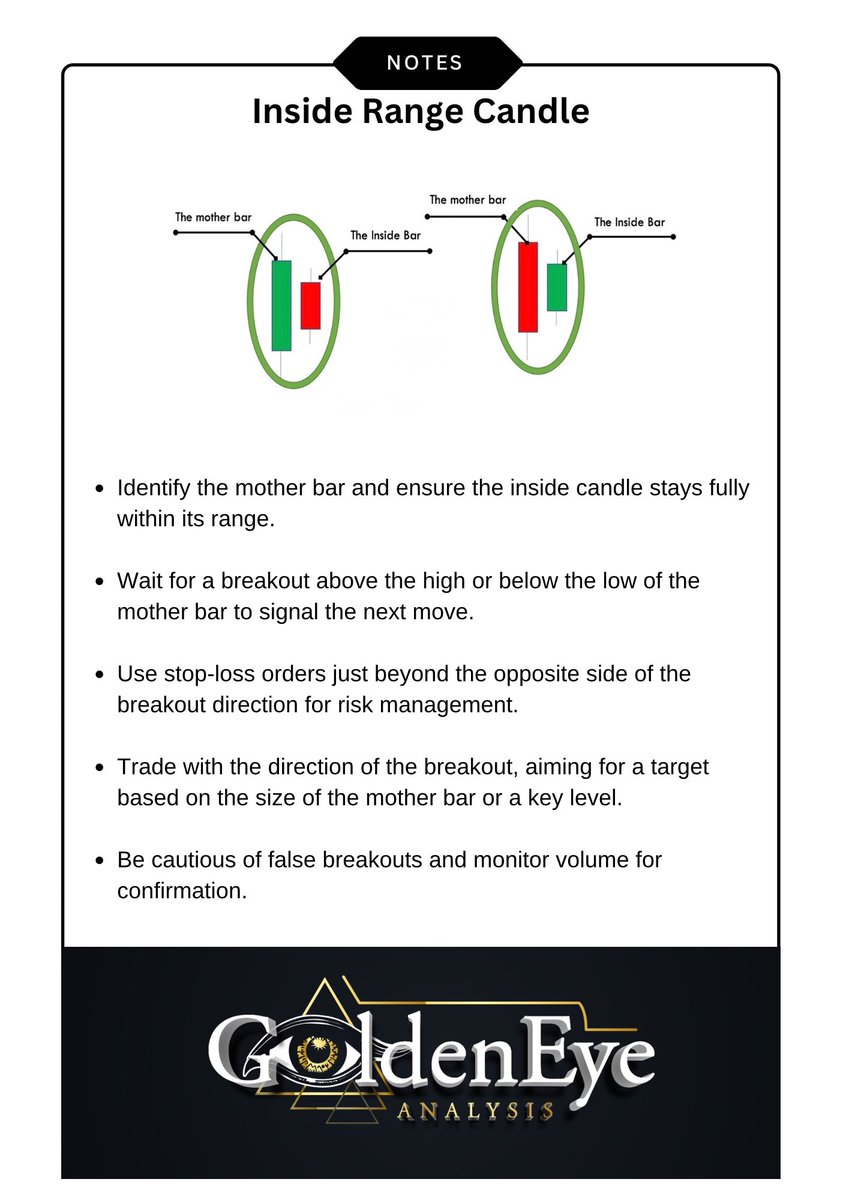
Last week’s inside candle shows compression, with bulls defending support but lacking conviction for a pivot reversal.
Trading below key moving averages keeps the bearish structure intact, bears remain in control while bulls probe for a base.
Patience is needed until a clear pivot or breakdown confirms direction.
$IEF $SHY $TLH $EDV $ZROZ $VGIT $VGSH $VGLT $SCHR $SPTS $SPTL $GOVT
2
5
1,432
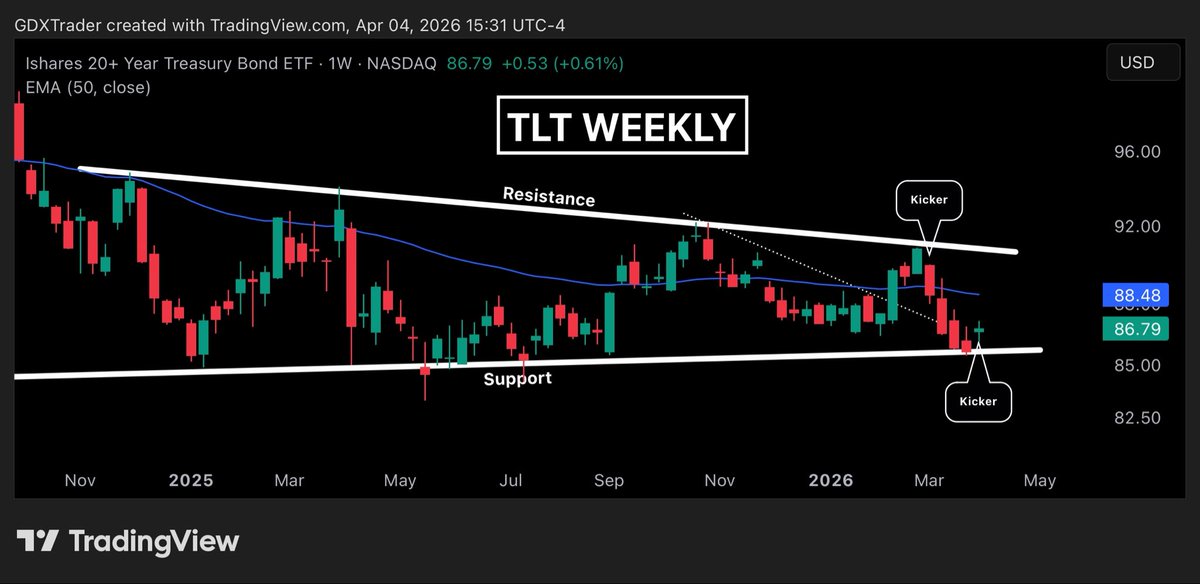
Apr 5
$TLT
$TLT put in a bearish kicker earlier in March at descending resistance, which marked a clear rejection and shift in control from bulls to bears, leading to the expected pullback into ascending support.
Now, right at that support level, we’re seeing a bullish kicker develop last week, signaling a potential shift back in sentiment as buyers step in to defend structure.
Psychologically, this reflects a tug of war where bears lost momentum into support and bulls are attempting to regain control.
If we get follow-through, this could mark the start of a bounce within the range, with support holding as a key level bulls must defend.
$IEF $SHY $TLH $EDV $GOVT $BND $AGG $LQD $HYG $TIP $MUB $VGIT

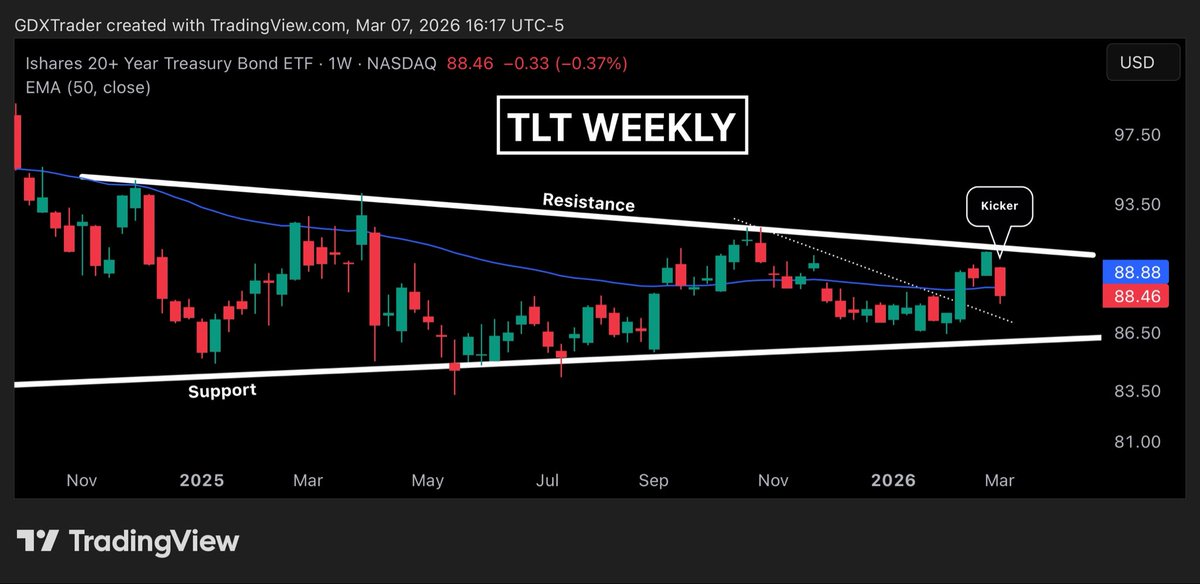
Mar 7
$TLT
$TLT put in a bearish kicker last week, a strong signal candle showing that selling pressure quickly regained control after price attempted to break resistance.
The rejection came right at descending resistance, reinforcing that supply continues to defend the lower highs.
Closing back below the 50 EMA adds to the bearish tone, as that moving average failed to hold as support and now becomes a short-term pressure zone.
Psychologically, this reflects $TLT losing momentum at resistance and failing to sustain upside acceptance.
With price now sitting mid-range inside a symmetrical triangle, the structure remains neutral until either side forces resolution.
Mid-range inside a triangle is often lower probability territory, so the cleaner setup usually develops closer to either support or resistance where risk can be more clearly defined.
$IEF $SHY $TLH $BND $AGG $GOVT $VGIT $EDV $ZROZ $TMF $TIP $LQD
1
4
1,573

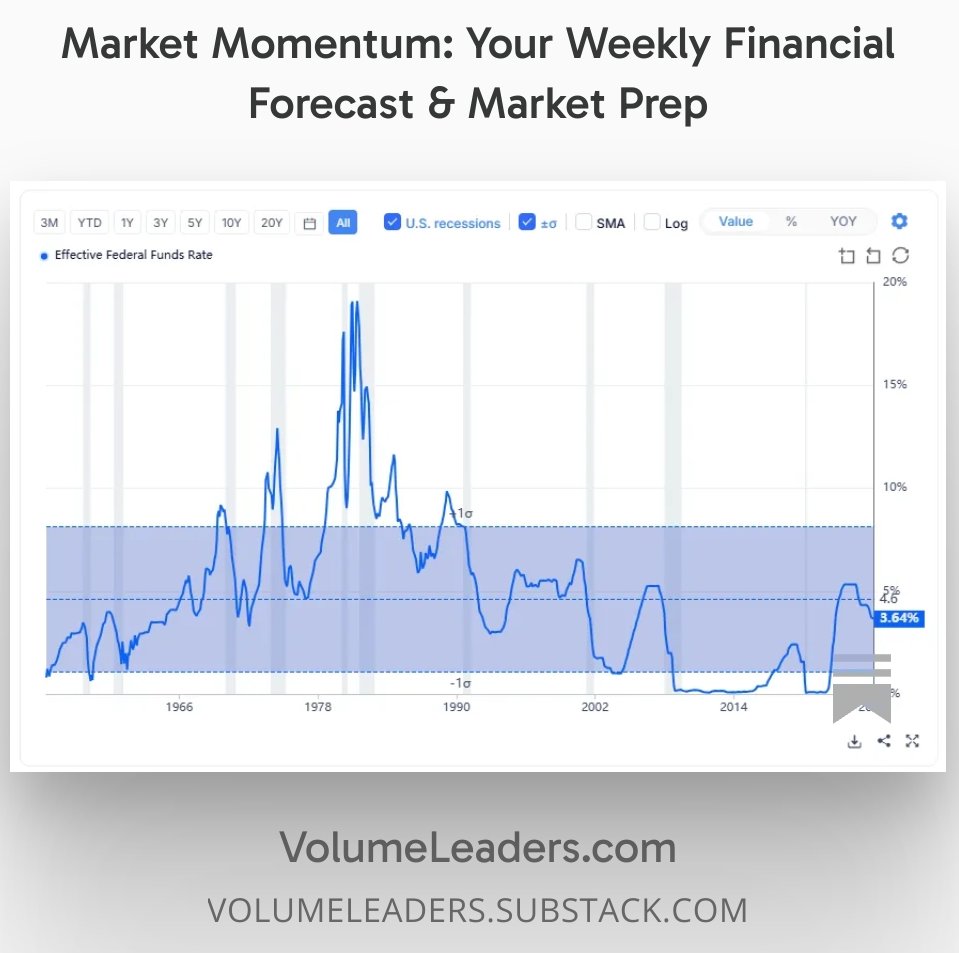
Apr 4
Issue 85 of Market Momentum is now available.
Five weeks of selling, a geopolitical crisis, and a tape finally trying to breathe -- here is what is actually moving:
• This week's tape: S&P snaps a five-week losing streak with a 3.36% gain, Nasdaq posts its best week since November -- but breadth is still thin and the 50-day remains broken on most names.
• Smart money told the story first: Treasury buying at 5 sigma, XLP sweeps stacking back-to-back days, and dark pool flows in VGIT, IEF, and AMT -- not the rotation playbook of a market ready to rip.
• Powell at Harvard: no rate hike coming. Fed explicitly looks through the oil shock, takes the worst-case tightening scenario off the table, and sends the 10-year yield back to 4.31%. Bond market believed it. Equity market wanted to.
• Strait of Hormuz: WTI above $100, vessel traffic at a crawl, Trump signals an exit -- then escalates again in the same week. The relief rally is real but the resolution is not.
• Coming week: ISM Services Monday, Core PCE and GDP Thursday, CPI Friday. If services cracks or headline inflation runs hot, this bounce gets a serious stress test -- fast.
I'm releasing the full, unabridged playbook for the week ahead, no paywall on this one: volumeleaders.substack.com/
If you enjoy my work, please ♥️ 🔁
6
32
4,586
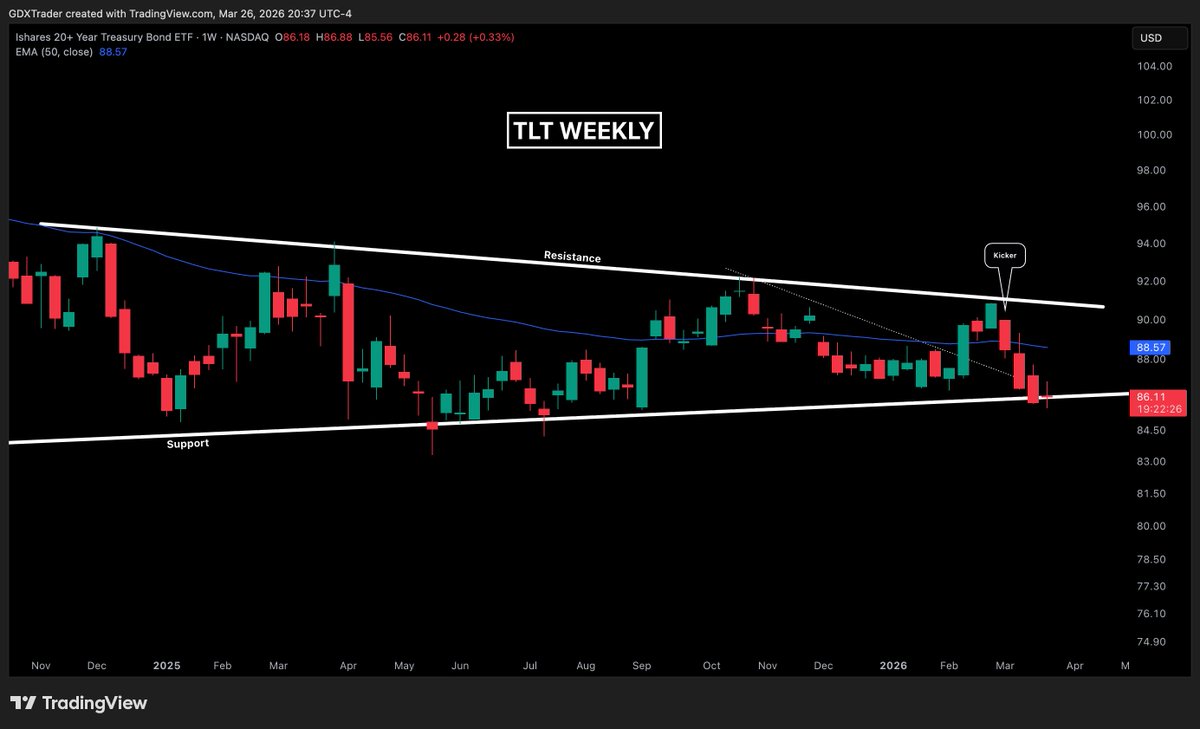
Mar 27
$TLT
After the bearish kicker candle from a few weeks ago at resistance, price has now pulled back into a key support zone at ascending support, where this week's doji so far reflects clear indecision.
A pause in momentum, with buyers attempting to step in while sellers begin to lose some control.
This is a key inflection point, either bulls defend and drive a bounce with follow-through, or bears maintain control on a breakdown and continue the broader trend lower.
$IEF $SHY $IEI $VGIT $VGSH $GOVT $SCHR $SPTL $SPTS $TLH $ZROZ $EDV

Mar 7
$TLT
$TLT put in a bearish kicker last week, a strong signal candle showing that selling pressure quickly regained control after price attempted to break resistance.
The rejection came right at descending resistance, reinforcing that supply continues to defend the lower highs.
Closing back below the 50 EMA adds to the bearish tone, as that moving average failed to hold as support and now becomes a short-term pressure zone.
Psychologically, this reflects $TLT losing momentum at resistance and failing to sustain upside acceptance.
With price now sitting mid-range inside a symmetrical triangle, the structure remains neutral until either side forces resolution.
Mid-range inside a triangle is often lower probability territory, so the cleaner setup usually develops closer to either support or resistance where risk can be more clearly defined.
$IEF $SHY $TLH $BND $AGG $GOVT $VGIT $EDV $ZROZ $TMF $TIP $LQD
1
2
5
2,235

Mar 21
They are just getting around to defined maturity bond funds and still really don’t have much granularity in Treasury ETF (eg they really just have VGIT and VGLT vs IEI IEF TLH TLT by iShares). The AUM of the iShares funds vs VG suggests real demand for more granularity.
1
3
106

If you’re building a portfolio in 2026 and want a starting point, this is how I’d map it today.
These are index funds and ETFs. I talk a lot about individual stocks, but I wouldn’t recommend starting there.
S&P 500:
$VOO (Vanguard)
$FXAIX (Fidelity)
$IVV (iShares)
$SWPPX (Schwab)
Total US Market:
$VTI (Vanguard)
$FZROX (Fidelity)
$ITOT (iShares)
$SWTSX (Schwab)
Total International Market:
$VXUS (Vanguard)
$FZILX (Fidelity)
$IXUS (iShares)
$SWISX (Schwab)*
*Add $SFENX for EM
Factor ETFs:
$AVGV (global value tilt)
$AVUV (US small value)
$AVDV (intl small value)
$AVES (EM value)
$QVAL (US deep value)
$IVAL (intl deep value)
$QMOM (US momentum)
$IMOM (intl momentum)
REITs:
$VNQ (Vanguard)
$FREL (Fidelity)
$IYR (iShares)
$SCHH (Schwab)
Bonds / Treasuries:
$BND (Vanguard, total bond)
$FBND (Fidelity, active bond)
$IUSB (iShares, total bond)
$SWAGX (Schwab, agg bond)
$VGIT (intermediate treasuries)
$VGLT (long treasuries)
Cash / Money Market:
$SNSXX (Treasury MMF)
$VMFXX (Gov MMF)
$SPAXX (Gov MMF)
Alternatives (Managed Futures):
$CTA (trend following)
$DBMF (replicated futures)
$KMLM (systematic macro)
h/t @RuffinFinance for the inspiration from his fantastic 2023 post.
3
2
17
1,367


Mar 10
88 new feeds went live on Pyth Pro last week.
🌝 5 Extended to 24/5 Coverage:
BKNG, CPER, IWM, TLT, USO
🇺🇸 5 New US Equities (24/5 coverage):
EWZ, IEF, KWEB, SIVR, SLV
🦅 4 New US Equities (extended hours):
ARKB, EEM, IBIT, SOXL
🍔 67 New US Equities:
AAAU, BND, BNDX, BRK.B, EFA, EXC, FIGR, FOXA, GFS, HYG, IAUI, IUSB, IXUS, JEPQ, JKHY, LNT, LQD, MCHI, MDB, MELI, MS, MTCH, NEM, NTRS, NVD, NVDL, NVO, OKLO, OXY, PDD, PFE, PM, PODD, RBLX, RKLB, RTX, SCHW, SLB, SOXX, SPGI, SQQQ, STRC, SWKS, T, TEAM, TEM, TMO, TQQQ, TRMB, TROW, TSLQ, TSLL, TTD, UBER, V, VALE, VCIT, VCSH, VGIT, VRSN, VRT, VTI, VXUS, WFC, WTW, XLV, ZS
👀 4 CME Index Futures (June 2026):
DMM6, EMM6, NIDM6, NMM6
🪙 3 Crypto:
ETH/BTC, MCDX/USD, QQQX/USD
🛢 1 Commoditie:
WTIM6 (WTI Crude Oil May 2026)
17
19
95
4,819
Mar 7
$TLT
$TLT put in a bearish kicker last week, a strong signal candle showing that selling pressure quickly regained control after price attempted to break resistance.
The rejection came right at descending resistance, reinforcing that supply continues to defend the lower highs.
Closing back below the 50 EMA adds to the bearish tone, as that moving average failed to hold as support and now becomes a short-term pressure zone.
Psychologically, this reflects $TLT losing momentum at resistance and failing to sustain upside acceptance.
With price now sitting mid-range inside a symmetrical triangle, the structure remains neutral until either side forces resolution.
Mid-range inside a triangle is often lower probability territory, so the cleaner setup usually develops closer to either support or resistance where risk can be more clearly defined.
$IEF $SHY $TLH $BND $AGG $GOVT $VGIT $EDV $ZROZ $TMF $TIP $LQD
1
6
5,045

Mar 5
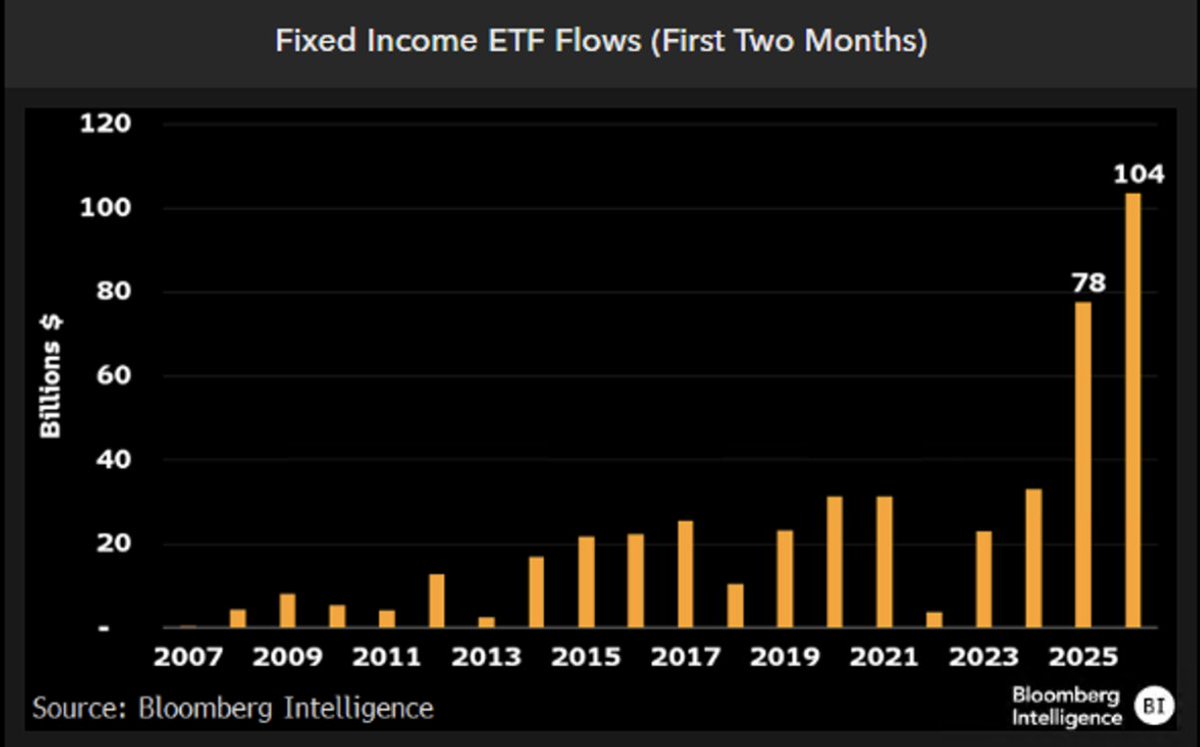
固定利回りETFは、年初の最初の2ヶ月で流入額が1000億ドルに達し、記録的なスタートを切り、5-10年平均をはるかに上回っています。一部はリスクオフの債券へのシフトですが、ほとんどの部分は単に全体的に流入がはるかに多くなっているため、すべてが記録的なスタートを切っているのです。通常の有力銘柄がリード(トップ6のうち4つがVGROD系):$SGOV、$VCIT、$BND、$AGG、$VGIT、$BNDX チャート via
@SirYappityyapp
Mar 5

Fixed income ETFs have hit $100b in flows in first two months of year, a record start and a country mile ahead of their 5-10yr avg. Part it some risk-off rotation to bonds but most is simply that there's just there's just way more flows ALL AROUND so everything is off to record start. Usual suspects leading charge (vgrd 4 of top 6): $SGOV, $VCIT, $BND, $AGG, $VGIT, $BNDX chart via @SirYappityyapp
2
187