
استراتيجية تداول الانعكاسات باستخدام "نمط الوتد"
يُعد نمط الوتد من أقوى الأدوات الفنية للتنبؤ بانعكاس الاتجاه، وينقسم إلى نوعين أساسيين:
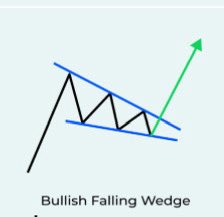
1️⃣ نمط الوتد الهابط (Falling Wedge):
يأتي عادةً بعد حركة هبوط، حيث تتقارب خطوط الاتجاه التي تربط القمم والقيعان في اتجاه هبوطي، مما يشير إلى ضعف ضغط البيع.
نقطة الدخول: عند اختراق السعر لخط الاتجاه العلوي.
وقف الخسارة: يُوضع أسفل نقطة الدخول ببضع نقاط.
جني الأرباح: عند الوصول لمستوى المقاومة الفوري.
2️⃣ نمط الوتد الصاعد (Rising Wedge):
يظهر غالباً بعد حركة صعود، حيث تتقارب الخطوط في اتجاه صاعد، مما يعكس ضعف القوة الشرائية وبداية سيطرة البائعين.
نقطة الدخول: عند كسر السعر لخط الاتجاه السفلي.
وقف الخسارة: يُوضع أعلى نقطة الدخول ببضع نقاط.
جني الأرباح: عند الوصول لمستوى الدعم الفوري.
خلاصة: السر في هذه الاستراتيجية هو مراقبة "تضييق" السعر بين الخطين؛ فكلما ضاق الخناق، زادت احتمالية الانفجار السعري والانعكاس.
#تداول #التحليل_الفني #الأسهم #العملات #WedgePattern

15
123
4,423

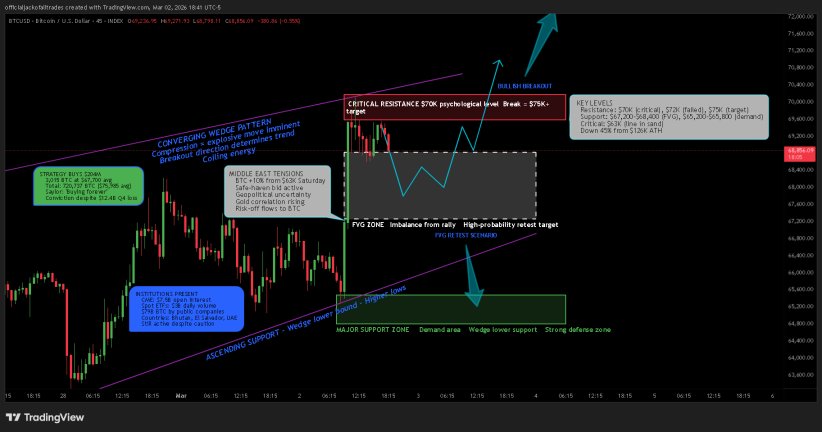
Bitcoin at a CRITICAL decision point. $BTC
Trading $68,400 in a converging wedge. Testing $69,600-$70K resistance.
Full breakdown 👇
tradingview.com/chart/BTCUSD…
#Bitcoin #BTC #Crypto #Trading #TechnicalAnalysis #WedgePattern #Strategy #FVG #Breakout
1
1
36

16 Nov 2025
$BTC Descending Wedge Drama – Breakout to New Highs or 90K Flush?
Altcoin Pioneers! 📊 BTC/USD 12H paints a classic descending wedge from October's 126k peak, now coiling at ~96k after slicing through the blue trendline support. Bullish undertone intact with higher lows, but macro rotation (stocks vs. crypto) keeps the lid on – volume's waning on the drop, hinting at exhaustion.
Hold support? Strong case at 95k (wedge lower bound); RSI at 42 neutral, eyeing divergence for a squeeze. Breakout above resistance? Golden if >100k clears on halving echo, targeting 110k. Deeper dip risk? Possible flush to 90k (Fib 0.618) if yields spike.
#BTC #WedgePattern #CryptoForecast

1
191

16 Nov 2025
🏦 $XRP Under Squeezing Pressure: Tightening Wedge Pattern Between $2.26 and $2.33 Signals Imminent Volatility ⚠️
The price of $XRP is currently in a state of extreme tension, repeatedly clinging to the critical support level of $2.26 while failing multiple times to breach the resistance at $2.33. This tug-of-war is not stability—it is a tightening wedge pattern that signals an explosive price move is about to occur. 💥
The current divergence between fundamental belief and compressed price action is impossible to ignore:
🔹 The Battle at $2.26 and $2.33 ⚔️
$2.26 - The Buyer's Fortress: This price level is being defended fiercely by buyers, making it a crucial psychological and technical support zone. Holding this level is paramount for maintaining the short-term bullish structure.
$2.33 - The Resistance Wall: This resistance level, supported by short-term selling and potentially older positions, is halting the upward momentum. The repeated failure to clear $2.33 indicates that selling pressure remains significant.
🔹 The Wedge Pattern: Volatility Is Unavoidable 🌪️
Price Compression: The tightening wedge pattern—characterized by an increasingly narrow trading range—suggests that both buyers and sellers are running out of energy to determine the direction.
Technical Rule: Technically, this pattern often leads to a decisive, sharp breakout. The direction of the breakout will be determined by which side (bulls or bears) prevails at the wedge's boundaries:
Breakout Above $2.33: Could lead to a rapid price surge, targeting higher levels (potentially $2.50 and beyond). 🚀
Breakdown Below $2.26: Will trigger a sell-off, pushing $XRP toward deeper support levels. 🩸
🔹 Potential Catalysts ✨
Institutional Inflows: Recent reports of strong institutional capital flows (e.g., $200 million in inflows recently, based on past data) suggest that institutional interest is real and building a foundation.
ETFs and Regulatory Clarity: Hopes for XRP ETF approvals and complete legal clarity remain the strongest fundamental catalysts, capable of generating enough buying force to shatter $2.33.
$XRP is currently in the calm before the storm. The margin for error is rapidly shrinking. Smart money is preparing for a sudden move, closely monitoring whether $2.26 will hold. 👀
@EdgenTech
#XRP #Ripple #TechnicalAnalysis #WedgePattern #CryptoNews #Resistance #Support #Breakout #MarketUpdate
2
49

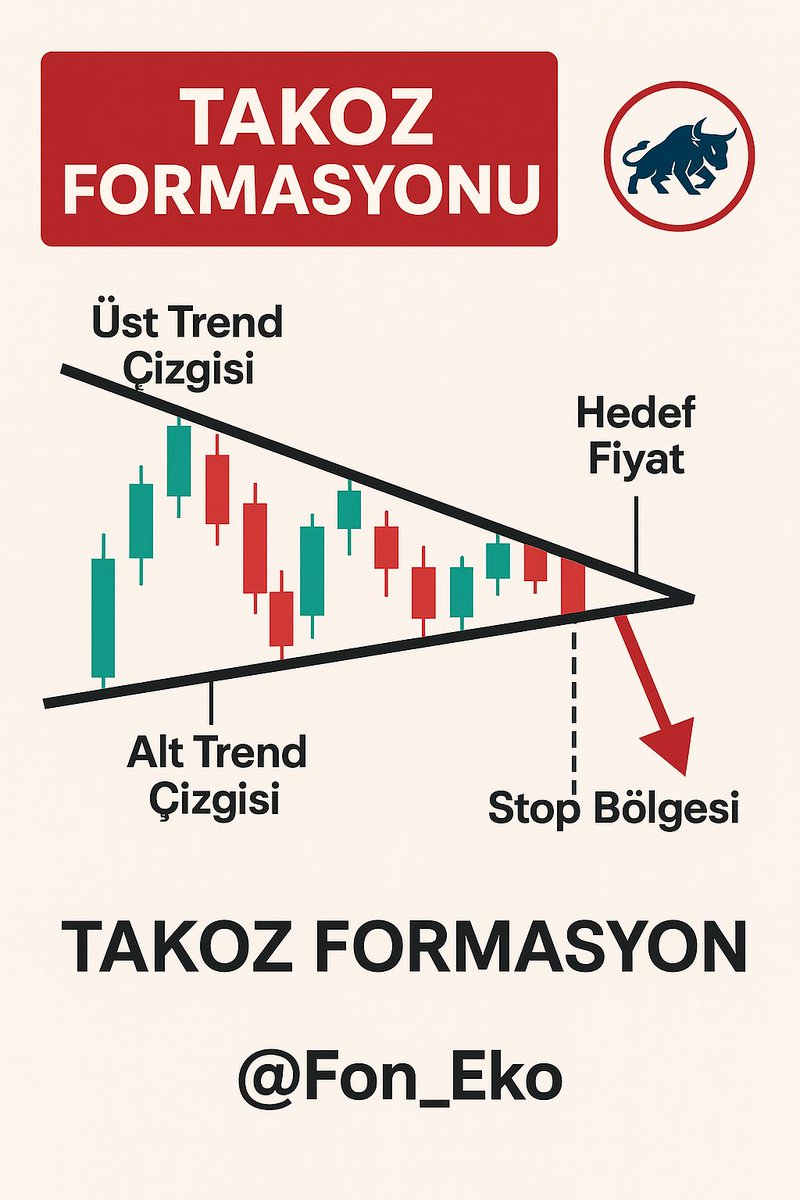
📉 TAKOZ FORMASYONU: FİYAT SIKIŞMASININ SON AŞAMASI VE TREND TERSİNE DÖNÜŞ SİNYALİ.
Takoz (Wedge) formasyonu, fiyat hareketlerinin giderek daralan bir alanda sıkışmasıyla oluşan, trendin zayıfladığını ve dönüş ihtimalinin güçlendiğini gösteren önemli bir teknik analiz modelidir. Hem yükselen hem de düşen piyasalarda görülebilir. Formasyon tamamlandığında fiyat, çoğu zaman önceki trend yönünün tersine doğru keskin bir kırılım yapar.
🔻 Üst Trend Çizgisi
Fiyat her tepe oluşturduğunda bu tepenin bir öncekinden daha düşük seviyede kalması, satıcıların güç kazandığını gösterir. Üst trend çizgisinin aşağı eğimli olması, baskının satıcılardan geldiğini teyit eder.
🔺 Alt Trend Çizgisi
Diplerin de giderek yükselen şekilde gelmesi, fiyatın sıkıştığı klasik takoz yapısını oluşturur. Her iki çizginin birbirine doğru yaklaşması, piyasadaki kararsızlığın ve gerilimin arttığını gösterir.
📌 Sıkışma Alanı
Takoz formasyonunda fiyatlar her iki taraftan baskı yediği için volatilite azalır. Bu düşük volatilite dönemi, yaklaşan güçlü bir hareketin habercisidir.
⚡ Kırılım (Breakout / Breakdown)
Formasyon tamamlandığında fiyat genellikle takozun dışına sert şekilde çıkar. Çoğu durumda kırılım, önceki trend yönünün tersine olur. Özellikle hacmin artması kırılımın daha güvenilir olduğuna işaret eder.
🎯 Hedef Fiyat
Teknik analizde takoz formasyonunun hedefi, sıkışmanın yüksekliği (takozun en geniş bölümü) kadar bir fiyat hareketinin kırılım yönüne eklenmesiyle hesaplanır. Bu hedef alanı genellikle başarıyla test edilir.
🛑 Stop Bölgesi
Kırılım sonrası fiyatın yeniden takoz içine dönmesi formasyonu geçersiz kılar. Bu nedenle stop seviyesi, çoğu zaman kırılım yönünün ters tarafındaki trend çizgisinin hemen dışına konur.
Takoz formasyonları, fiyat sıkışmalarını anlamada ve trend değişimlerini erken tespit etmede oldukça etkilidir. Profesyonel yatırımcıların en çok takip ettiği reversal (dönüş) modellerinden biridir.
#TeknikAnaliz #TakozFormasyonu #WedgePattern #FinansalOkuryazarlık #Borsa @foneko
3
479


1 Oct 2025
🔥 Love the breakdown! 🔥
That descending wedge is tightening up and the volume shelf at $10 is like a spring coiling. If $OPEN can clear $10 with volume, $13.50 isn’t crazy at all – it’s the next measured move target. 👀📈
I’m strapping in – breakout season might be closer than people think. 🚀🍀
#OPEN #Opendoor #Stocks #Trading #Breakout #Trendline #WedgePattern
1
2
4
744

6 Sep 2025
🚨 The Wedge Pattern – Smart Money’s Favorite Trap.
🔗youtu.be/7kB4C-AgIAA
The wedge pattern is not just another chart setup — it’s one of the most powerful climax patterns in trading. Often marking major tops & bottoms, wedges act as smart money traps, creating explosive reversals when traded with the right confirmation tools.
In this new video, Bharat Jhunjhunwala breaks down how to master wedge trading using RSI Multi-Timeframe Analysis for high-probability setups across stocks, forex, crypto & commodities.
✅ Spot Rising vs Falling Wedges with precision
✅ Understand why wedges trap retail traders
✅ Use RSI divergence & range shifts for perfect timing
✅ Align daily, weekly & intraday charts for confluence
✅ Exact entry, stop & exit rules for wedge trades
✅ Real-world charts: Nifty, Bank Nifty, Bitcoin, Gold, Silver
📈 2025 Market Edge:
Wedge = exhaustion → explosive reversals
RSI MTF = confluence → safer trades
Smart money = traps liquidity → sharp reversals
This is not theory — it’s a practical wedge trading system you can apply right now.
👉 Like if you’ve ever been caught in a wedge trap
👉 Comment your experience trading wedges
👉 Share with traders who want to catch tops & bottoms with accuracy
#WedgePattern #SmartMoneyTrap #RSI #MultiTimeframeTrading #ChartPatterns #TechnicalAnalysis #SwingTrading #DayTrading #StockTrading #ForexTrading #CryptoTrading #TradingStrategy #ReversalPatterns #TradingSetups #BharatJhunjhunwala #TradingEducation #MarketPsychology

4
636

15 Aug 2025
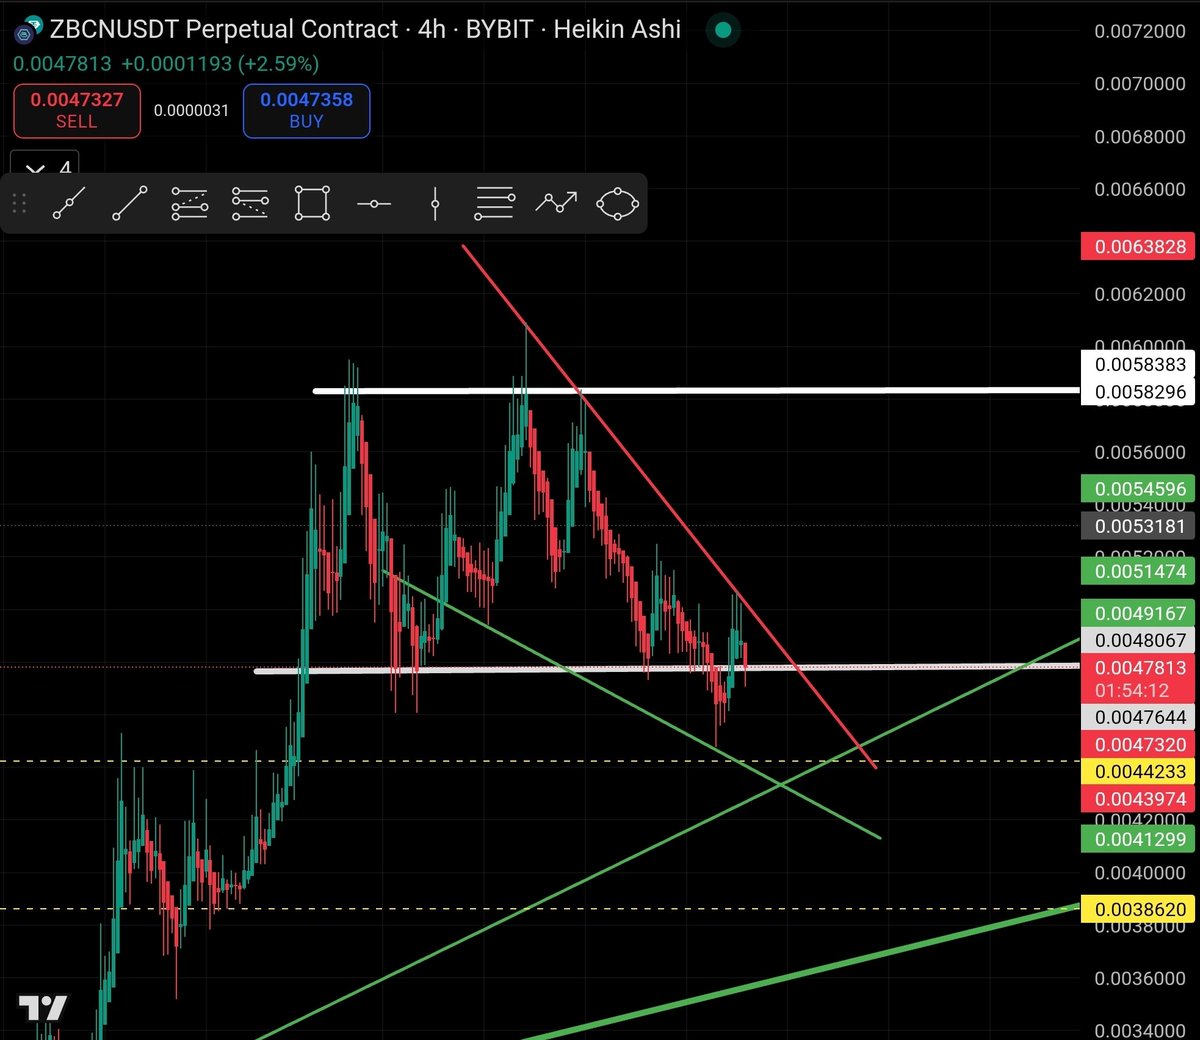
🚨 $ZBCN Still Bearish 📢
After analyzing the charts, I am still anticipating a price drop to my target range 📉 between 0.0038 and 0.0042. I'm holding a bearish outlook until we break this wedge pattern to the upside 🚩.
Once that happens, I'll switch to bullish 🐂, with a price target of 0.0055 to 0.006 🌟. With token unlock and bullish news today 📈, expect recovery by early next week!
Possible breakout Saturday or Sunday ⏰, with Monday or Tuesday prices reaching above 0.0058 🚀. #CryptoTrading #TechnicalAnalysis #WedgePattern #TradingStrategy
Disclaimer: This is not financial advice. Please do your own research and consult a professional before making any trading decisions. 📝
$ZBCN $BTC $ETH $XRP $ADA $XLM
6
9
72
2,318

29 Jul 2025
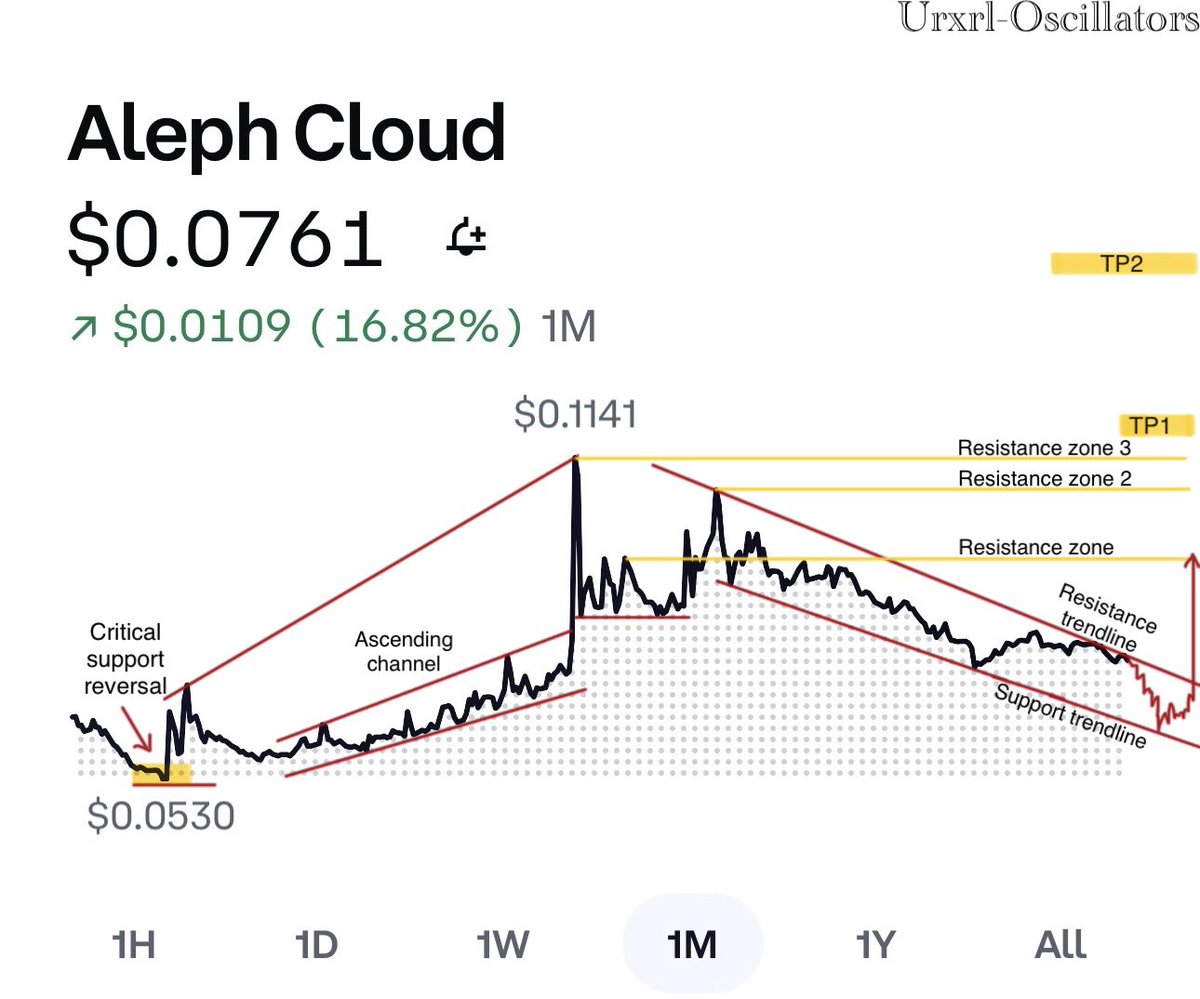
🔲 $ALEPH – Downtrend Reversal Setup Compression Breakout Watch
$ALEPH has rebounded from the $0.0530 critical support zone, showing signs of reversal after months of decline. The price structure reveals a falling wedge pattern, often seen as a bullish reversal signal. With volume returning and price testing resistance trendline, an additional breakout is imminent.
📍 Current Price: ~$0.0761 ( 16.82% 1M)
⸻
📉 Key Support Levels:
• $0.067 – Minor local support
• $0.060 – Mid-wedge demand
• $0.0530 – Critical support reversal zone
📈 Key Resistance Levels:
• Resistance trendline (~$0.078–$0.080)
• R1: $0.089 – Horizontal resistance
• TP1: $0.101 – Major breakout target
• TP2: $0.114 – Full wedge breakout extension
🎯 Breakout Target Range: $0.101 – $0.114 (on confirmed wedge break)
⸻
🔍 Technical Indicators
🧪 RSI (1M): Turning upward from oversold zone, entering neutral territory
📊 Volume Profile:
• Volume spikes near $0.0530 suggest accumulation
• Currently low, indicating potential energy buildup
📐 Market Structure Notes:
• Pattern: Falling wedge (bullish)
• Bounce off long-term support, wedge narrowing into apex
• Price challenging diagonal resistance — breakout watch active
🧲 Liquidity Zones:
• $0.078–$0.080: Thin supply area at wedge top
• $0.089 : Vacuum zone toward TP1/TP2
⸻
📌 Bottom Line:
• ✅ $ALEPH formed a clear falling wedge from $0.1141 → $0.0530.
• ⚔ Current breakout test near $0.078 – critical watch zone.
• 🚀 Breakout above wedge hold above $0.089 opens path to $0.101–$0.114.
Aleph Cloud is in a textbook downtrend reversal setup. Eyes on volume and wedge break confirmation.
Always DYOR. 🟢📈🔥
#ALEPH #CryptoTA #Altcoins #WedgePattern #BullishReversal #PriceAction #BreakoutWatch #UrxrlTrading #CryptoSignals
3
1,735

26 Jul 2025
"Ascending wedge on $BTCUSDT chart! 🟡 Wait for breakout before trading. Entry: $19,800.00, Stop: $18,800.00, Take Profit: $22,500.00. 💡 #Bitcoin #Crypto #Trading #WedgePattern #Breakout #LongPosition #BTCUSDT go.flux.fund/binance" #BTCUSDT
1
4
75

25 Jul 2025
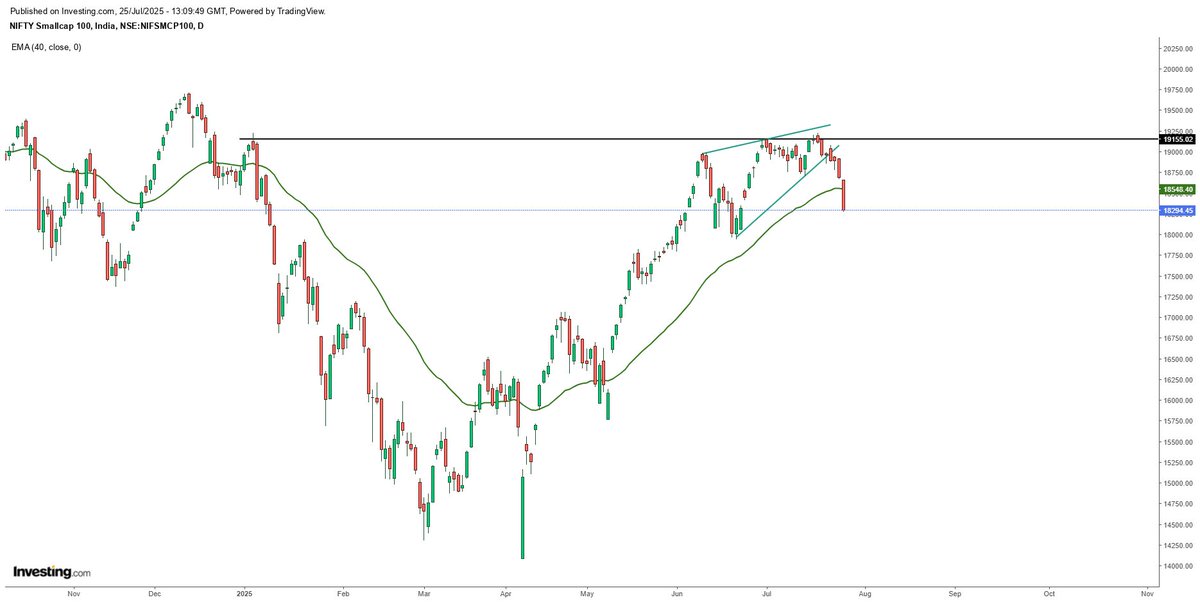
As highlighted earlier, the Smallcap 100 index showed weakness after hitting a key swing high and forming a wedge. The breakdown is now confirmed with a close below the 40 DEMA & 9 WEMA.
No rush — waiting patiently for signs of strength before expecting any trend reversal.
Chart attached. Not a recommendation.
#StockMarket #NiftySmallcap100 #TechnicalAnalysis #PriceAction #MarketCorrection #WedgePattern #EMA #SwingTrading #Nifty #Investing #ChartAnalysis
24 Jul 2025

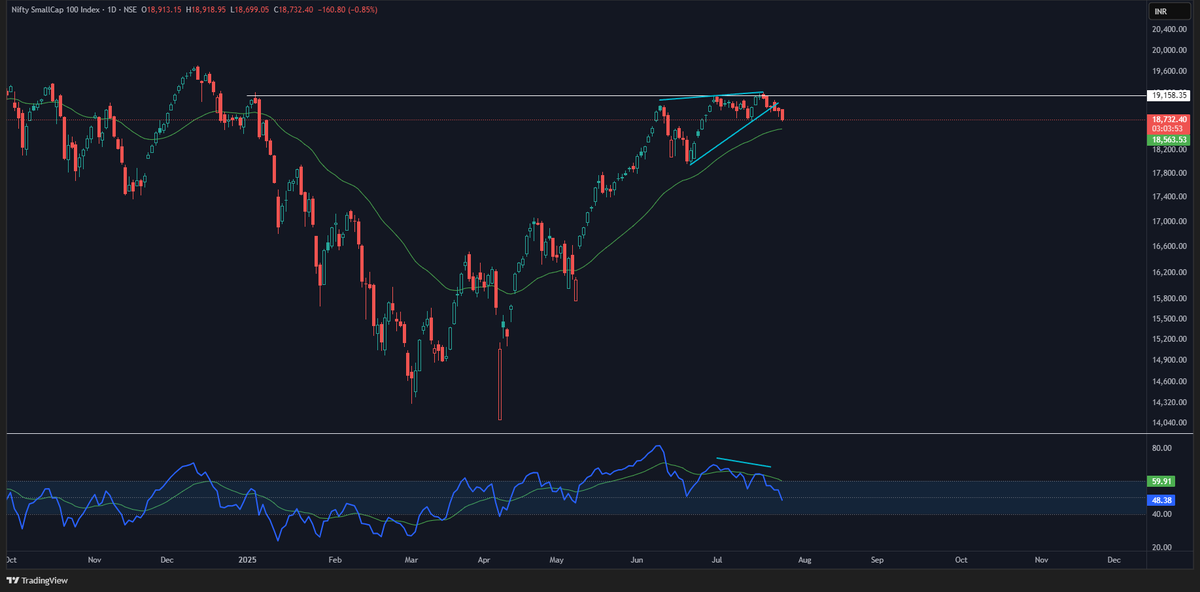
Nifty Smallcap 100 is breaking down from a wedge after a negative RSI divergence.
Key level to watch: 40 DEMA @ 18,563.
If bulls lose this, the downside could accelerate.
Disclaimer: Not investment advice. For educational purposes only.
#TechnicalAnalysis #NiftySmallcap100 #RSI #StockMarketIndia #nifty #nifty50 #banknifty #smallcap
1
1
3
1,333

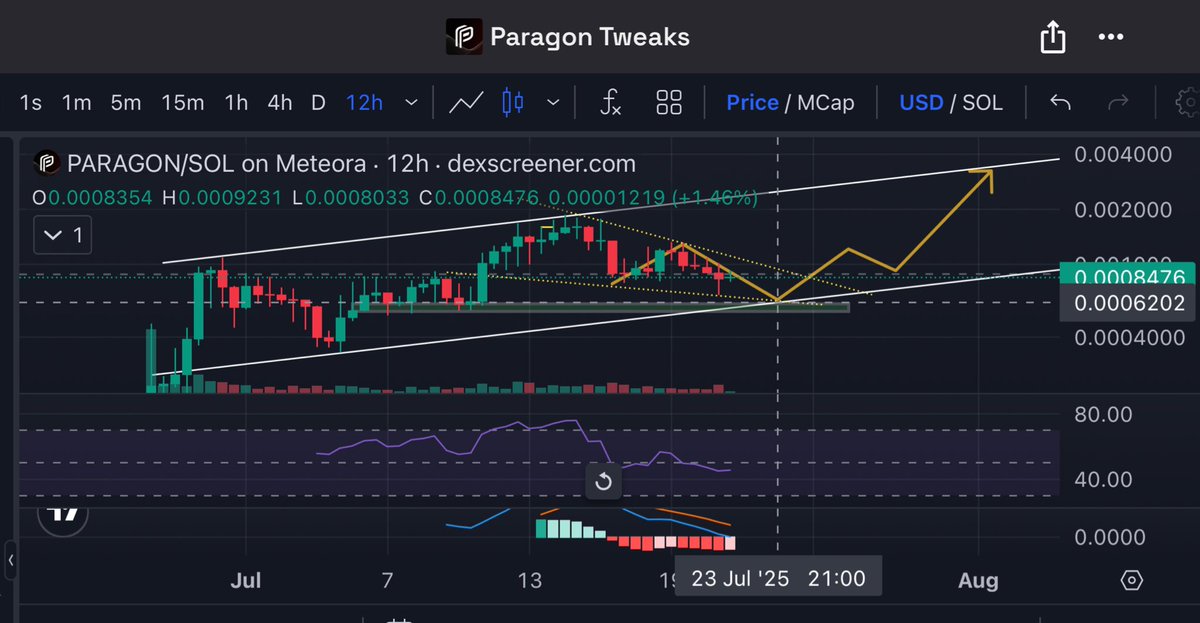
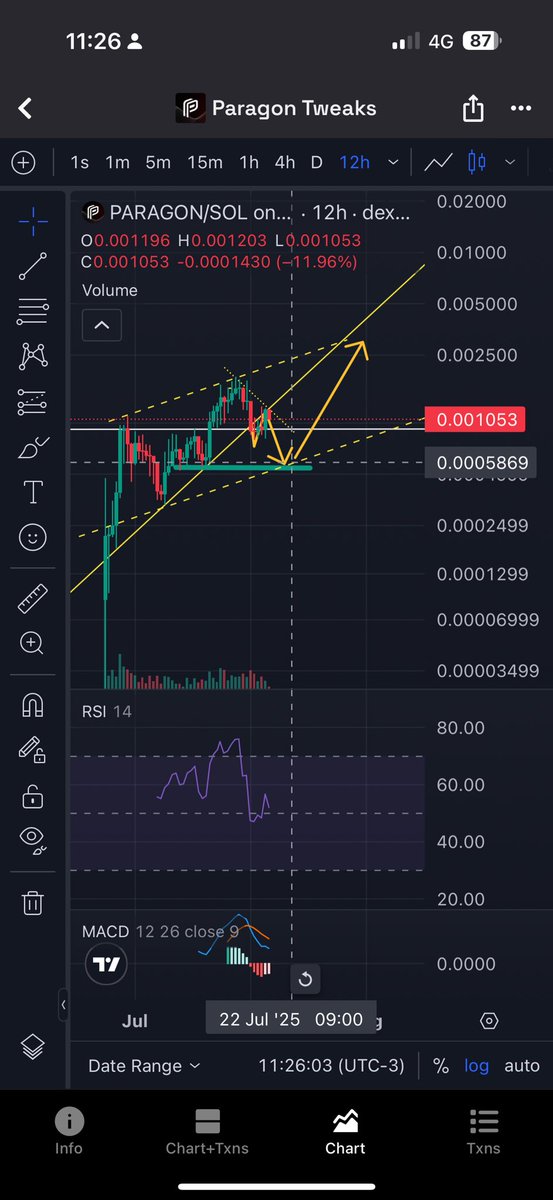
22 Jul 2025
$PRGN #Paragon broke out of the rising wedge on the daily and failed to reclaim it after 4 retests. As mentioned in the last post, I believe a correction down to around 600k is likely. It’s now forming a descending wedge on the daily, within a larger upward channel. I’ll be adding more around the 600k range. I believe this project will soon reach a $10M market cap. DYOR.
$btc
$eth
$sol
$collat
$cdb
$payai
#nvidia
#epicgames
#Crypto #Altcoins #CryptoAnalysis #WedgePattern #MarketCap #CryptoTrading #TechnicalAnalysis #BullishSetup #CryptoInvesting
19 Jul 2025

4
3
27
2,652

10 Jul 2025
Remember $NIKE shared back in January? Here is the new update!
NIKE Completes A Three-Year Correction
#stocks #NIKE #correction #endingdiagonal #wedgepattern #support #rsi #technical #analysis #elliottwave #freechart
Full article in the link below👇👇
wavetraders.com/blog/nike-co…

$NIKE Steps Into Final Stages Of A Three-Year Correction
#stocks #NIKE #correction #endingdiagonal #wedgepattern #support #rsi #technical #analysis #elliottwave #freechart
👇👇
wavetraders.com/free-charts/…
1
1
6
1,663

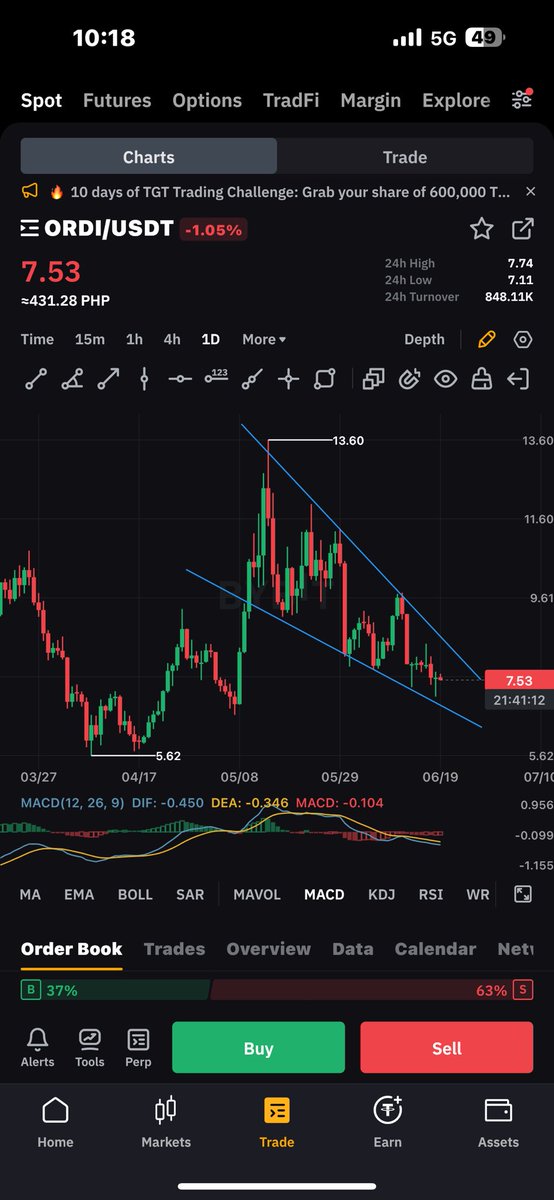
19 Jun 2025
“A breakout is brewing. $ORDI is coiling within a bullish wedge — patience now, profits next. Smart money watches before it runs.”
#ORDI
#BRC20
#CryptoBreakout
#BullishMomentum
#BitcoinEcosystem
#WedgePattern
#Altseason
2
1
14
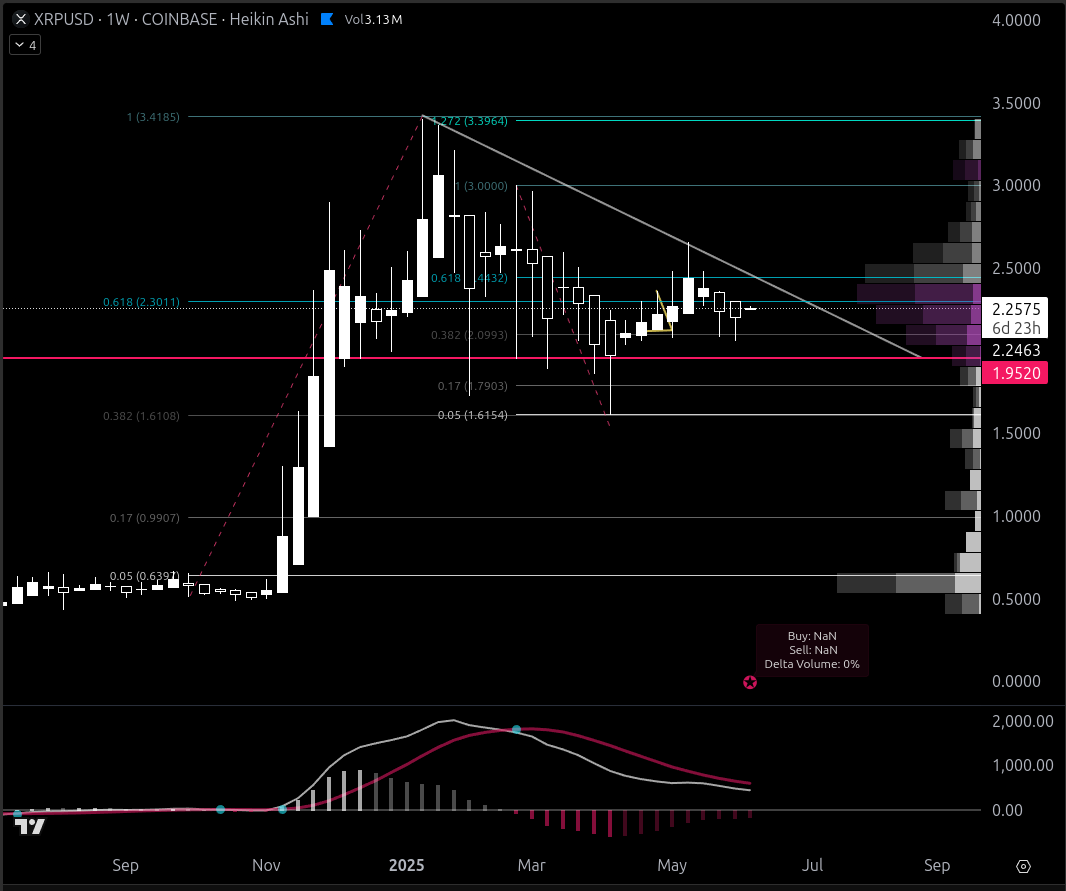
1,965

$XRP/USD Descending wedge on 1W chart, apex on Aug 20. Breakout above 2.587 bullish, below 1.952 bearish.
#XRP #Crypto #TechnicalAnalysis #WedgePattern
5
101

5 Jun 2025
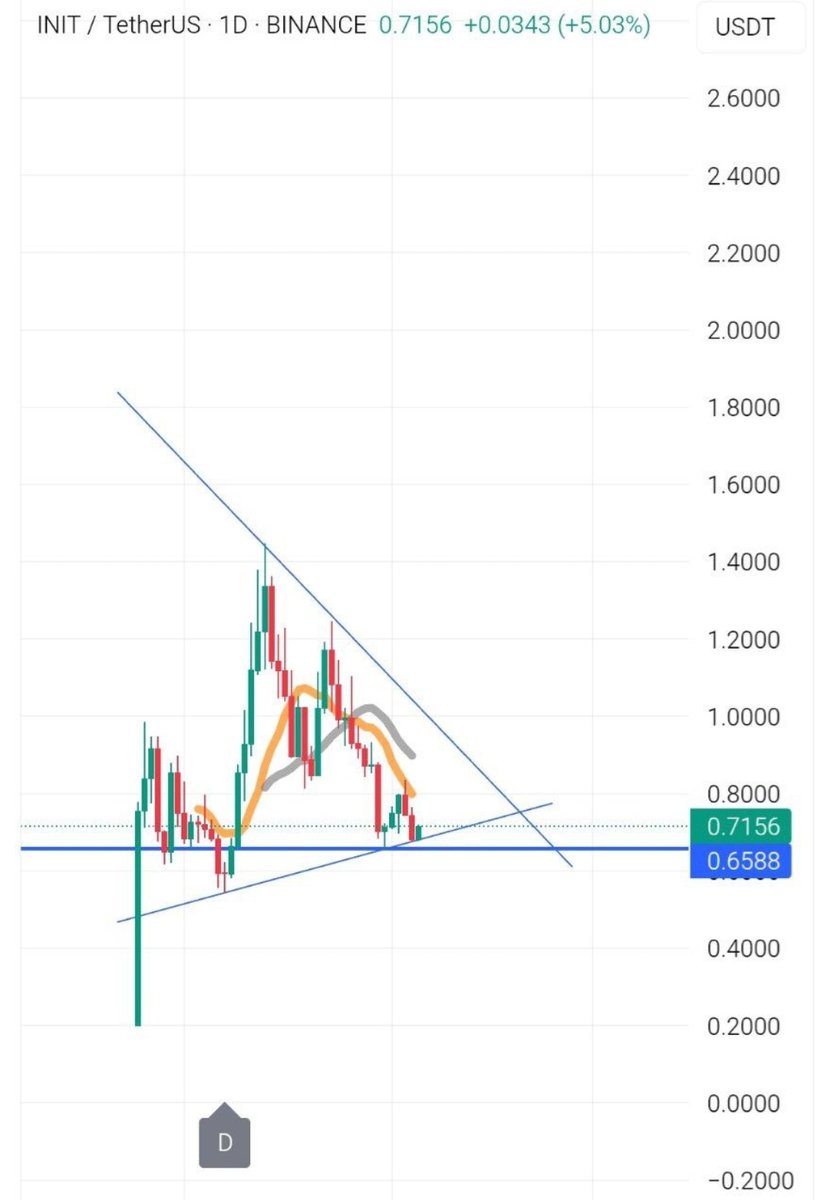
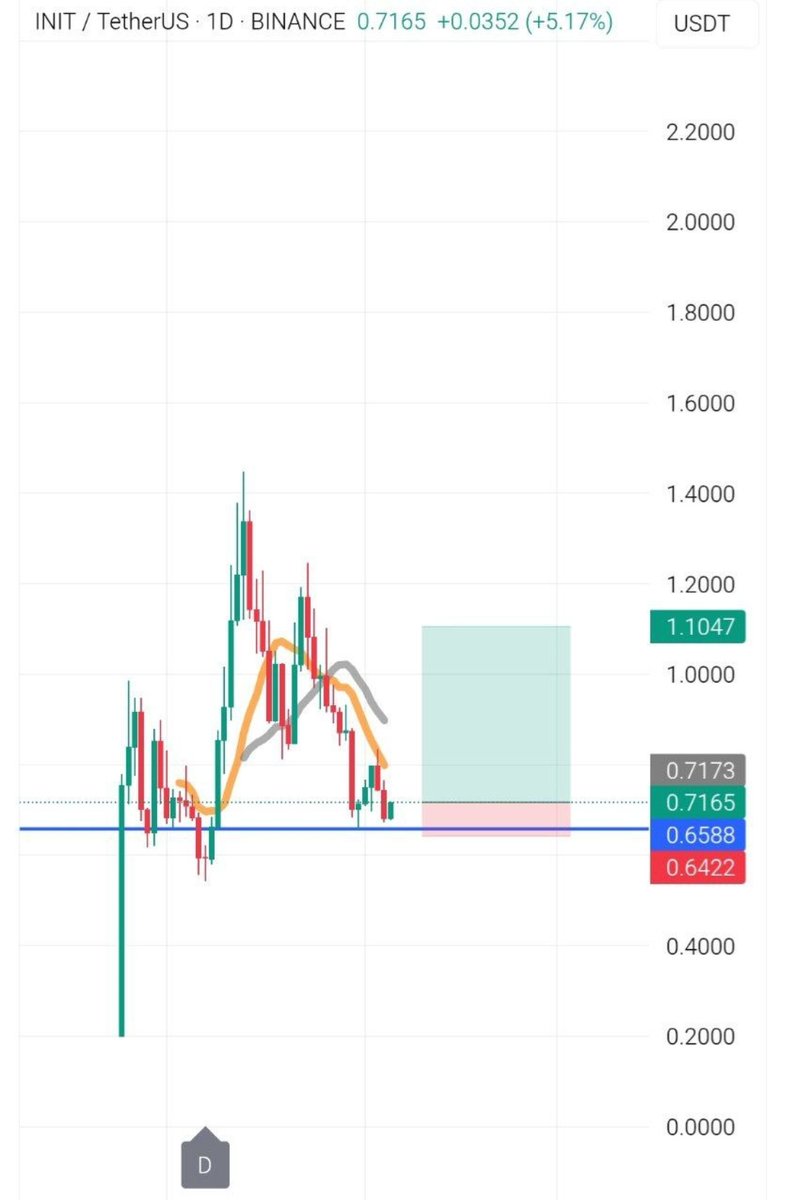
$INIT ⚡️
Bouncing hard off wedge support! 📈🔁
Technicals lining up for a potential breakout 🚀📊
Eyes on the chart — this could be the start of something BIG 👀🔥
Breakout traders, are you watching?
#INIT #CryptoCharts #WedgePattern #AltcoinSeason #BreakoutAlert #ChartSetup #TA #TechnicalAnalysis #CryptoAlpha #100xSetup 🧠💹📉📈🚀
5
92

#AssociatedAlcohols #chart
For more such #Updates and #ChartPatterns visit my.soctr.in/x & "follow" @MySoctr
#Nifty #nifty50 #investing #BreakoutStocks #Breakout #Nse #nseindia #Stockideas #stocks #StocksToWatch #StocksToBuy #StocksToTrade #StockMarket #trading #Nse #Nseindia #Stocks #Trades #stockmarkets #HnS #CnH #Volume #ChartPattern #WedgePattern #TrendlineResistance #stockmarketindia #StockAnalysis #LatestBO #BOChart #Btst #AssociatedAlcohols #AssociatedAlcoholsLtd #ASALCBR

1
2
182

4 Jun 2025
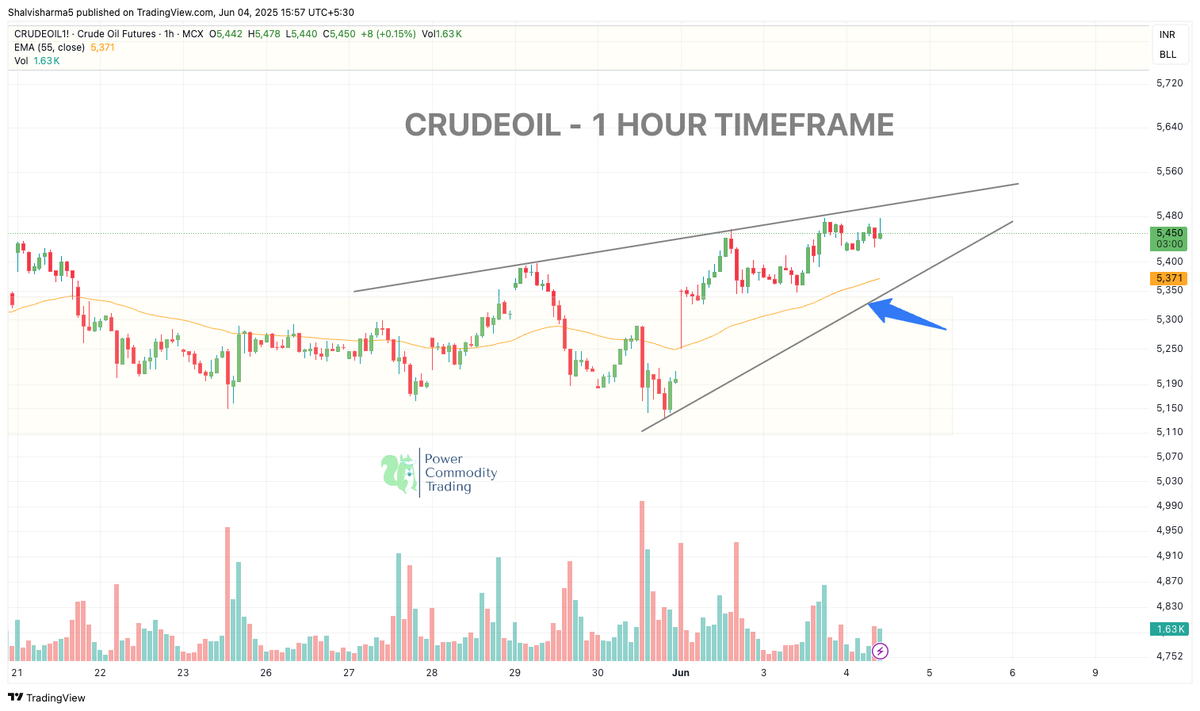
📈 Crude Oil Update – Rising Wedge Formation
Crude is trading inside a rising wedge on the 1-hour chart.
Price is holding above EMA 55 near 5372, showing strength — but upside momentum is slowing.
🔹 Support: 5370 trendline
🔹 Resistance: 5480–5500 zone
🔹 Watch for breakout or breakdown soon
#CrudeOil #MCXUpdate #PowerOfCommodity #PriceAction #WedgePattern #TrendWatch
3
206
#Saregama 10.09% #positivemovement since 26 days back
For more #Updates visit my.soctr.in/x and "follow" @Mysoctr
#MarketTrends #StockMarkets #Nifty #BankNifty #FinNifty #NiftyMidcap #NiftySmallCap #nifty50 #investing #BreakoutStocks #StocksInFocus #StocksToWatch #StocksToBuy #StocksToTrade #StockMarket #trading #stockmarkets #NSE #Nseindia #FlagPattern #CnH #HnS #Bullish #Bearish #TrianglePattern #Trendline #Resistence #Saregama #SaregamaLtd #SaregamaChart #wedgePattern

2
213