
Tableau Zen Master/Visionary 21-22 | Tableau Ambassador 20,21 | Hackiest Vizzie Award 2019-2020
Joined November 2018
- Tweets 2,120
- Following 1,302
- Followers 2,145
- Likes 4,932
356 Photos and videos


29 Dec 2024
😍😍😍
28 Dec 2024

That’s a viz wrap, DataFam! 🎉
A year of endless creativity on Tableau Public. Discover the most favorited visualizations and a curated collection of the data stories that shaped 2024: tabsoft.co/4gOHCoy
1
9
623
Alex Varlamov retweeted

30 Nov 2024
I just turned 45.
If you're in your 30's, read this:
315
3,967
31,953
7,397,049
13 Oct 2024
My dataset on @kaggle contains over 1.75M vehicles that have ever appeared in movies from 1900 to 2024.
This dataset is the result of parsing imcdb.org website about cars in movies.
#datafam #python @KaggleDatasets
kaggle.com/datasets/alexande…
2
3
10
1,572
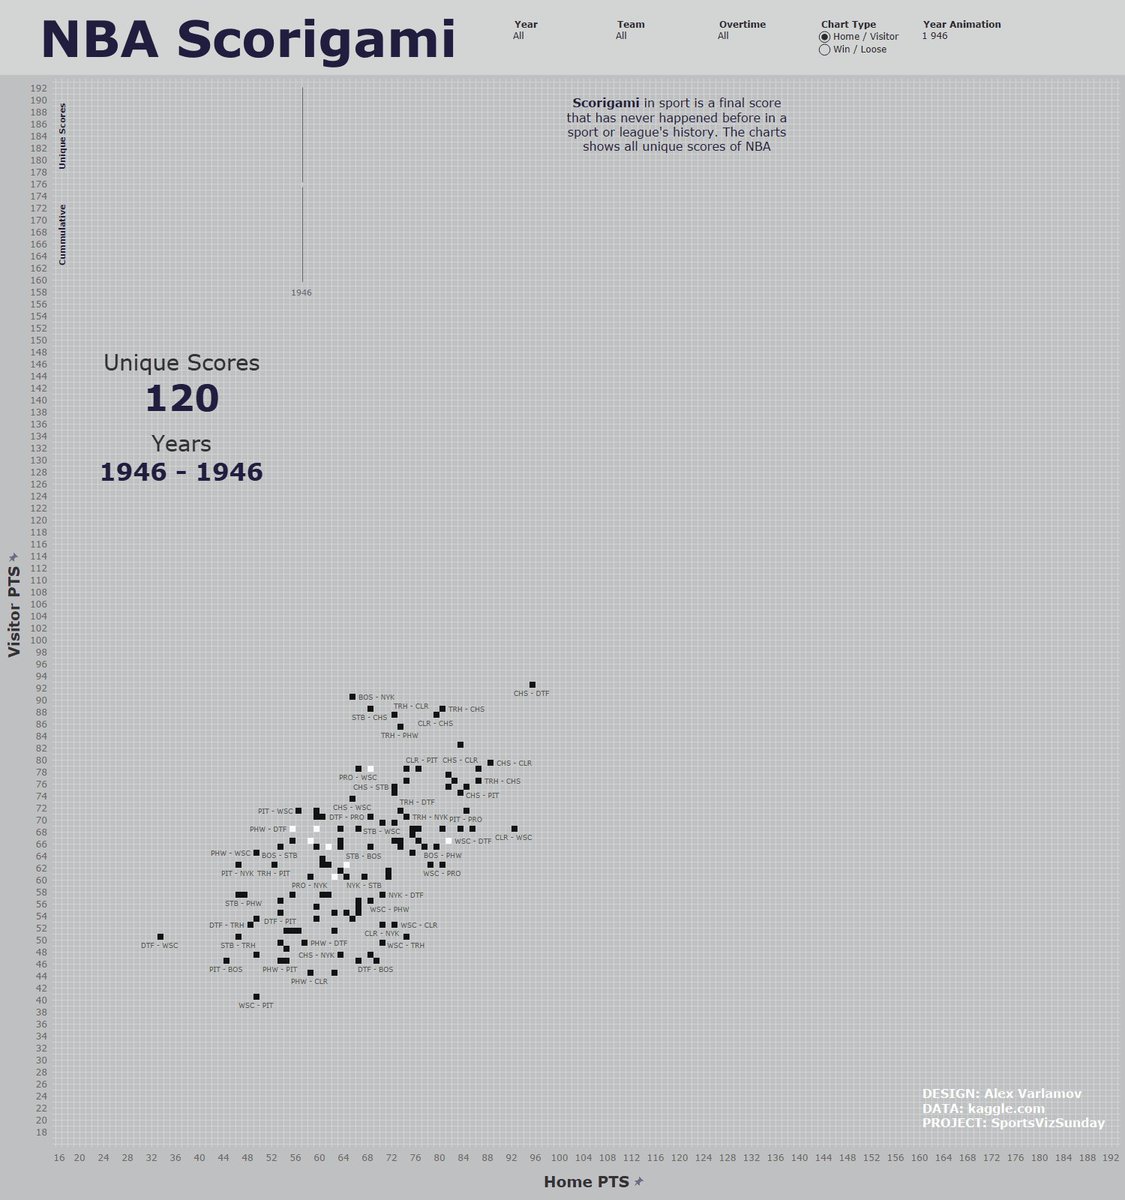
22 Sep 2024
Created the 'NBA Scrogami' viz which reflects all unique @NBA scores from 1946 to 2024. Not classic scorigami board, but idea is the same.
public.tableau.com/app/profi…
@NBA_Scorigami_ @tableau #tableau #SportsVizSunday #datafam
@Mo_Wootten @MrRoweUK @_CJMayes @SimonBeaumont04
1
27
735
7 Sep 2024
Congratulations everyone! ❤️💙💚

Introducing the 2024 Tableau Ambassadors. 🎉
These 396 community leaders bring their knowledge and leadership to help empower everyone with data.
Meet the 2024 cohort: tabsoft.co/4ebb8n0
#TableauAmbassador

4
368
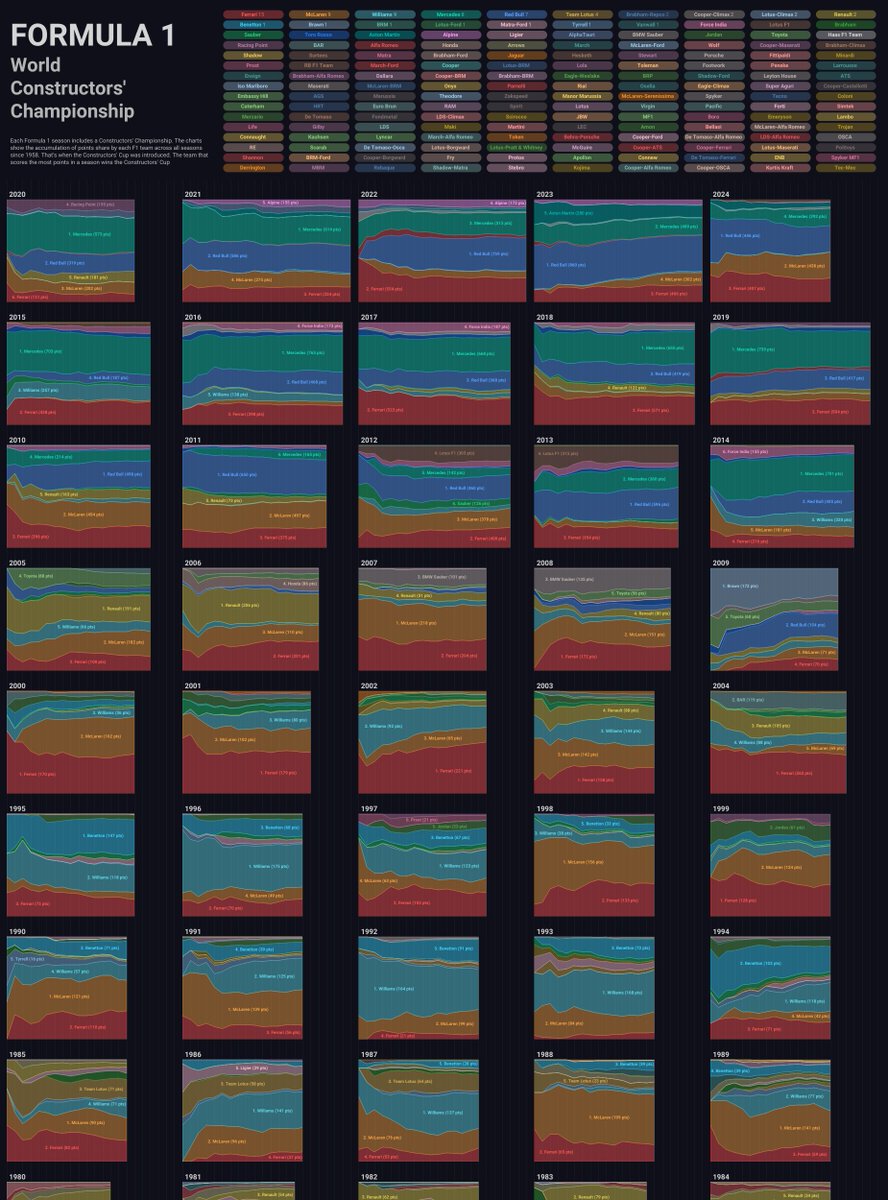
3 Sep 2024
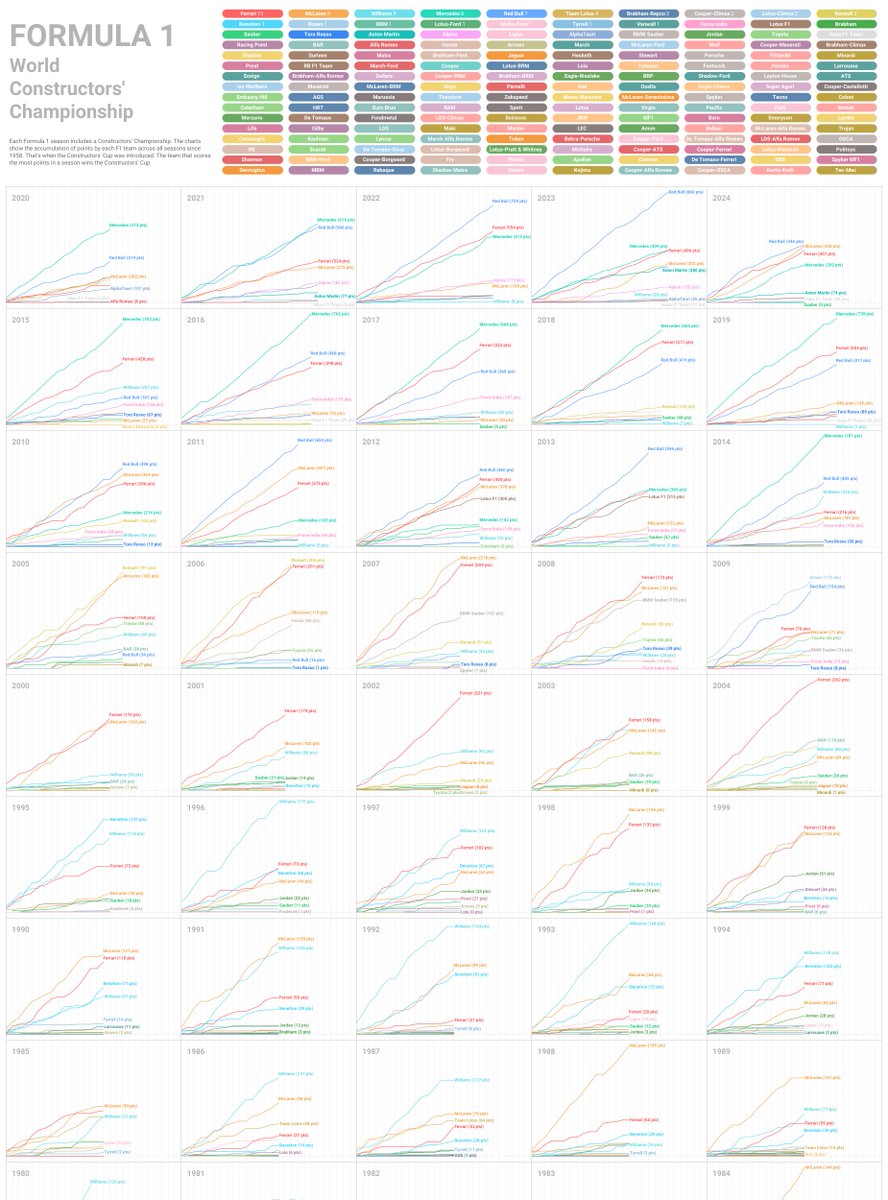
Created in @Tableau cumulative graphs of the
@F1 Constructors' Championship points and percentage graphs showing each team's share of points accumulated in a race.
#SportsVizSunday #tableau
public.tableau.com/app/profi…
public.tableau.com/app/profi…
3
1
24
1,128
Alex Varlamov retweeted

14 Jul 2024
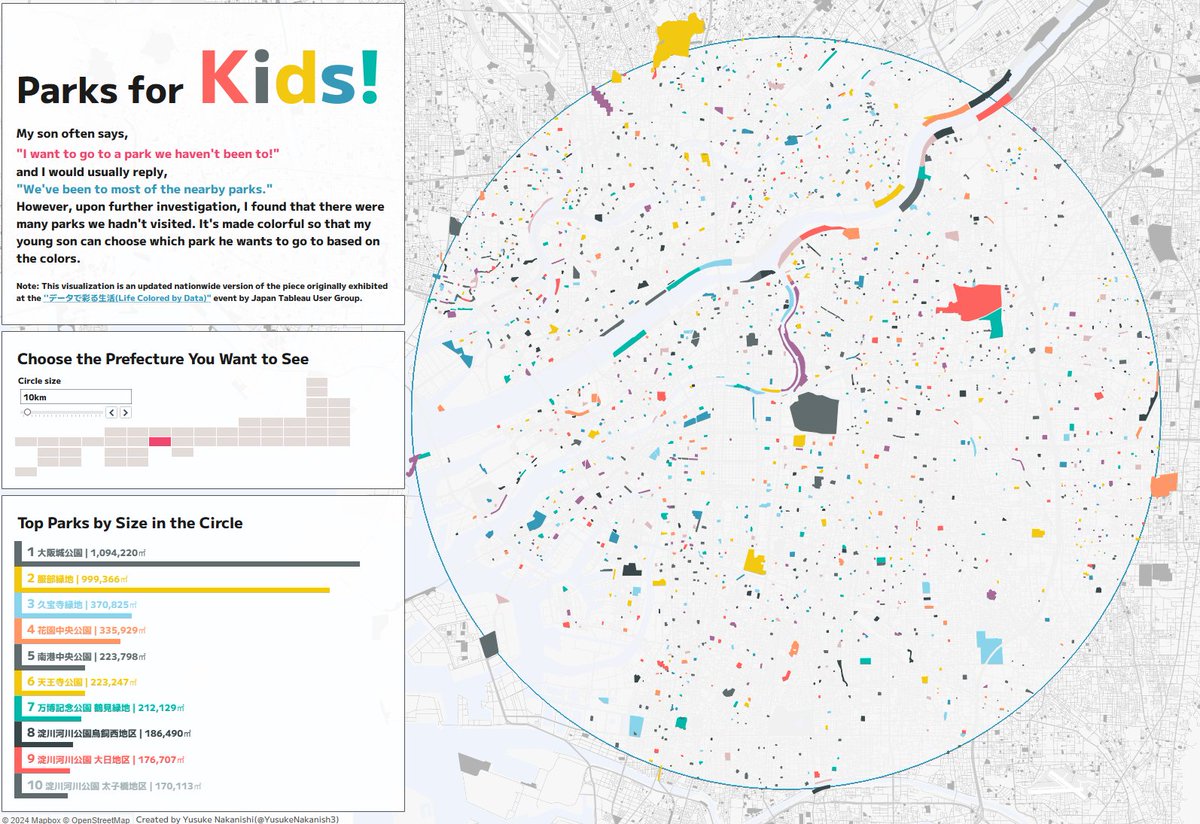
I created this park-finding Viz for my son who wants to visit parks we've never been to! It's an updated nationwide version of the Viz I originally exhibited at the JTUG "Life Colored by Data #データで彩る生活 " event.
#Tableau #datafam
Viz tabsoft.co/4bKPjJz
2
11
59
3,504

Vizzes so sharp, they're nothin' but net 🏀
Bounce over to @TableauPublic to check out these basketball data vizzes: tabsoft.co/3yQveUh
2
9
47
5,586
Alex Varlamov retweeted

26 May 2024
This week’s sunday-ta is full of beautiful visuals and Tableau tips. Featuring wonderful works made by @ta___kaya, @AlexanderVar7, @El_Dabrah, @fresh_gb 🔥
open.substack.com/pub/nasten…
#dataviz #datafam #dashboards #bi #tableau
3
3
7
890
Alex Varlamov retweeted

26 May 2024
Where are those icebergs? Had some fun with tanaka contours inspired by @AlexanderVar7. For #B2VB week 10.
public.tableau.com/views/B2V…
2
1
16
541
Alex Varlamov retweeted

26 May 2024
There's loads in this week's #SportsVizSunday write-up. Just the job for lying in the sun/on the sofa (depending on your weather) and tickling your eyeballs & brain cells.
Also, a brand new topic that I don't think we've ever had before!
🎾⚽️🏉🏀🏎️🏇
sportsvizsunday.com/post/wee…
2
5
17
1,194
Keep up with all the latest in Tableau Community content.
Data visualizations, tutorials, community projects, and more in this week's #DataFam Roundup: tabsoft.co/4dV59DF
6
16
53
11,427
Alex Varlamov retweeted

22 May 2024
Hi #datafam,
I'm for sure not the only one here who uses movie palettes📽️ when choosing viz colors. I made an interactive "color wheel" of the ones I liked best🤩By clicking on the palette, you recolor the graphs and get the HEX codes to copy.🧵 1/
Link: shorturl.at/BzXCC
14
20
122
7,717
19 May 2024
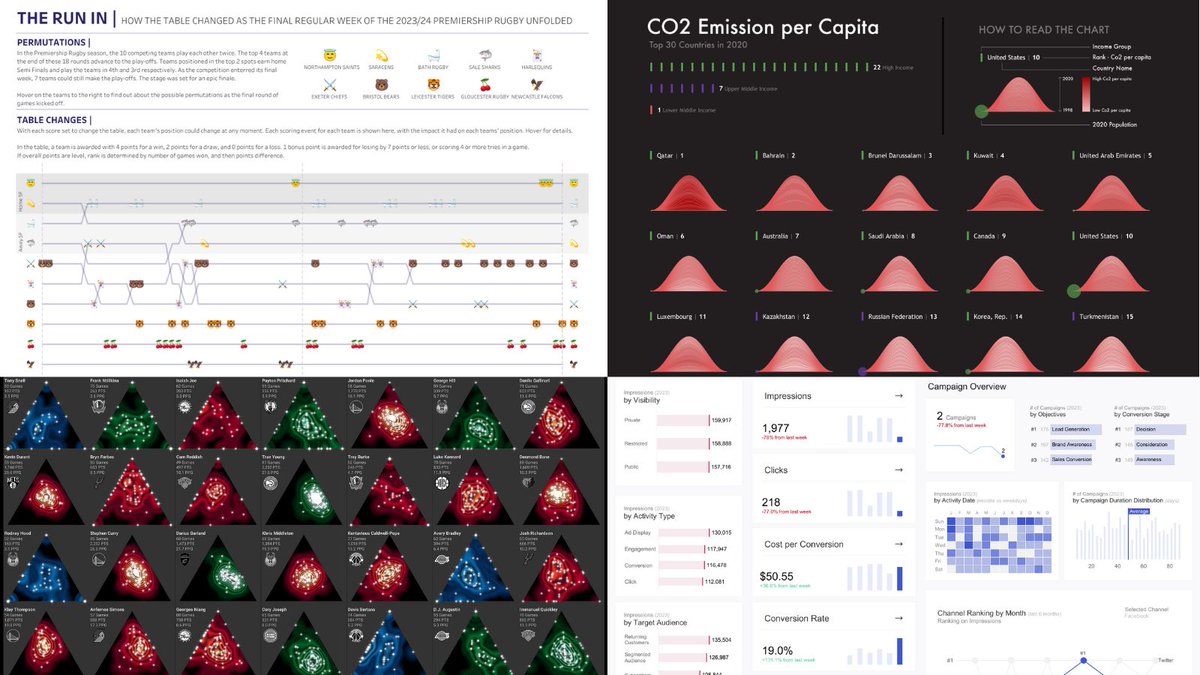
Here is my new #tableau viz 'NBA Gems' and submission for #SportsVizSunday #datafam.
The visualization includes Ternary Plots for NBA players across nearly 30 years, categorized by Offense, Defense, and Strategy.
public.tableau.com/views/NBA…
5
2
33
1,326
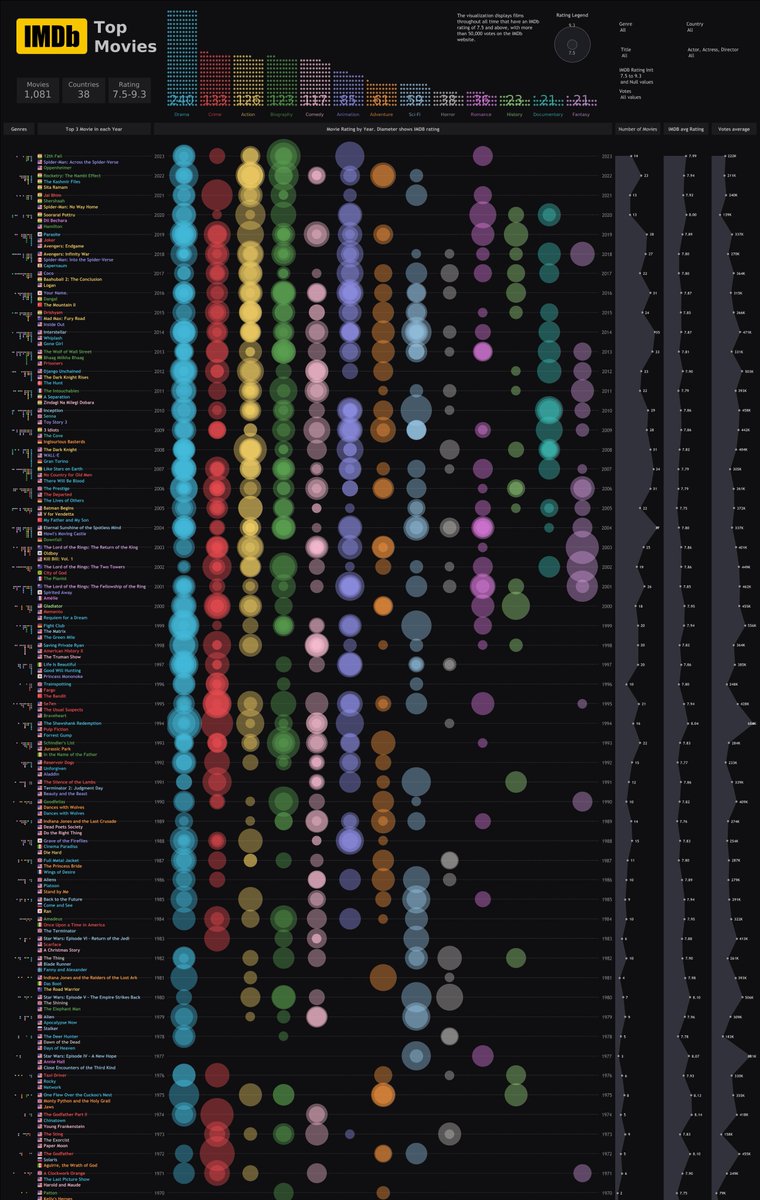
12 Mar 2024
My new #tableau visualization based on IMDb data provided by @tableau, @salesforce. The visualization displays movies with ratings of 7.5 and above, and with at least 50,000 votes, spanning over 100 years and including more than 1000 films. #datafam
public.tableau.com/views/IMD…
1
21
612
Alex Varlamov retweeted

2 Jan 2024
31
138
1,446
72,969
Alex Varlamov retweeted

24 Oct 2023
Introducing the latest Featured Authors cohort—all 83 of the 2023 Tableau Public Ambassadors.
These authors create and amplify interesting data stories, foster community, and provide feedback. Explore their outstanding work and follow to stay inspired. tabsoft.co/499wwrs
7
35
100
28,413
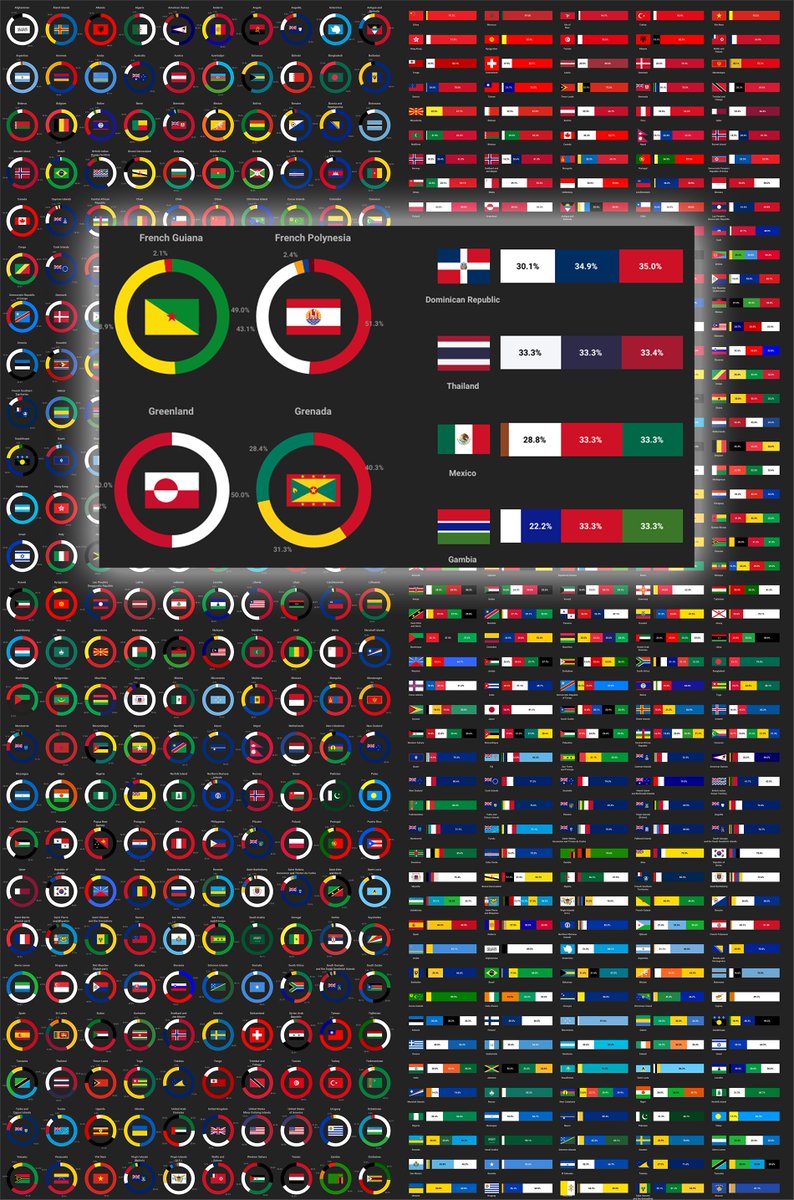
11 Oct 2023
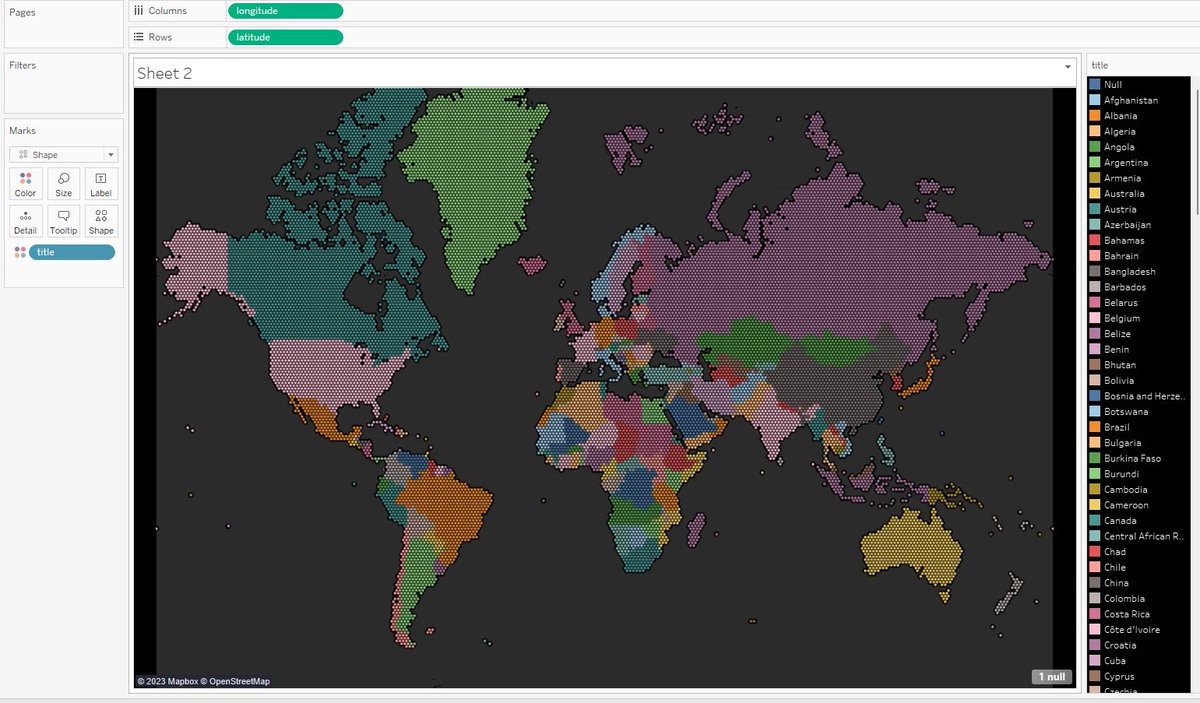
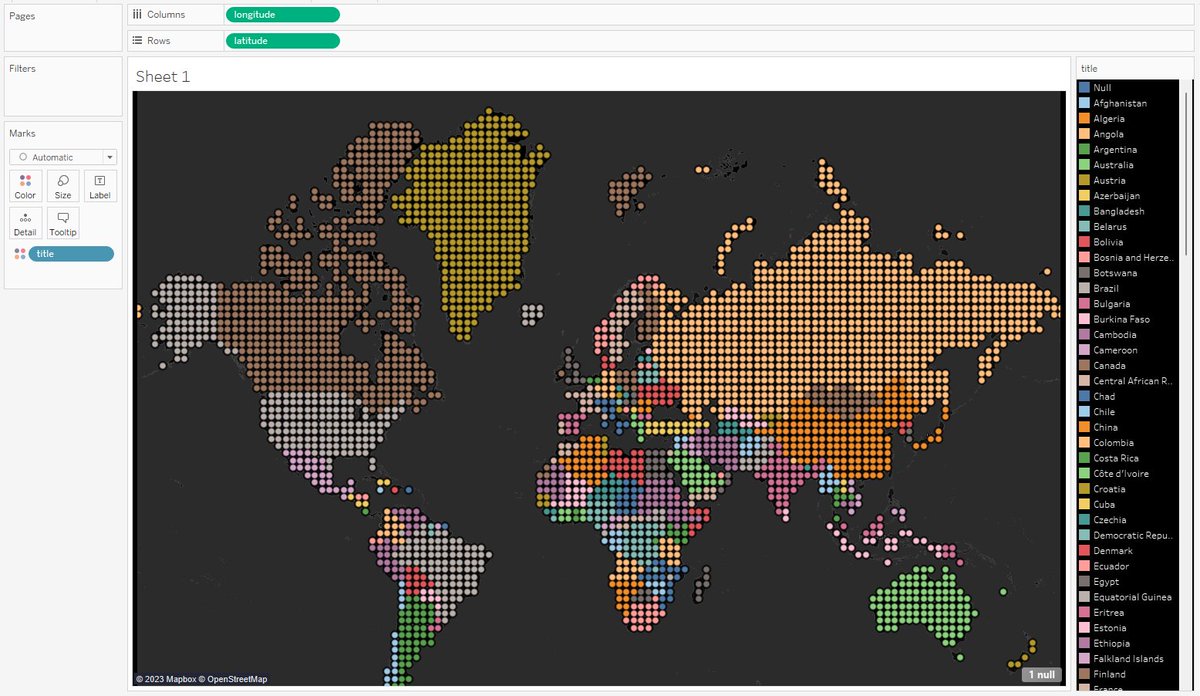
In my new #tableau visualization 'Global Flags: a Colorful World,' I present 250 flags of countries and territories where represented the percentage of colors for each flag.
The image processing script was written in #python
#dataviz #datafam
public.tableau.com/views/Glo…
1
14
2,444
27 Sep 2023
Absolutely amazing!
26 Sep 2023

New Viz 🏛️ The Roman Empire: Establishment 79BC-117AD
explore the emperors, cities, road system, and key events: 🔗public.tableau.com/app/profi…
Are you thinking about the #romanempire too? share your thoughts!
#datafam #tableau #DataVisualization #viz2eduacte
1
4
474