NASA's official Scientific Visualization Studio account, tweeting the best in NASA scientific visualization. We reveal the invisible by bringing data to life.
This account is going away! Love exploring our amazing visualizations? Not to worry! We'll still be sharing them to accounts like @NASAGoddard, @NASAEarth, and more, as well as svs.gsfc.nasa.gov.
ALT A conceptual animation showing solar wind interacting with Earth's magnetic field and causing atmospheric loss at the polar cusps.
Reminder: Just one week left until this account is archived. Find all our latest @NASA visualizations on our dedicated visualization page. svs.gsfc.nasa.gov
Important update: This X account will soon be deactivated. Don't worry, you can find all the latest visualizations from @NASA at our dedicated visualization page: svs.gsfc.nasa.gov/
ALT This animated GIF shows what we might see if we looked at two black holes through the disk of gas that is swirling around them. The gas is bright orange close to the black holes and fades out to shades of purple farther out.
Record August temperatures confirmed summer 2023 was the hottest summer (June, July, August) in @nasa’s temperature record, by a large margin.🥵
These record-breaking months continue a long-term warming trend due to human activities. go.nasa.gov/3PhidYw
ALT Line graph with monthly temperature anomalies from each year from 1880 to 2023 growing across the graph to create a stacked bell shape. The Y-axis is labeled negative 3 degrees Celsius to 3 degrees Celsius and the X-axis has each month from January to December labeled. As time goes on, the curved lines seem to stack higher and higher, and the colors of the lines change from white and light blue to light red, and then dark red. Finally, the 2023 line stops at August, the latest month we have data for, and it’s visible that June, July, and August 2023 were all hotter than any previous respective month.
Las temperaturas récord de agosto confirman que el verano meteorológico (junio-agosto) del hemisferio norte de 2023 fue el más caluroso en el registro de temperaturas de @NASAEarth, por un amplio margen.
go.nasa.gov/3RpWEaT
Summer 2023 was the hottest summer in NASA’s record, continuing a trend of long-term warming caused by human activity.
All three summer months broke heat records: go.nasa.gov/48cqdmn
This is so cool - I definitely need to add this to my talks on climate data viz 😄
"With each projection, the distortions of these circles show how shape and area are distorted in different parts of the projection."
Created by @NASAViz: svs.gsfc.nasa.gov/5090
Sea levels around the world are rising – and at an accelerating rate – as a result of human-caused global warming. 🌊
Global sea levels have risen about 10 centimeters from 1993 to 2022, as seen in this @NASAViz animation.
Get the @NASAClimate data: go.nasa.gov/3NUa5wg
ALT Animation of blue ocean water level rising from 1993 to 2022. A vertical line shows change in sea level in increments of 10 centimeters and 5 inches. The animation starts in 1993 and, as it continues, the water ebbs and flows but continues an overall rising trend until the animation ends in 2022. By the end, the water level has risen just over 10 centimeters from where it started.
Congrats to @NASAViz! Their stunning depiction of OSIRIS-REx's trajectory in “A Web Around Asteroid Bennu” emphasizes the intricate navigation in collecting a sample from the asteroid Bennu, and will be shown at the SIGGRAPH awards on Aug. 8-9! 🏆
youtube.com/watch?v=nx1r3HPG…
Recently, @NASAWebb released its first images after launching on December 25, 2021.
JWST now orbits the Sun, 1.5 million kilometers (1 million miles) away from our planet. ☀️ 🔭
See its orbit and the path it took to get there: svs.gsfc.nasa.gov/4991
ALT Submission deadline extended for IEEEVis 2022 Conference Workshop on High-impact Techniques for Visual Climate Science Communication #Viz4Climate. The workshop will be on 17th October from 2-5pm CDT in hybrid format.
ALT We are running a workshop on High-impact Techniques for Visual Climate Science Communication at the IEEEVis 2022 Conference to be held in Oklahoma City in hybrid format on 17th of October 2022 from 2 to 5 pm CDT. Only 2 days left to submit your art, research or applications that involved climate data. Due date is 17th of July. Read more on how to submit on our website: https://svs.gsfc.nasa.gov/Viz4Climate
Hey @NASASolarSystem, ready for your close-up? As part of Webb’s prep for science, we tested how the telescope tracks solar system objects like Jupiter. Webb worked better than expected, and even caught Jupiter’s moon Europa: blogs.nasa.gov/webb/2022/07/…
ALT Jupiter dominates the frame, appearing to glow with bands of bright white, light yellow, and darker, brownish oranges. The stripes circle the planet, with one especially thick bright band across the planet’s center. A spot of glowing bright white interrupts the darker brown band about a third from the bottom of the planet. To the left of Jupiter, Europa appears as a tiny, black circle with a bright starburst erupting from its edges. The background of the image is pure black.
ALT Ed Hawkins is a keynote speaker at IEEEVis 2022 Workshop on High-impact Techniques for Visual Climate Science Communication to be held in Oklahoma City in hybrid format on 17th of October 2022 from 2 to 5 pm CDT. Submit your science data visualization, art, research, or applications by 17th July.
Hundreds of new stars.
Examples of bubbles and jets created by newborn stars.
Galaxies lurking in the background.
@NASAWebb Deputy Project Scientist Amber Straughn details new discoveries about Carina Nebula. nasa.gov/webbfirstimages#UnfoldTheUniverse
Better together. International collaboration gave us the most powerful space telescope ever made, and the deepest infrared views of the universe ever seen. With our partners at @ESA and @CSA_ASC, the science can begin. Together we #UnfoldTheUniverse: go.nasa.gov/3azyGqM
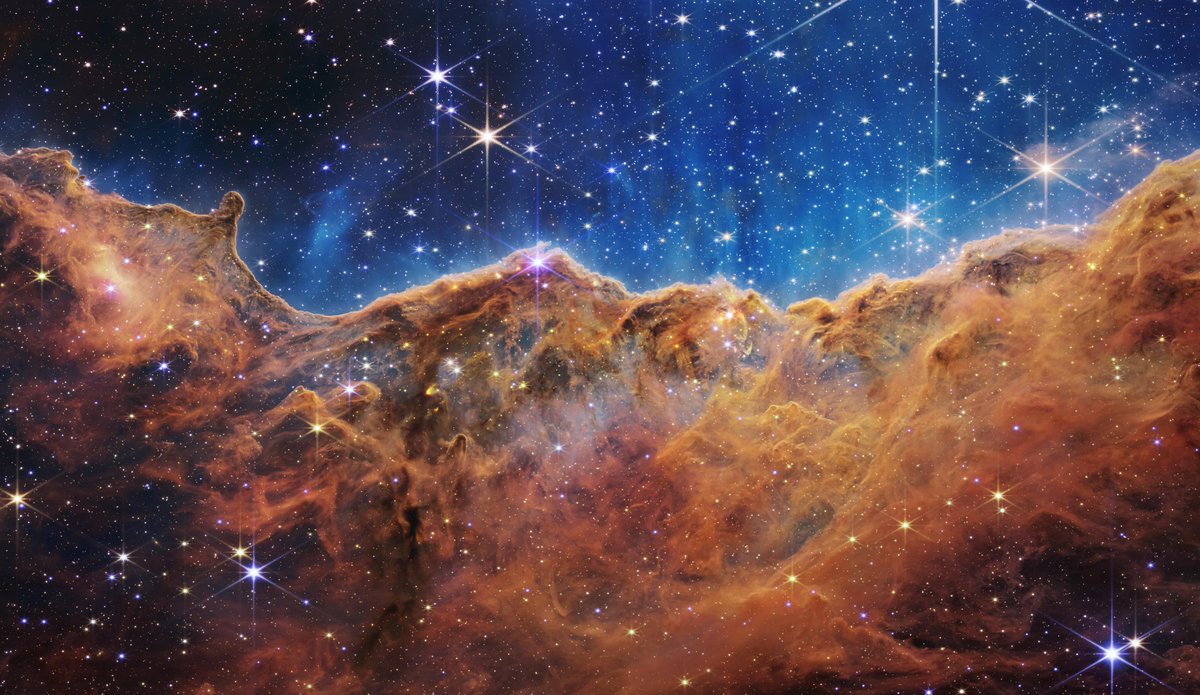
ALT The image is divided horizontally by an undulating line between a cloudscape forming a nebula along the bottom portion and a comparatively clear upper portion. Speckled across both portions is a starfield, showing innumerable stars of many sizes. The smallest of these are small, distant, and faint points of light. The largest of these appear larger, closer, brighter, and more fully resolved with 8-point diffraction spikes. The upper portion of the image is blueish, and has wispy translucent cloud-like streaks rising from the nebula below. The orangish cloudy formation in the bottom half varies in density and ranges from translucent to opaque. The stars vary in color, the majority of which, have a blue or orange hue. The cloud-like structure of the nebula contains ridges, peaks, and valleys – an appearance very similar to a mountain range. Three long diffraction spikes from the top right edge of the image suggest the presence of a large star just out of view.
It's here–the deepest, sharpest infrared view of the universe to date: Webb's First Deep Field.
Previewed by @POTUS on July 11, it shows galaxies once invisible to us. The full set of @NASAWebb's first full-color images & data will be revealed July 12: nasa.gov/webbfirstimages
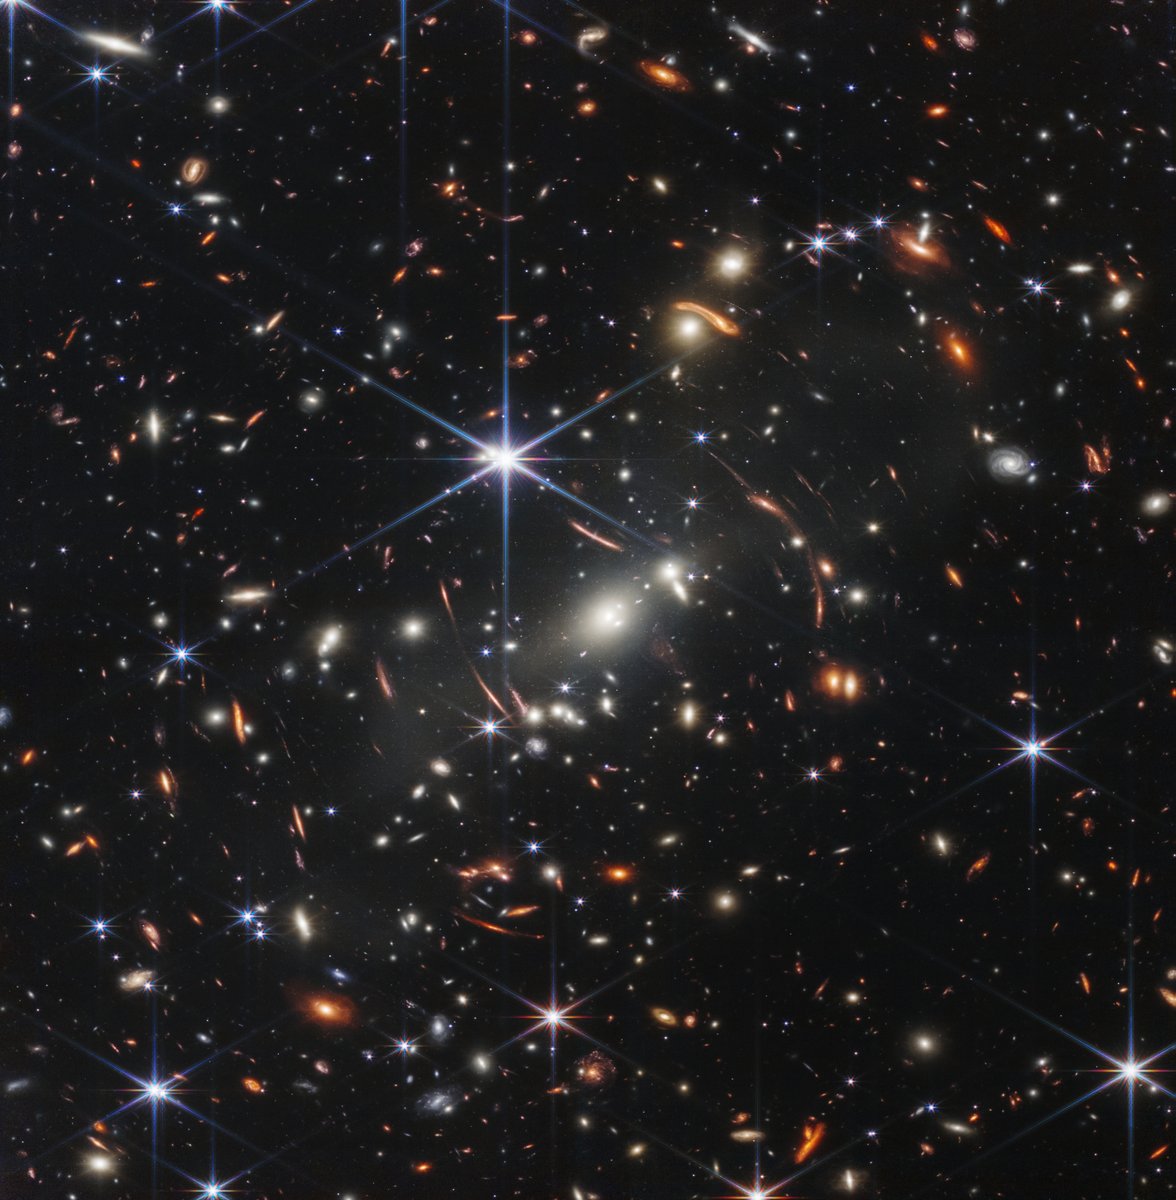
ALT The background of space is black. Thousands of galaxies appear all across the view. Their shapes and colors vary. Some are various shades of orange, others are white. Most stars appear blue, and are sometimes as large as more distant galaxies that appear next to them. A very bright star is just above and left of center. It has eight bright blue, long diffraction spikes. Between 4 o’clock and 6 o’clock in its spikes are several very bright galaxies. A group of three are in the middle, and two are closer to 4 o’clock. These galaxies are part of the galaxy cluster SMACS 0723, and they are warping the appearances of galaxies seen around them. Long orange arcs appear at left and right toward the center.
ALT The deadline for submissions for the Viz4Climate workshop is approaching fast. For those interested, submission for climate data visualisation related work is open until 17th July, 2022
ALT We have planned a diverse panel discussion at our IEEEVis 2022 workshop this October on "High-impact Techniques for Visual Climate Science Communication". Come join and participate! For those interested, submission for climate data visualisation related work is open until 17th July, 2022
Research ships measured populations of Prochlorococcus, the smallest and most abundant phytoplankton type. 🚢
However, their numbers dropped off as the ships sailed north in the Pacific, likely due to a predator-prey relationship with other organisms. go.nasa.gov/3ysPRDw