
Biostatistician - @aberdeenuni - 76 69 65 77 73 20 65 78 70 72 65 73 73 65 64 20 61 72 65 20 6d 79 20 6f 77 6e
Joined March 2010
- Tweets 3,191
- Following 343
- Followers 644
- Likes 850
42 Photos and videos


Pinned Tweet

6 May 2020
Interested in learning #RStats? We've now made our @UoABioSci 'Introduction to R' book open access. 350 pages covering all the basics as well as using Rmarkdown and Git. Fantastic collaboration with @DeonRoos88 @Frances_Mancini @AnaSofiaCouto @lusseau alexd106.github.io/Rbook/
9
233
440
Alex Douglas retweeted

13 Jul 2024
Polish mountaineer scaled his country's highest peak, Rysy, which is 2,499 metres (8,199 feet) high and found a cat.
[📹 Wojtek Jabczyński]
x.com/i/status/1812168760758…
86
238
2,390
172,843
Alex Douglas retweeted

18 Jun 2024
📢PhD position on microbial ecology currently open for applications: " Ecological and evolutionary dynamics of sponge-associated microbial communities" on FindAPhD.com. Please check our website for more info as well: gubry-rangin.com

1
57
121
15,700
Alex Douglas retweeted

6 Jun 2024
One of my favorite recent papers is Kane (2024).
While pitched (effectively and usefully) as a paper about compelling null results, many of the action items are ways to boost power.
IMO, it provides a great checklist to make sure you're maximizing power.
CC: @UptonOrwell
2
49
226
32,359
Alex Douglas retweeted

4 Jun 2024
6
578
2,831
439,292
Alex Douglas retweeted

3 Jun 2024
"Don’t be steamrollered by clinicians"
Working life for some medical statisticians can feel like playing second fiddle, according to our latest free-to-read article: ow.ly/1ql250S6Mgz
#statistics #freetoread
1
8
17
2,234
Alex Douglas retweeted

5 Jun 2024
In @quarto_pub, use these options to fold long code blocks with a custom message:
#| code-fold: true
#| code-summary: "Your message here"
This is particularly useful for code-based blog posts.
See an example here: walker-data.com/posts/shiny-…
#rstats
8
60
3,917
Alex Douglas retweeted

3 Jun 2024
Statisticians chuckle, but I've seen doctors gleefully log(1 y) and then fit lines through that log-swamp garbage and then get published in The Lancet so who's laughing now
Seriously log(1 y) bad - model the data generating process. An area where ecologists do well actually!
1 Jun 2024

log(0) = {Drop it, Scale it, Reform it, Invert it, Group it, press it, snap it, work it, quick erase it} or maybe what these authors do instead? @dggoldst
academic.oup.com/qje/article…
10
34
313
62,677
Alex Douglas retweeted
3 Jun 2024
The pace of innovation in data science is astounding (and I'm not talking about AI!)
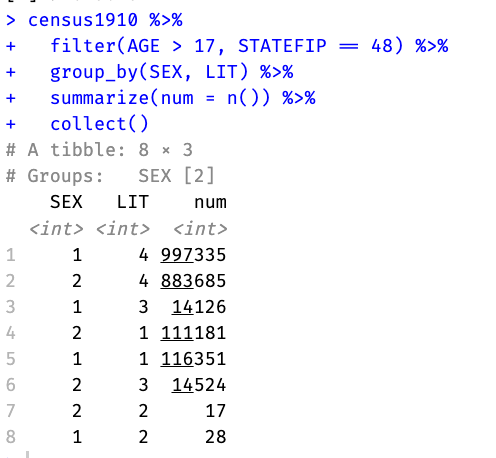
2 years ago, I wrote in my book about analyzing a 92 million row @ipums CSV file using a database in #rstats
Now: just point `arrow::open_dataset()` at it and ` collect()` what you need!
7
22
251
63,315
Alex Douglas retweeted

1 Feb 2024
#rstats PSA: Reminder to all R users on Ubuntu that you can quickly and easily install CRAN binaries with the amazing #r2u from @eddelbuettel. I just had to setup a new Ubuntu 22.04 machine, and it was as easy as
sudo bash add_cranapt_jammy.sh
github.com/eddelbuettel/r2u
1
10
46
3,808
Alex Douglas retweeted

12 Oct 2023
(thread)
Old joke about a new VC shared on our committee list: On his first day in office, he finds a letter on his desk from his predecessor and three numbered envelopes. The letter says, 'You will encounter crises in this job. When they arrive, open these letters in turn'
7
100
357
106,710
Alex Douglas retweeted

17 Nov 2023
Delighted to announce that in a recent visit to China we have developed a postgraduate training partnership with the Xianghu Lab in Hangzhou where we will share approaches in science to address food security and environmental change @UoABioSci

5
6
24
1,666
Alex Douglas retweeted

10 Nov 2023
.
How the Big Five Academic Publishers Profit from Article Processing Charges
Spoiler alert : Their revenue was over US$ 1 billion between 2015-2018
A recent paper looks at the "big 5" publishers (@ElsevierConnect, @Sage_Publishing, @SpringerNature, @tandfonline and @WileyGlobal) and estimates their revenue from Article Processing Charges (APCs).
Here are the messages we took from the paper:
1⃣ Between 2015-2018 it is estimated that authors paid $1.06 in publication fees to these five publishers.
2⃣ Springer-Nature made the most revenue ($588.7 million) followed by Elsevier ($221.4 million), Wiley ($114.3 million), Taylor & Francis ($76.8 million) and Sage ($31.6 million)
3⃣ The data was collected from @Clarivate, @unpaywall, open datasets of APC list prices and historical prices retrieved from @waybackmachine.
4⃣ The APC's used in their calculations were based on those used in the year the paper was published. This is to be applauded. It would have been MUCH easier to take the current APC's but this would over estimate the revenue.
5⃣ To give an example of how the APC's could have been over estimated, a Wiley journal, in 2015 charged $3,000. In 2023, the fee is $4,020. If you used today's fee for a 2015 article the over estimate would be 34%.
6⃣ The number of #OpenAccess articles over the four year period of study (2015-2018) increased from 91,375 articles in 2015 to 153,746 articles in 2018.
7⃣ Over the four-year period studied, it is estimated that Scientific Reports obtained $105.1 million in APC's and Nature Communications obtained $71.1 million. These journals are both published by Springer-Nature.
8⃣ The high income of Scientific Reports can be partly explained by the fact that it published 73,206 articles.
9⃣ Three Springer-Nature journals had the highest average APC's; Diabetes Therapy ($5,478), Infectious Diseases and Therapy ($5,295) and Rheumatology and Therapy ($5,169)
🔟The three countries that paid the largest amounts of APC's were USA, $184.7 million; China, $148.0 million and the UK ($134.6 million)
You can access the article here: doi.org/10.1162/qss_a_00272
Tag: @mitpress | @LeighkButler | @l_matthia | @marcandresim | @philippemongeon | @stefhaustein

7
120
201
168,366
Alex Douglas retweeted

9 Nov 2023
“You need 16 times the sample size to estimate an interaction than to estimate a main effect,” explained
statmodeling.stat.columbia.e…
6
121
516
152,060
Alex Douglas retweeted

29 Oct 2023
Please RT - Funded #PhD opportunity in my group studying nanoplastic particles and their ecological and evolutionary significance in replicated whole ecosystems. With @Howbeer @TomOMcDonald and Steve Morris @DefraGovUK as case partner. Deadline Jan 8th findaphd.com/phds/project/ec…
14
10
2,266
Alex Douglas retweeted

25 Oct 2023
I've been writing R code daily for >15 years and just today learned of strrep (base #Rstats)
7
30
297
24,417
Alex Douglas retweeted

9 Oct 2023
Statistics 110: Probability by Harvard University.
Inarguably, one of the best probability courses on the web and it's Free!
youtube.com/playlist?list=PL…

3
218
784
103,740
Alex Douglas retweeted

9 Oct 2023
IBM is offering 12 Online Coding Courses 🔥🔥
🐍 Python
🧑💻 Data Science
✨ SQL
💽 NoSQL and DBaaS
📈 Statistics
🧠 R Programming
🧙 Data Analytics
🚀 Artificial Intelligence
Open this to not miss your chance 🧵👇
26
365
1,071
186,181
Alex Douglas retweeted

9 Oct 2023
Our paper debunking the 2020 cancer microbiome results is now published, in @mbiojournal. We'll see if @nature (or the authors) will retract these deeply flawed results. h/t @ProfBootyPhD @EricTopol journals.asm.org/doi/10.1128…
20
229
746
250,436
Alex Douglas retweeted

9 Oct 2023
Those damn outliers
We talk about them a lot, but are they really that harmful?
Let's explore them visually 👇
By definition, outliers are data points that are very different from most of the data.
We sometimes call them extreme values.
But how do you define 'very different'?
There is no exact measure to tell which data is extreme.
Sometimes outliers are invalid data or errors, but they can also be the focus of analysis. (Anomaly detection)
Do you feel confused?
You should, because this is a territory of data science where no one can tell you the universal truth. Cause there is no such thing.
Outliers must be defined during the analysis with some domain knowledge. What is an outlier in Finance can be an important value in Medicine.
They have a big impact on analysis, especially when it comes to measures like the mean. Thus, it is important to identify them in every project.
But some good news
With visualizations, we can easily spot outliers!
Below you can find the scatterplot of the connection between X and Y. On this scatter, 3 data points got lost. They are probably outliers.
I also added two raincloud plots not just because they are fancy.
Look at the plot for X, if you only observe this chart you will never find those 3 points.
When you look at Y, they will show themselves. That's why we need to include different angles and points of view in our analysis!
Be careful, those damn outliers are all around us!
___
I hope you've found this Tweet helpful.
In this series, I share my notes from the book Practical Statistics for Data Scientists by Peter Bruce, Andrew Bruce, and Peter Gedeck.
Like/Retweet for support and follow @levikul09 for more Data Science content.
Thanks 😉
8
101
563
118,692