
Joined February 2022
- Tweets 357
- Following 342
- Followers 2,832
- Likes 2,103
158 Photos and videos


Pinned Tweet

May 13
13/05/2026.. I have updated my portfolio with some of my latest work😄. Check it out at mutheemary.vercel.app.. I look forward to maintaining with regular updates .
#GIS #geospatial
1
15
498
Jun 9
Check out some of the projects and activities I have been working on as part of my #masters #studies
#geospatial #EMCDE #GIS #EO

Today's #student spotlight #highlights Mary #geospatialdata #scientist #Kenya visit her #ePortfolio marymuthee.vercel.app/engage… Erasmus Mundus Joint Master #EMJM co-funded by the European Union master-cde.eu COPERNICUS MASTER IN DIGITAL EARTH #universitätsalzburg #UBS #UPOL

2
7
141
May 3
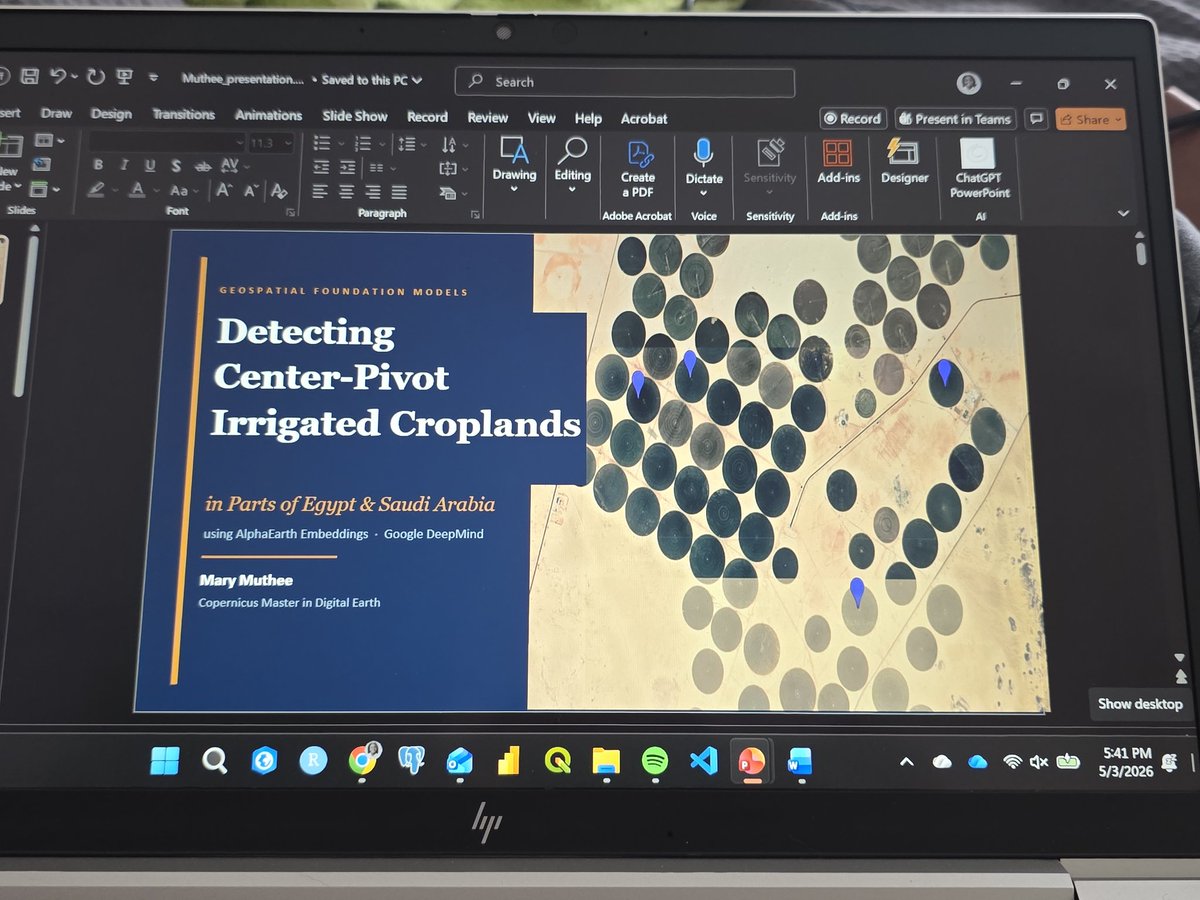
Sometimes the #story starts with just circles on a #map.
What looks simple from above is actually a deeper story of land patterns and understanding how we can use #geospatial #AI to understand the stories.
#google #satellite #embeddings
3
23
919

Mar 5
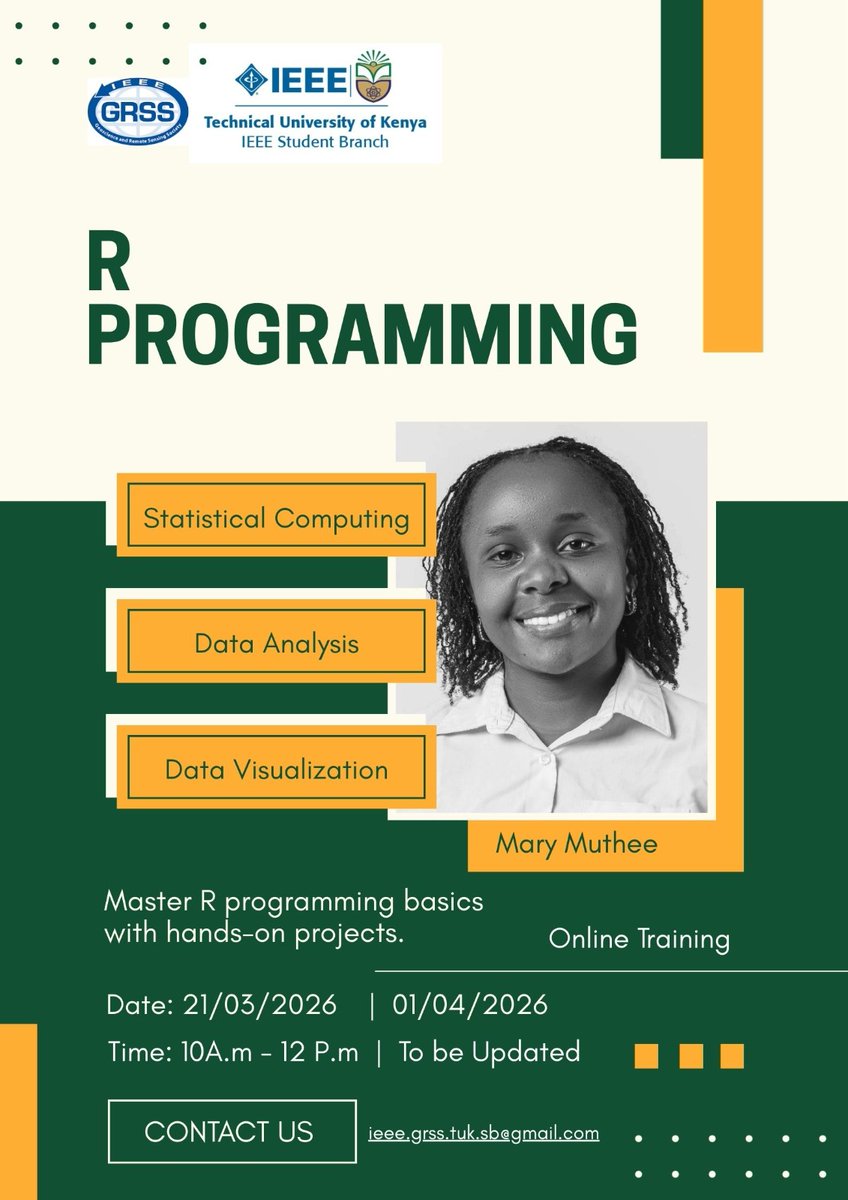
Join us on 21/03/2026 for a hands on-training on R ,The training will be beginners friendly.
Registration link- forms.gle/Wen8fhYenfWDPjqX8
#geospatial #R #GIS #GeoAI
11
144
540
30,625
12 Dec 2025
2025 #Wrapped in a #geospatial way.
Talks. Trainings.Capacity building. #Community engagement. Grateful for every #space where #geospatial knowledge turned into real impact! #onwards and #upwards 🌎
#GIS #gischat
2
7
33
1,261
21 Nov 2025
I'm doing an eye tracking analysis to help improve more on this infographic.
Anyone can take part in the test process.
link to the survey-app.realeye.io/test/f476cac8…
#gischat #geospatial #GISDAY
20 Oct 2025

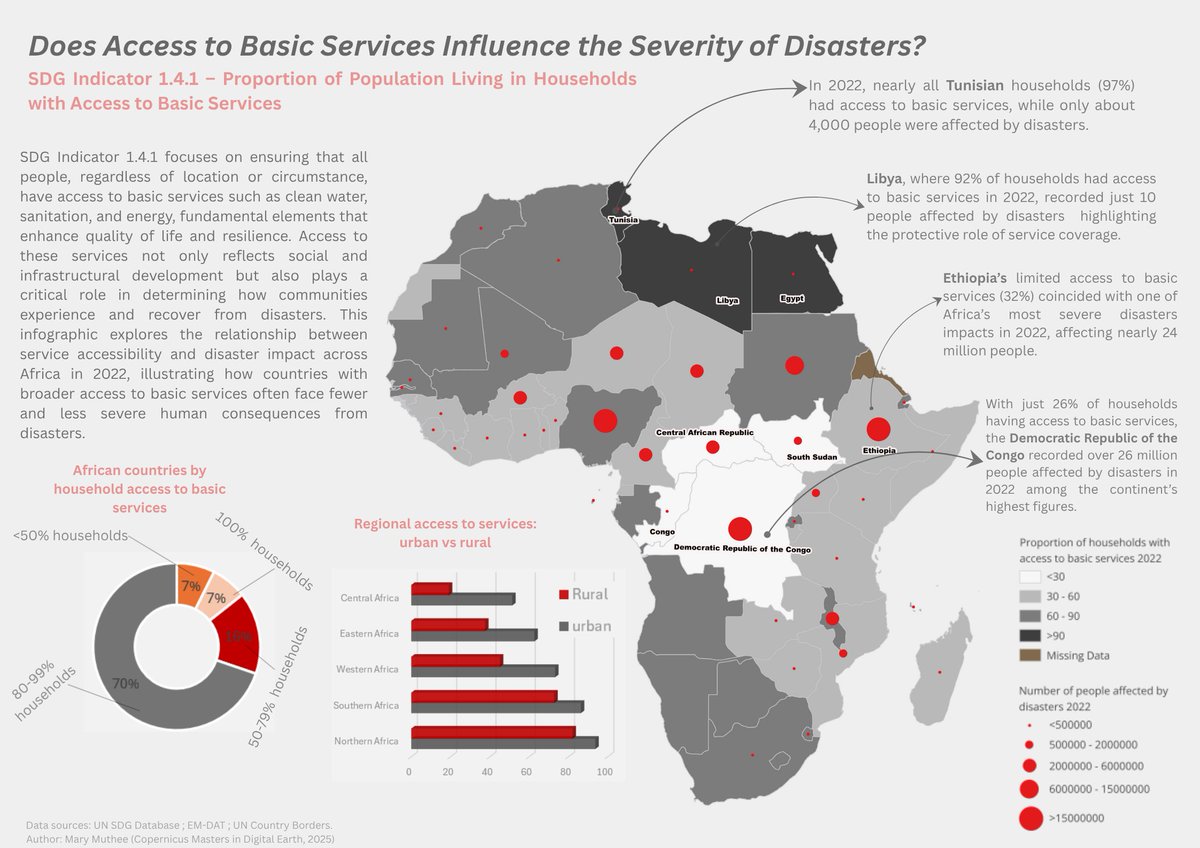
20/10/2025..As a way of using #cartography in storytelling, I explored #SDG 1 (Indicator 1.4.1) and linked it to #disasters.
Does access to #basic #services affect disaster severity?
I overlaid the two layers to visually inspect the relationship and to show how access to basic services is distributed across #Africa.
Tools used:
1.R – #Data preprocessing and cleaning
2.QGIS – #Map design and #spatial visualization
3.Excel – Chart creation and #statistical breakdowns
3.Canva – #Infographic layout and
#storytelling
#geospatial #gischat
3
17
1,530
8 Nov 2025
Recently,a #landslide occured in #Elgeyo Marakwet #Kenya. Using using #Sentinel-2 L2A (#SWIR) data on the #Copernicus #browser, I created a timelapse comparing #imagery from 19 October (before) and 6 November 2025 (after) to visualize the impact.
This shows how #EO data can be used in disaster assesments.
#gischat #geospatial #EO
1
8
564
31 Oct 2025
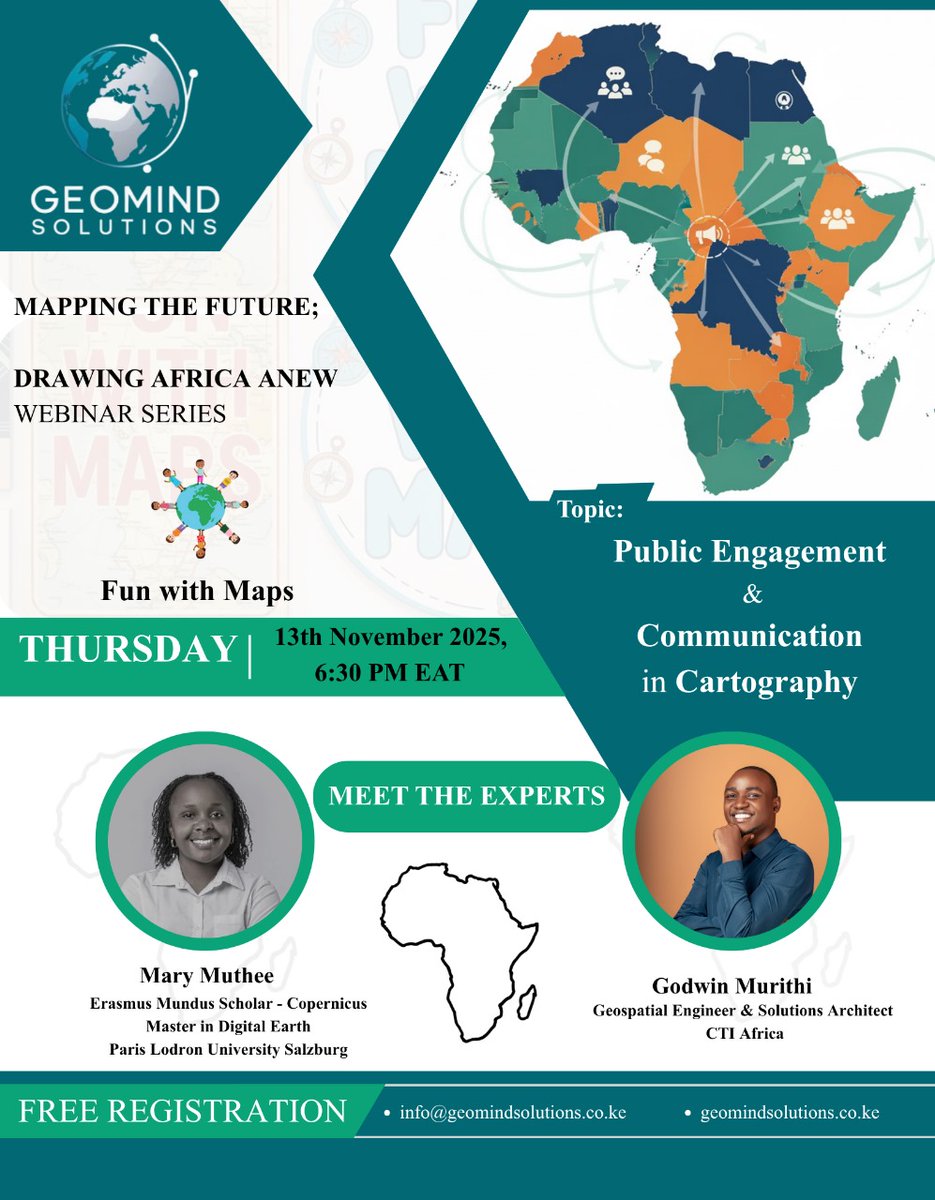
On 13th November 2025,I will be joining GeoMind solutions webinar as a #speaker for the "Mapping the Future: Drawing Africa a New Webinar Series"
We will be discussing on public engagement and communication in #Cartography, a key part of how to tell #Africa's stories through #maps
#geospatial #gischat
Registration link- shorturl.at/RmBYa
10
37
1,767
20 Oct 2025
20/10/2025..As a way of using #cartography in storytelling, I explored #SDG 1 (Indicator 1.4.1) and linked it to #disasters.
Does access to #basic #services affect disaster severity?
I overlaid the two layers to visually inspect the relationship and to show how access to basic services is distributed across #Africa.
Tools used:
1.R – #Data preprocessing and cleaning
2.QGIS – #Map design and #spatial visualization
3.Excel – Chart creation and #statistical breakdowns
3.Canva – #Infographic layout and
#storytelling
#geospatial #gischat
5
19
114
6,335
8 Oct 2025
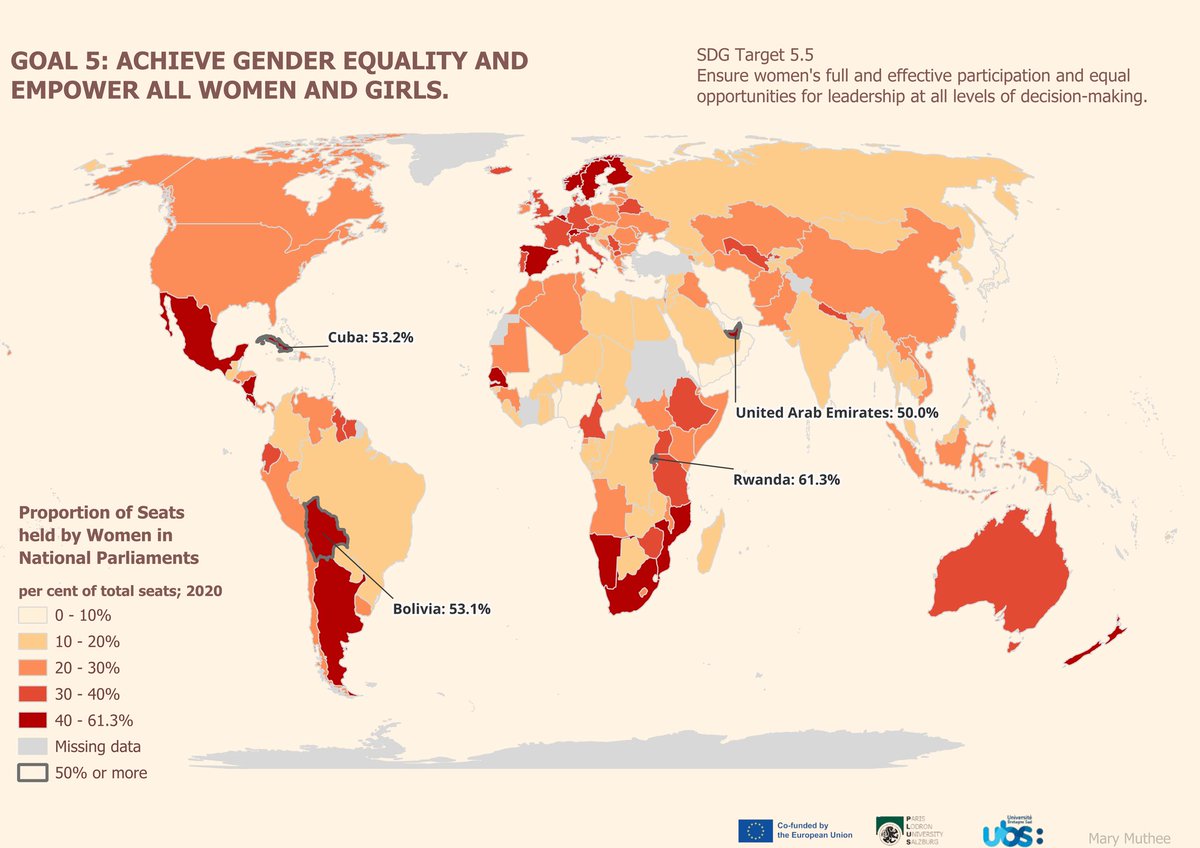
I mapped this dataset using #QGIS with data from the #UN SDG 5.5.1 indicator on women’s representation in national parliaments (2020).
It’s striking how #geography reflects progress some regions showing strong inclusion, others still catching up.
As a #geospatial specialist, I find it powerful how #maps can turn statistics into stories helping visualize equality, or its absence, at a glance.
8 Oct 2025
3
15
1,083
8 Oct 2025
1
3
18
2,150
6 Oct 2025
2
39
1,247
4 Sep 2025
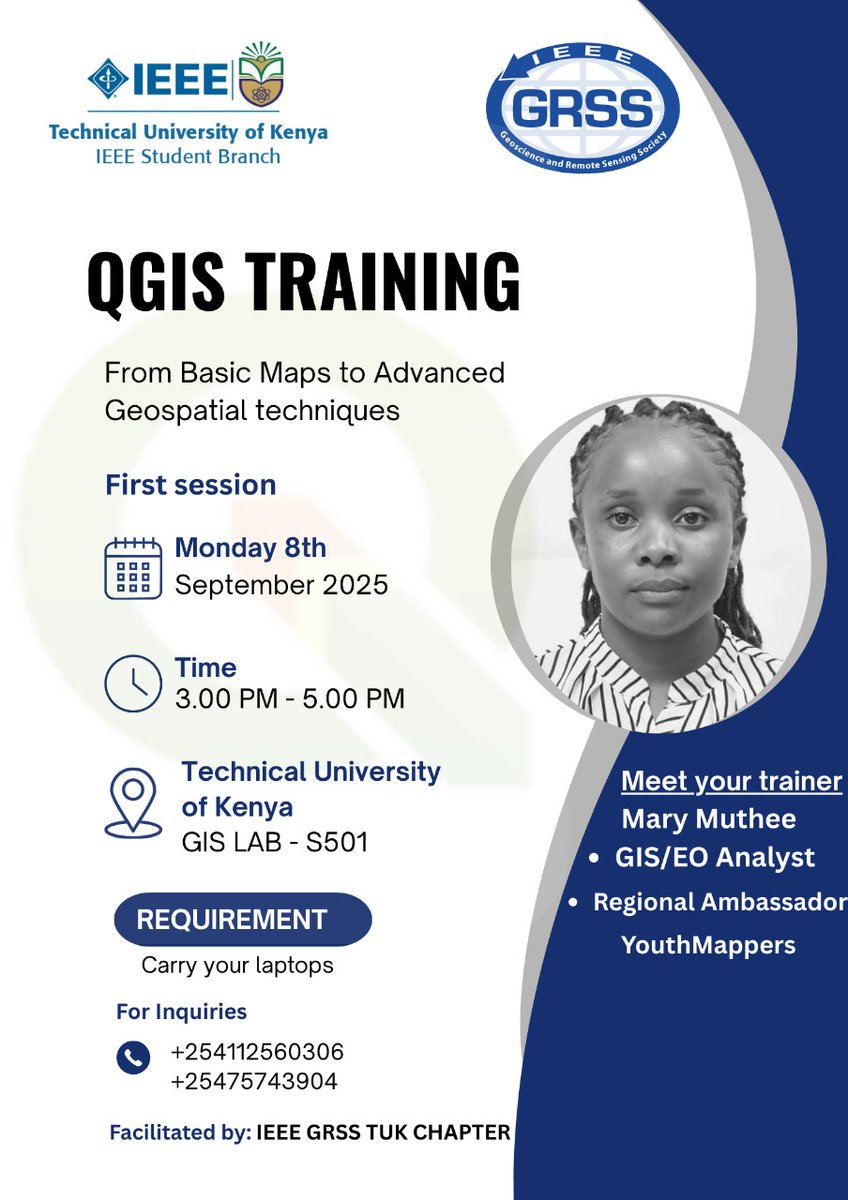
4/09/2025..Next week from 8th to 10th and 17th to 20th,I will be training @TU_Kenya #geospatial students on QGIS. Excited about it all!
#QGIS #GIS #geospatial
8
28
172
5,187
23 Aug 2025
23/08/2025. We just concluded our second session of the #Google #Earth #Engine training! A big shout-out to all those who joined us! See y'all in the next one! @youthmappers @Kip__Emmanuel
#geospatial #YouthMappers #GIS #RemoteSensing

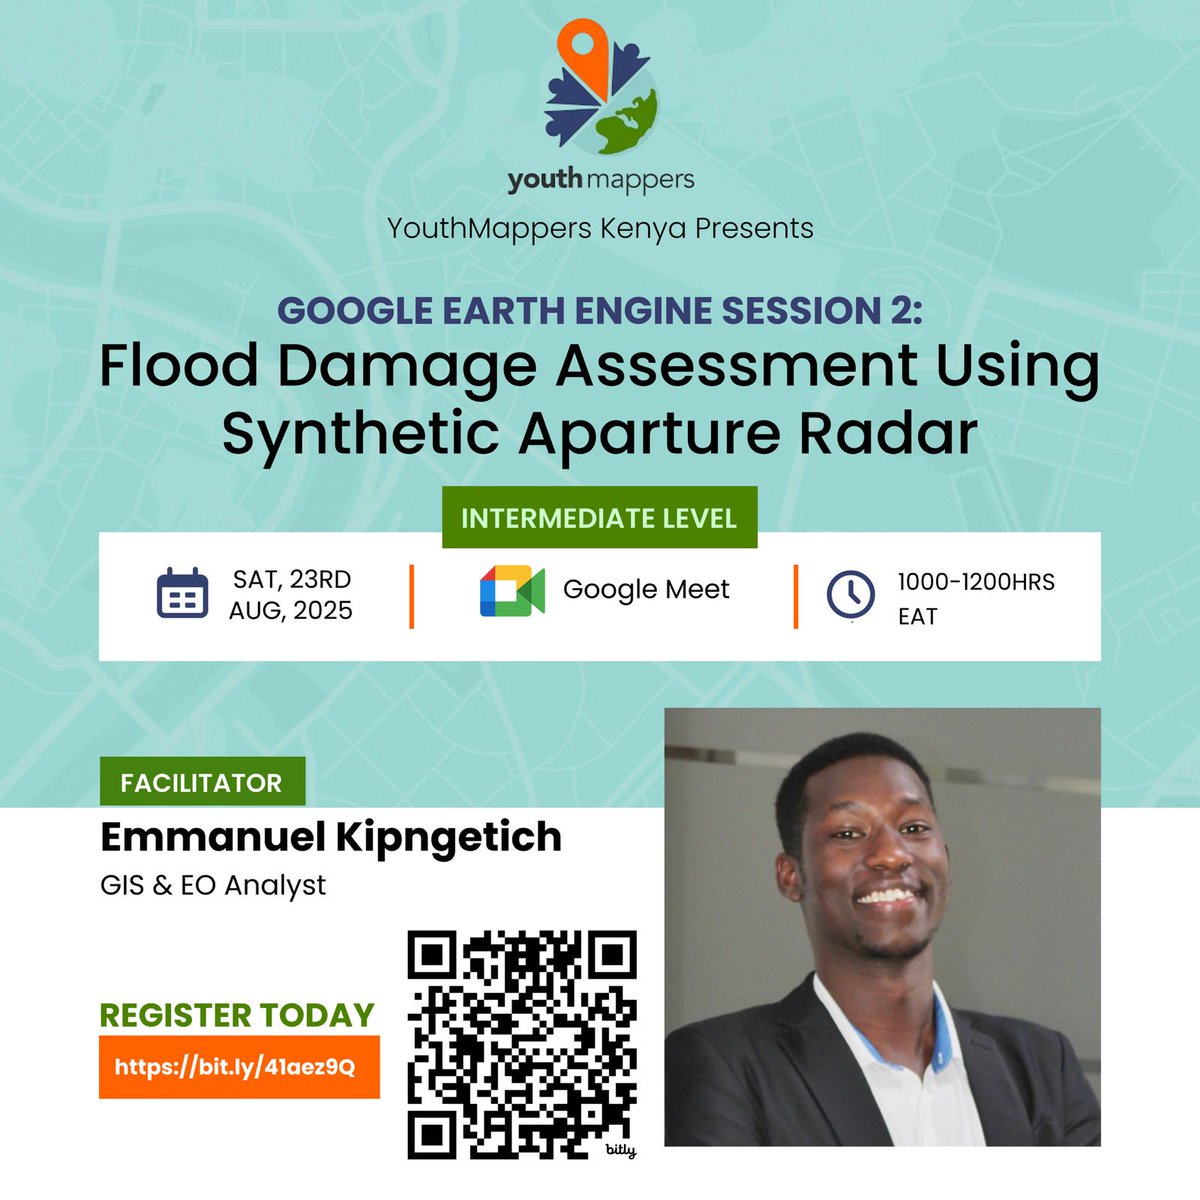
19 Aug 2025
Our 2nd #Google #Earth #Engine session is happening this Saturday! @Kip__Emmanuel will be our facilitator!
Level: Intermediate & above
Looking forward to seeing you all! @youthmappers
Register here: docs.google.com/forms/d/e/1F…
#geospatial
3
12
59
2,652