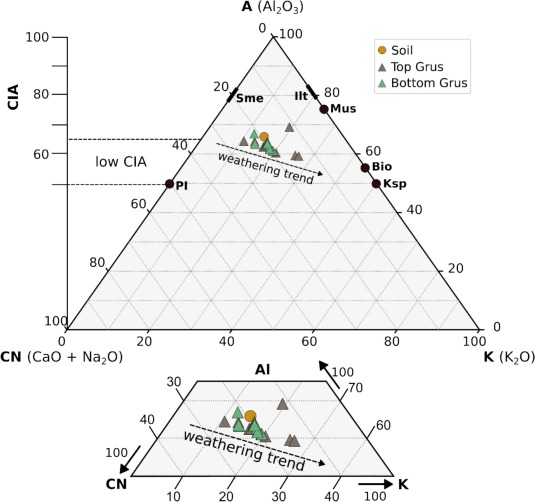
ALT Grey backdrop represents air temperature variations. Coloured lines represent the surface denudation (erosion) variations. Time in kilo years (ka; 1ka = 1000 years).
Just out, a 66 million year history of atmospheric CO2. Key take away: CO2 hasn't been at today's levels for at least 3 million years. These high CO2 worlds in the geological past had less ice and *much* higher sea levels 📈🌊 #COP28science.org/doi/10.1126/scie…
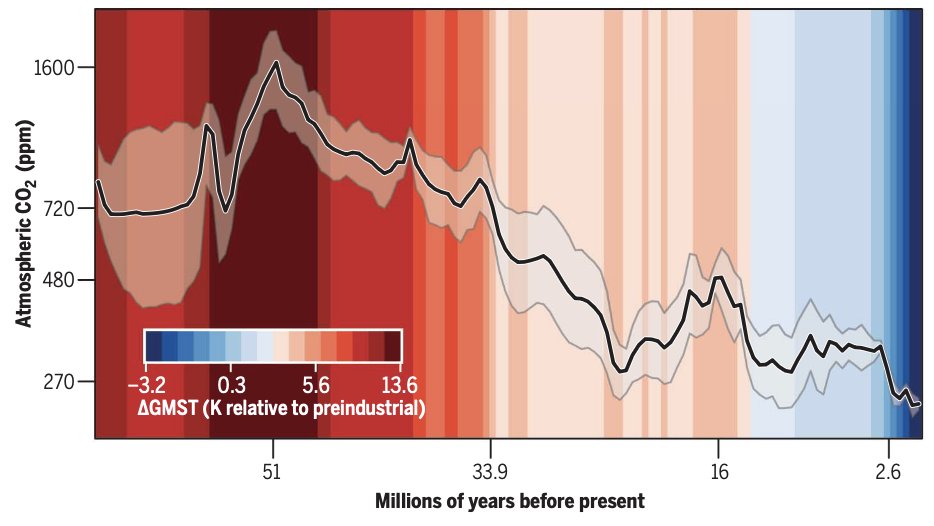
ALT A graph showing the history of CO2 over the last 66 million years superimposed onto of colours indicating global temperatures
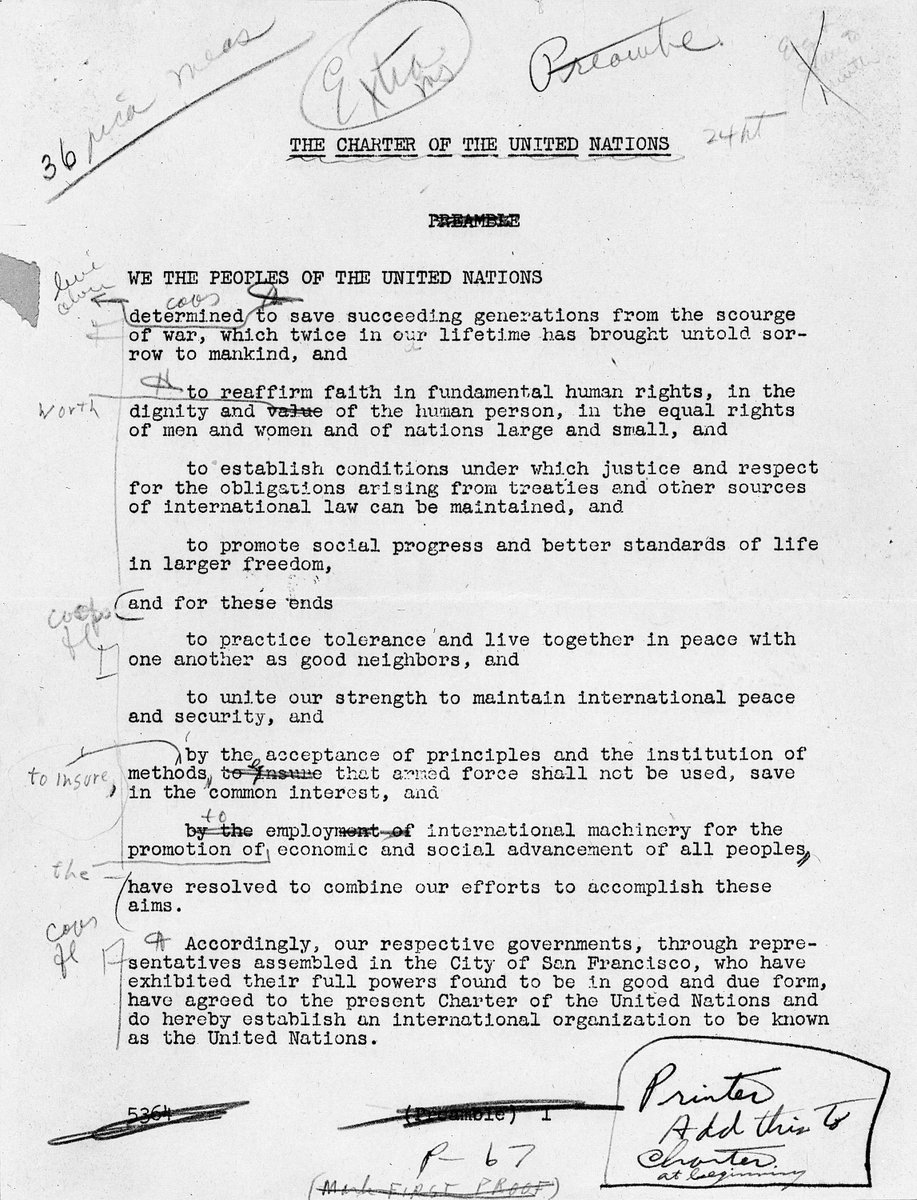
2023 is shaping up to be hottest year on record, after extraordinary temperatures since June (and ahead of peak of warming El Niño).
🔗Updated WMO news article with figures from @CopernicusECMWF, @NASAClimate, @NOAAbit.ly/3LZKAth#StateofClimate
📷NASA/Peter Jacobs
ICYMI - looking back at last month's global temperature compared to every previous September month...
Data from data.giss.nasa.gov/gistemp/
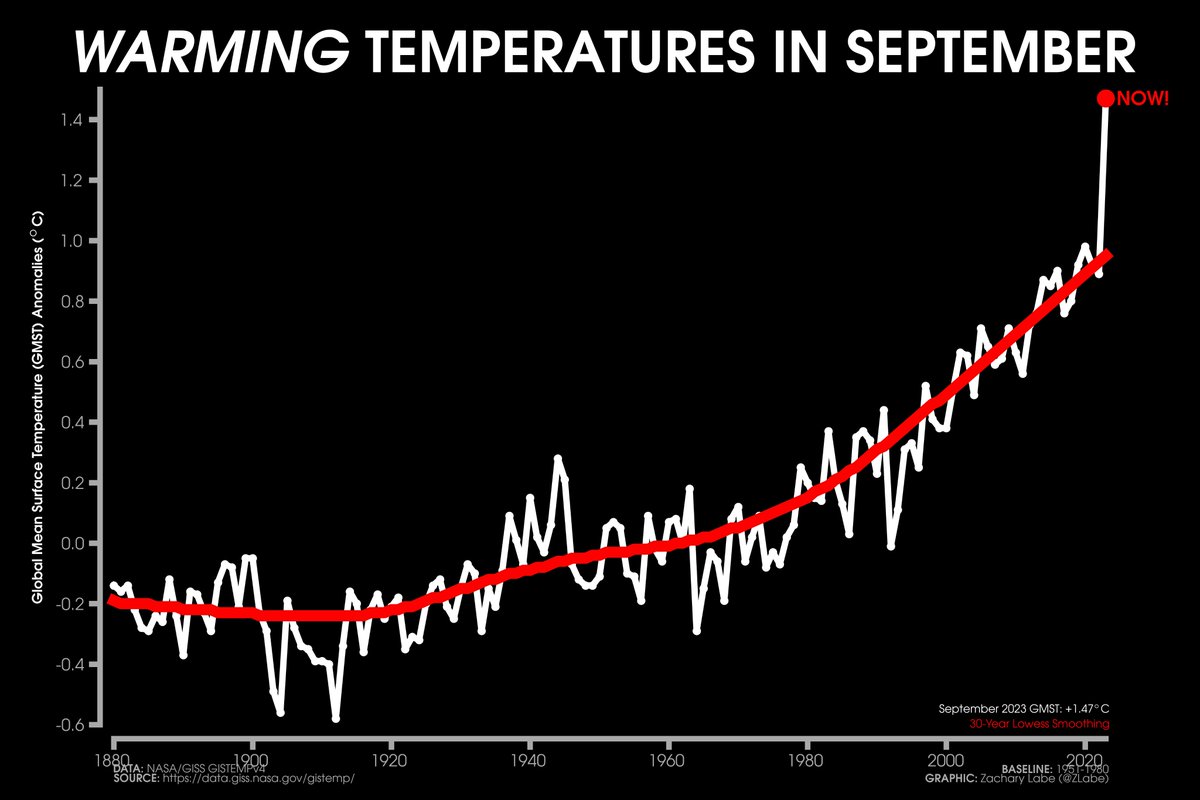
ALT Line graph time series of global mean surface temperature anomalies for every September from 1880 through 2023. A red 30-year lowess smoothing line is also shown. Anomalies are computed relative to a 1951-1980 baseline. The global mean surface temperature anomaly in September 2023 was 1.47°C. There is large interannual variability and a recent long-term warming trend.
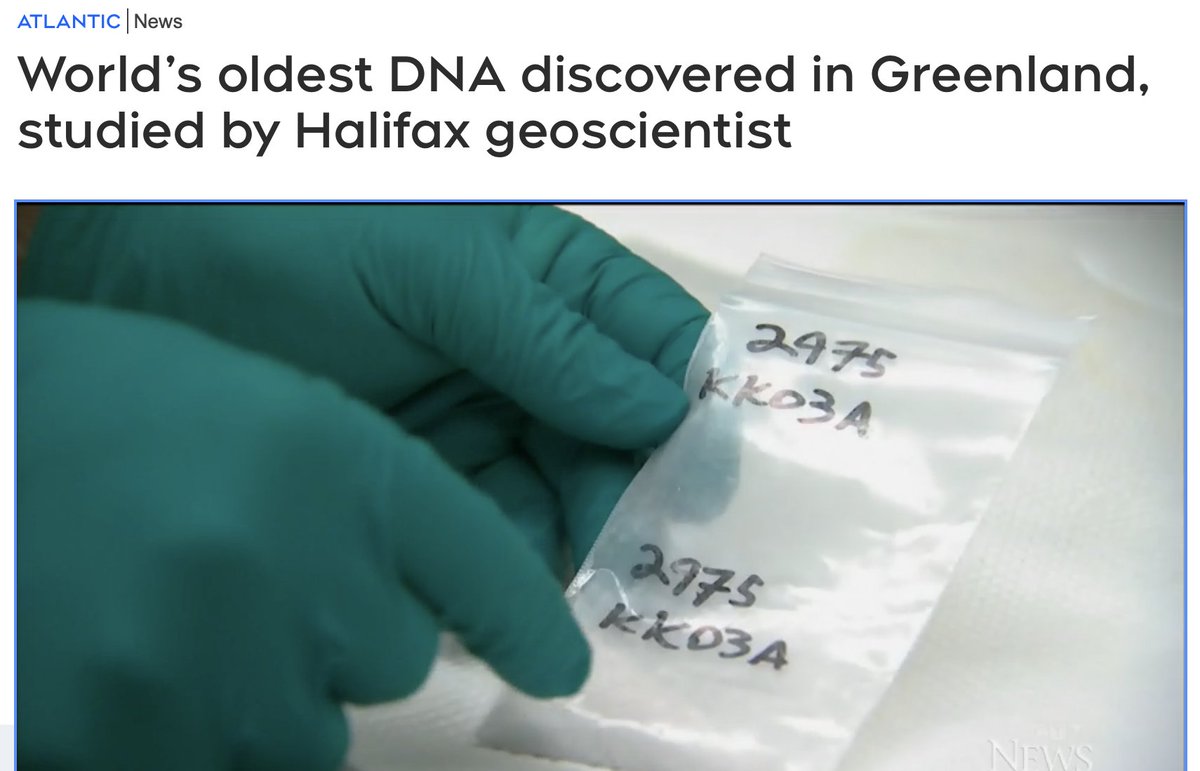
As we expected, $TSLA has increased prices on M-Y by an additional $250 across all trims, and on M-S and M-X by $1K. This will likely change the pricing/margins narrative and increases confidence TSLA gross margins can bottom in 2Q. @elonmusk
With $TSLA M-Y inventories at recent lows and delivery wait times increasing, we expect another modest price hike on M-Y LR and Perf over the next few weeks. This would change the pricing/margins narrative and increase confidence that TSLA gross margins can bottom in 2Q.
Come meet the @EGU_GM ECS reps today for a networking lunch! @younggeomorph
Where? #EGU23 networking zone - suite C (red level) Tue, 25 Apr, 12:45–14:00 CEST.