
May 28
Sui freezing again while Aptos quietly pushes deeper into stablecoins, RWAs, AI infrastructure, and institutional markets is starting to feel like a very important divergence.
$sui $apt
Both chains came from the Meta/Diem DNA.
Both promised high-performance Move ecosystems.
But lately the narratives feel completely different:
Sui = explosive hype, huge attention, recurring outages.
Aptos = less noise, but steady infrastructure and institutional positioning.
What really caught my attention:
• Aptos committing $50M toward AI trading infrastructure
• growing stablecoin/RWA activity
• partnerships around real-world payments
• BlackRock, Franklin Templeton, Apollo exposure
• focus on reliability and institutional-grade execution
Crypto loves speed.
But eventually every chain gets tested on uptime, trust, and consistency.
Feels like the market may slowly start valuing “boring reliability” a lot more.
#Sui #Aptos #Layer1 #MoveLanguage #Blockchain #Crypto #Web3 #DeFi #RWA #Stablecoins #AI #InstitutionalCrypto #BlackRock #FranklinTempleton #Apollo #CryptoInfrastructure #BlockchainReliability #Move #AptosEcosystem #SuiNetwork #CryptoTwitter #BuildInPublic #Uptime #TradFi #Tokenization #CryptoNews #Blockchain2026
1
7
278

Apr 23
Reliability is not just about performance; it’s about consistency under pressure
Many blockchain systems perform well in isolation but fail to maintain security and reliability when transaction volume rises
As transaction flow increases, systems must prove that they can handle:
• data integrity
• fault tolerance
• consistent transaction validation
#Tectum’s layered architecture and hash based data handling ensure that reliability remains constant even during peak load, making it suitable for continuous financial activity
#TET #BlockchainReliability #Scalability #Infrastructure #Security

1
922

Apr 18
Strong ecosystems are a product of dependable infrastructure.
Kaanch Network is designed to deliver that foundation.
kaanch.com
#KaanchNetwork #BlockchainInfrastructure #BlockchainReliability
4
4
26
479
Feb 25
Kaanch Network is built to deliver reliable, seamless transaction execution that strengthens user confidence.
kaanch.com
#KaanchNetwork #BlockchainReliability #Infrastructure

1
4
28
434

Feb 11
Rubycoin prioritizes reliability over experimental features, delivering stable, secure blockchain infrastructure for long-term growth.
🌐Visit:- rubyscan.io
#Rubycoin #CryptoInvesting #DigitalAssets #CryptoUpdates #BlockchainReliability #StableNetwork #Web3 #Crypto
2
1
6
52
24 Dec 2025
Advanced data storage mechanisms ensure reliability, security, and performance across the RubyScan network.🛡️
🌐Visit:- rubycoin.io
#RubyScan #DataStorage #BlockchainReliability #Web3Infrastructure #SecureData
2
4
80

13 Dec 2025
Liquidity locked. Stability secured.✨
With iEscrow, liquidity is locked for 4 years safeguarding the ecosystem while keeping tokens fully functional and flowing where they’re needed. Security first, progress always.
#iEscrow #LockedLiquidity #CryptoSecurity #DeFiTrust #ESCROWToken #SafeAndStable #LongTermCrypto #BlockchainReliability #CryptoEcosystem
1
75

10 Dec 2025
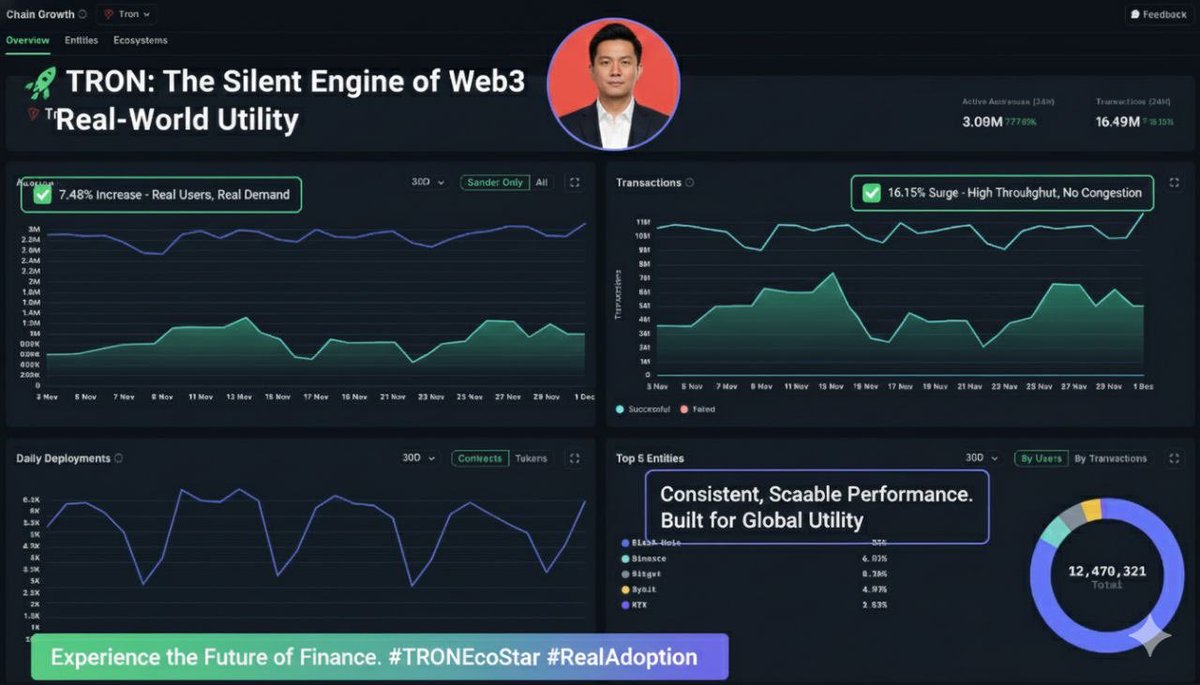
TRON: The Silent Engine of Web3 Real-World Utility.
While many decentralized networks focus on speculative hype, TRON is steadily establishing itself as a foundational layer for global commerce through consistent, scalable performance and massive real-world adoption.
The latest 24-hour metrics underscore its position as a highly reliable and heavily utilized blockchain ecosystem.
Key Metrics Confirming Robust Growth
TRON's daily performance is not marked by volatile spikes, but by stable, upward momentum a sign of genuine, organic demand:
👥 3.09 Million Active Addresses: A significant 7.48% increase in daily unique users, demonstrating high user retention and a continuous influx of new participants relying on TRON for daily activities like stablecoin transfers and payments.
📈 11.49 Million Transactions Processed: A remarkable 16.15% surge in transaction volume. This high throughput is handled seamlessly, proving TRON's capability to manage massive value movement from USDT flows to smart contract interactions without fee spikes or network congestion.
The TRON Advantage: Built for Global Needs
TRON's success is deeply rooted in solving practical, everyday challenges, especially in regions requiring robust financial infrastructure:
Low Friction, High Utility: Its speed and minimal cost have made it the go-to rail for cross-border remittances and payments where banking access is limited and transaction fees are a critical factor.
The USDT Powerhouse: As the backbone for the world’s largest Tether (USDT) ecosystem, TRON is indispensable for digital dollar value transfer, solidifying its role in the global financial value chain.
Maturing Ecosystem: This activity is fueled by a comprehensive ecosystem encompassing booming DeFi protocols, high-volume payment dApps, and growing utility in gaming and social applications.
Defining Blockchain Reliability
TRON’s signature is its low-volatility, steady growth driven by utility, not market noise. While other chains struggle with scalability under pressure, TRON consistently operates at full capacity, delivering the stable, predictable performance that enterprise, developers, and users can trust.
This sustained growth is strengthening the network's fundamentals, reinforcing its dominance in the stablecoin market, and compounding the network effects that make TRON a default choice for digital asset operations.
Get on the network built for the long haul. Experience the speed, affordability, and reliability that 3 million daily users have come to depend on.
#TRONEcoStar #RealAdoption #BlockchainReliability #USDT
15
13
30,145

21 Nov 2025
There’s something revealing about how a network behaves during the early hours of the morning. When your mind is fresh and the world hasn’t started rushing yet, you notice details you’d normally overlook.
Today I opened @X1_EcoChain not to finish leftover tasks, but to plan the day ahead , a small routine check before things got busy.
I expected to ease into it slowly, maybe review a few actions from yesterday, but what happened instead was a quiet reminder of how well this system is built. Everything responded immediately. My dashboard loaded without delay. A contract interaction I scheduled last night picked up exactly where it left off. Even a new transaction I initiated processed with a consistency that didn’t interrupt my rhythm.
No syncing lag.
No dropped sessions.
No need to refresh anything.
Just a platform that stayed aligned with my pace from the moment I opened it.
Mornings have a way of exposing the truth about infrastructure. When you’re not multitasking or rushing, you can feel whether a network is naturally cohesive or barely holding its parts together.
X1 feels cohesive. It feels engineered for continuity, not just speed.
That quiet, dependable stability says more about the architecture than hours of stress testing ever could.
#X1 #EcoChain #Web3Infrastructure #ChainPerformance #CryptoUX #BlockchainReliability
17 Nov 2025

X1Node Sale is Now Live @X1_EcoChain
nodesale.x1ecochain.com
I’ve been around long enough to remember when running a node felt like a punishment. Hours waiting for sync, systems overheating, and electricity costs that made you question the whole point of decentralization.
That’s why X1 EcoChain feels like such a shift. After spending days analyzing the network, it became clear that this isn’t another “promise-first, optimize-later” project.
We’re talking about 6,500 active nodes in 65 countries, all operating smoothly and reinforcing a chain designed for real-world use. The network prioritizes speed, efficiency, and sustainability, without pushing out everyday participants.
What really sets it apart is the balance:
Open enough for anyone who wants to run a validator
Optimized enough to avoid the energy waste that plagued early blockchains
Rewarding enough to make participation meaningful
Structured enough to scale into Web4 without heavy redesigns
This isn’t just infrastructure, it’s a coordinated global layer built for responsible growth.
I’ve watched many node projects launch with big promises but crumble under their own technical limitations. X1 is doing the opposite: build strong first, expand later.
So the question isn’t “should you get a node?”
It’s whether you want to be part of a network built on efficiency, inclusivity, and long-term sustainability.
Take a moment to explore the sale.
Imagine your node not as a machine in your room, but as one piece of a worldwide system shaping the next era of decentralized technology.

28
29
49
607

1 Oct 2025
Solana’s speed is unmatched — until congestion hits. @raikucom steps in where TXs fail or slow down, ensuring smooth interactions even during peak loads.
Reliability > Hype.
#Solana #Raiku #Web3Infra #DePIN #BlockchainReliability #SolanaTX
2
18

10 Sep 2025
Network Stability and Reliability Assessment
#NetworkStability #BlockchainReliability #CryptoInfrastructure #DeFi #Web3 #SystemIntegrity #DigitalSecurity #CryptoNetworks #PHB #PhoenixONE
one.phoenix.global/shr/u?a=t…
1
2
83

6 Jul 2025
Bless Network, we deliver consistent, secure, and high-performance blockchain infrastructure you can trust. @theblessnetwork
#BlessNetwork #Web3 #BlockchainReliability
2
3
2,659

21 Jun 2025
⚙️ Javsphere's Robust Oracle Integration: Precision and Reliability! ⚙️
Accurate and reliable price data is the backbone of effective leverage trading. Javsphere integrates with industry-leading decentralized oracle networks like @PythNetwork to ensure that all price feeds for crypto, stocks, and forex are precise, real-time, and tamper-proof. This commitment to data integrity minimizes risk and maximizes fairness for every trader on our platform.
Experience trading with confidence, knowing your positions are backed by the most reliable data in the decentralized space. Precision is our promise!
#Javsphere #Oracles #DeFiData #PriceFeeds #BlockchainReliability #DecentralizedOracle #DataIntegrity #CryptoPrecision #Web3Tech #SecureTrading
@chainlink @SergeyNazarov @JuanBenet @BrendanEich @synthetix

1
1
3
153

13 Jun 2025
AWS, Cloudflare, and Google may be down… but the XDC Network keeps running.
Always on. Always dependable. 🚀
#XDC @XDC_Network_ #Decentralization #BlockchainReliability @awscloud @Google @Cloudflare #Ripple #Coinbase #BTC
1
1
10
165

10 Apr 2025
Solana’s uptime has improved drastically in recent months. Is Solana finally overcoming its early network stability issues? #Solana #BlockchainReliability #DeFi #Web3 Privacy matters. Be your own bank. Digital gold. Invest wisely, hodl strongly. Digital gold. Web3 is inevitable.
2
28
31 Mar 2025
Solana’s commitment to low-latency transactions is improving the blockchain’s reliability. Could SOL challenge Ethereum as the leading blockchain for decentralized applications? #macrocosmos #Solana #SOL #Crypto #BlockchainReliability #LowLatency #dAppDevelopment #BTC #USDT #TAO
2
58

27 Feb 2025
Built to last 💪
LTO Network has been running smoothly since 2018—no downtime, no issues, just constant innovation in RWA tokenization. #BlockchainReliability See more info: blog.ltonetwork.com/rwa-focu… $LTO


1
4
98

26 Jan 2025
CheckDot’s power comes from its community, offering decentralized evaluations that ensure fair and transparent reviews for every project. Join the mission today with $CDT! #CheckDotCommunity #BlockchainReliability @Checkdot_proto #bullish #defi
1
96

27 Dec 2024
Solana: The Raoul Favorite with a Shaky Foundation
The Reality Check on Solana (SOL)
Solana has become a poster child for speculative hype, championed by influential voices like @RaoulGMI Pal. But behind the curtain of high praise lies a troubling history and questionable ecosystem dynamics that every investor should critically evaluate.
1. The History of Chain Halts
Solana's blockchain has suffered multiple chain halts over the past two years, leaving users unable to transact during critical moments.
These incidents have highlighted significant stability and reliability issues, particularly for a blockchain marketed as the "Ethereum killer."
In a space where uptime and trust are paramount, Solana's track record has caused doubt about its ability to handle real-world demand and adoption.
2. The "Influencer Scam Meme Market"
Solana has increasingly become the playground for influencer-backed projects that rely on hype rather than substance. Meme coins, NFT cash grabs, and short-lived DeFi schemes have flocked to its ecosystem.
This has turned Solana into what can be described as the "Influencer Scam Meme Market," where the focus is on viral moments over building sustainable, value-driven projects.
Investors Beware: Many of these projects prioritize short-term profits for insiders while leaving retail participants with losses.
3. The Raoul Connection
Raoul Pal's consistent promotion of Solana raises questions: Is it based on true fundamentals, or is it another speculative bet on "price go up"?
While Solana does have potential for high transaction speeds, the narrative seems more focused on speculative returns than addressing its foundational flaws.
4. Competitive and Ecosystem Risks
Solana's centralization concerns are still a major issue: The network relies heavily on a small number of validators, leading to skepticism about its decentralization credentials.
The concentration of wealth and decision-making power among a few insiders contrasts with the ethos of decentralization in crypto.
Ecosystem Fragility: Solana's reliance on NFTs and meme projects for its ecosystem growth leaves it vulnerable to shifting trends. When the hype fades, what remains?
5. Solana vs. Cosmos
Unlike Cosmos, which has built an interoperable, modular, and scalable infrastructure designed to support sustainable growth, Solana has opted for a "build fast, break fast" approach.
Cosmos focuses on collaboration through IBC, while Solana continues to build an isolated ecosystem, which could hinder its long-term adoption.
Is Solana a Buy?
Not so fast. While its price may occasionally pump due to influencer hype or speculative interest:
The long-term risks tied to its instability, centralization, and meme-driven market dynamics outweigh the potential upside for many investors.
Until Solana proves its technical reliability and fosters a more value-driven ecosystem, it will remain a speculative asset rather than a sound investment.
Conclusion
Solana has shown potential but has consistently failed to live up to its lofty promises. For investors, it’s important to separate hype from reality and recognize the structural weaknesses that may prevent Solana from truly delivering on its vision. It’s time to demand more from blockchain projects than catchy narratives and influencer endorsements.
Tags:
#Solana #CryptoScams #BlockchainHype #CryptoMemeMarket #SolanaNetwork #RaoulPal #CryptoAnalysis #BearishOutlook #BlockchainReliability
27 Dec 2024

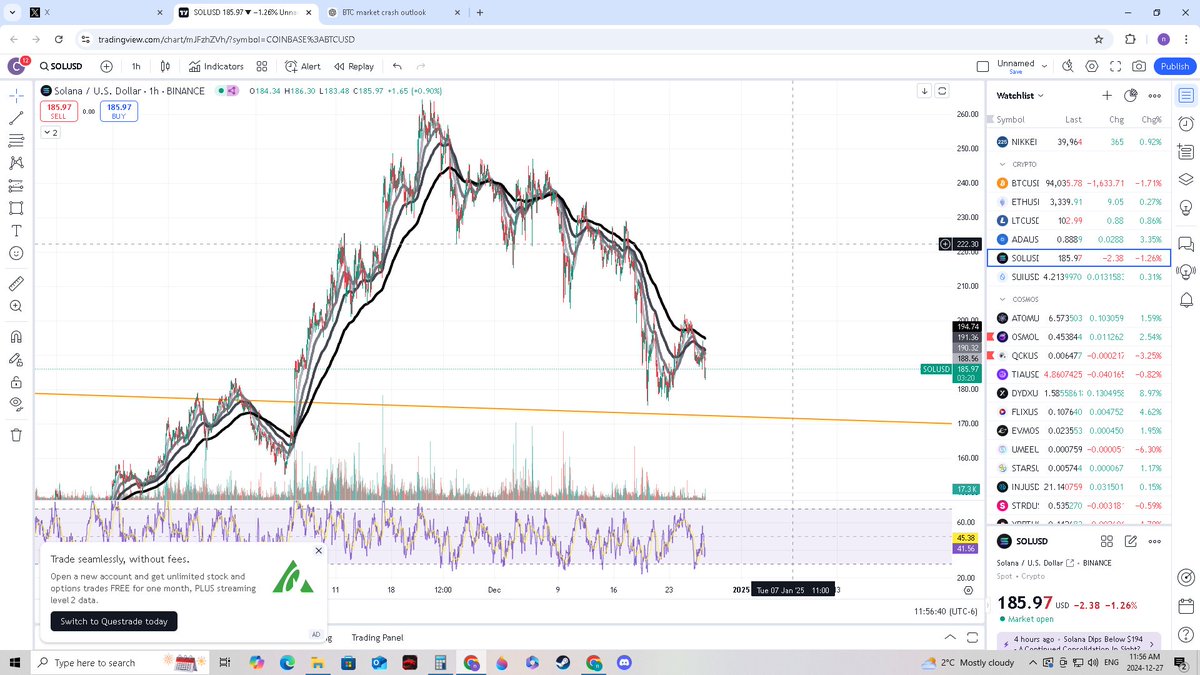
Solana (SOL): A Clear Bearish Downtrend
The current Solana (SOL) chart provides a strong visual confirmation of a persistent bearish trend that doesn't show signs of abating anytime soon. Let’s break this down:
Key Observations from the Chart
Price Action: SOL is experiencing consistent lower highs and lower lows, a classic indicator of a bearish trend.
There has been a failed attempt to hold support levels, with price action heading closer to key horizontal support zones.
EMA Structure: The Exponential Moving Averages (EMAs) are in perfect bearish alignment, with shorter timeframes (e.g., 21 EMA) trending below longer timeframes (e.g., 200 EMA).
These EMAs are acting as dynamic resistance, rejecting any attempted bullish breakouts.
Volume Profile: Volume spikes during price declines suggest distribution rather than accumulation, signaling that sellers are still in control.
Lack of significant buying volume confirms the bearish sentiment and lack of demand.
RSI: The Relative Strength Index (RSI) is not showing any oversold bounce; it hovers in neutral-to-weak territory, leaving room for further downside.
Support Levels: The orange horizontal line represents a major support zone that has yet to be tested. A break below this level could trigger capitulation.
What Does This Mean for SOL?
Near-Term Outlook: The chart suggests no immediate bullish reversal is in sight. Sellers dominate the market, and any upward movement is likely to be a short-term relief rally rather than a trend change.
Key Risks: If SOL breaks below the key support level, we could see a sharp acceleration downward, possibly revisiting levels not seen since the earlier stages of its 2021 bull run.
Broader Market Context: SOL's performance is likely tied to broader market sentiment, particularly Bitcoin's current bearish influence on the altcoin space.
Solana has also faced fundamental challenges in the past (e.g., network outages, FTX collapse) that continue to impact investor confidence.
Should You Buy the Dip?
Caution Is Key: While "buying the dip" might be tempting, catching a falling knife is risky, especially in such a clear downtrend.
Wait for Confirmation: Investors and traders should wait for clear signs of reversal, such as: A break above key EMA levels.
Higher lows forming on the chart.
Sustained buying volume indicating accumulation.
Conclusion:
Solana's chart is a textbook bearish setup. While it’s tempting to view lower prices as opportunities, it’s important to manage risk and recognize that the trend remains down until proven otherwise. If support at the orange line fails, it could spell further trouble for SOL in the near future.
Tags:
#Solana #CryptoBearMarket #SOLUSD #CryptoAnalysis #MarketTrends #TechnicalAnalysis #BearishTrend #CryptoTrading
1
67