
Jun 12
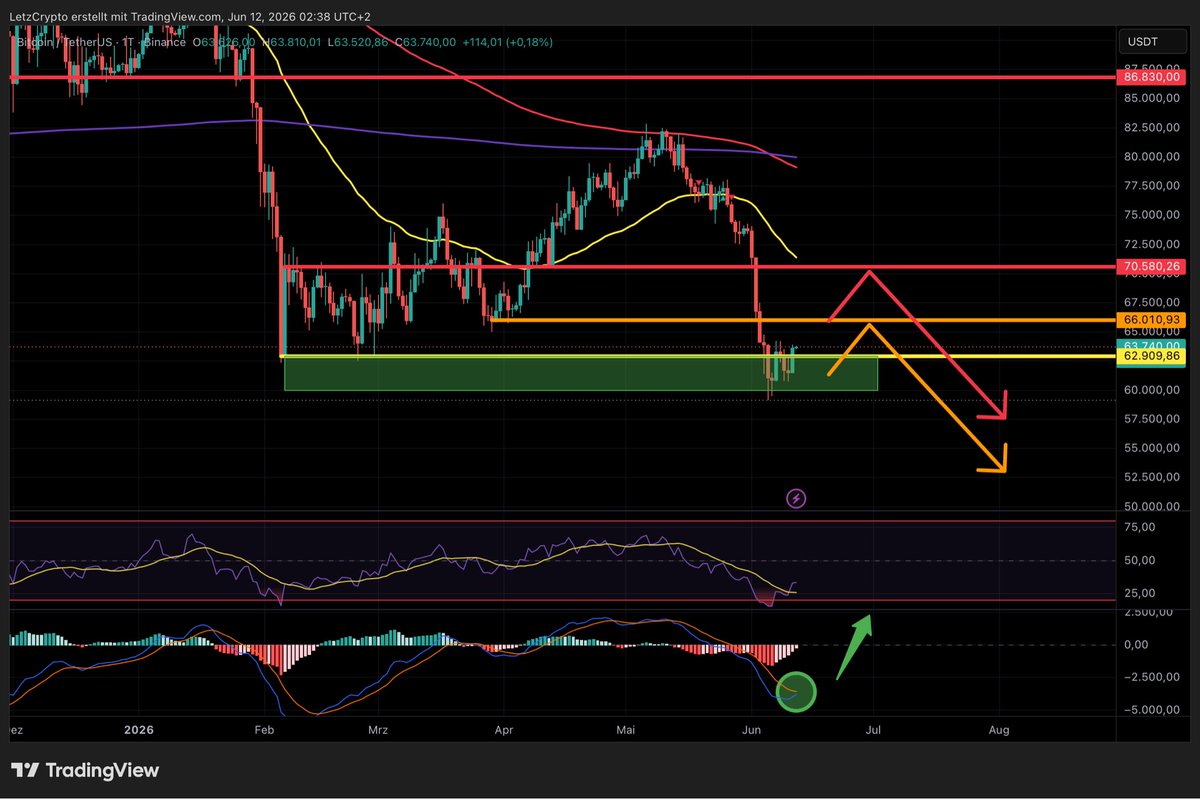
Beim Bitcoin sieht der Daily Chart aktuell äußerst interessant aus.
Besonders auffällig ist der MACD, der in den vergangenen Tagen zunehmend an negativem Momentum verloren hat. Die Abwärtsdynamik nimmt damit immer weiter ab und es zeichnet sich langsam die Möglichkeit ab, dass der Indikator wieder in den positiven Bereich drehen könnte.
Sollte sich dieses Szenario bestätigen, wäre das ein weiteres Signal dafür, dass Bitcoin noch einmal einen Aufwärtsimpuls starten könnte.
Ich halte daher weiterhin an meinem Szenario fest, dass der Kurs die Zone um 70.000 US Dollar anlaufen könnte. Interessanterweise würde dort auch die 50er Daily EMA verlaufen, die aktuell als wichtiger Widerstand fungiert.
Bevor Bitcoin jedoch die 70.000 US Dollar erreichen kann, wartet mit dem Bereich um 66.000 US Dollar bereits die nächste große Hürde. Diese Widerstandszone dürfte nicht einfach zu überwinden sein und könnte zunächst für Gegenwind sorgen.
Die kommenden Tage werden daher spannend: Schafft es Bitcoin, das positive Momentum weiter auszubauen, oder setzt sich der übergeordnete Abwärtstrend erneut durch? 👀
#Bitcoin #BTC #BTCUSD #MACD #EMA50 #Liquidity #MarketStructure #TechnicalAnalysis #PriceAction #Bullish #Bearish #DailyChart #CryptoTrading #ChartAnalysis
2
1
8
509

Jun 11
$8697.T Japan Exchange
VCP (Volatility Contraction Pattern) is currently developing.. keep close watch.
Tradeplan ada di chart 👇
#DailyChart
#SwingPlan
#TSE
#Japan

1
5
460
Jun 11
$8050.T Seiko Group
Bullish price action is developing
Tradeplan ada di chart 👇
#DailyChart
#SwingPlan
#TSE
#Japan

1
1
13
3,235


105

May 28
Ich habe eine ganz wilde Theorie für die kommenden Wochen. Ich erkläre es dir ganz genau, wie ich darauf komme und warum es so oder so ähnlich eintreten wird…
Bild 1: BTC Chart, wie er aus seiner Bearflag (weekly) ausbricht und gleichzeitig ein Head&Shoulders (daily) mit Zielleveln bei ~67k aktiviert. Somit ist jetzt auf dem Dailychart ein H&S zu 67k aktiv und auf dem höheren TF eine bearflag zu den ~45k.
Gleichzeitig sehen wir M2, wonach sich BTC wieder wunderbar orientiert. Wir sehen nächste Woche zum ersten Mal wieder eine mögliche Aufwärtsbewegung und etwas Stärke, doch dazu im Fazit mehr.
Bild 2: Nasdaq Futures Chart, wie er dem M2 1:1 perfekt nachläuft.
Fazit: Jetzt wird‘s spannend. Während auf der einen Seite bei BTC alles bearish aussieht und M2 die einzige Hoffnung auf eine kleine Erholung darstellt, steht der Nasdaq ihm gegenüber und sieht laut M2 (wonach er sich die letzten Monate nahezu wie einem Uhrwerk gleicht) eine kleine Korrektur (~5-10%).
Wir wissen, dass BTC dem Nasdaq bei Aufwärtstrends nicht gleicht, dafür bei Abwärtstrends des TradFi, umso stärker mitzieht.
Was also jetzt am Wahrscheinlichsten passieren wird:
Morgen, als auch am WE könnte BTC im Preis etwas anziehen und wieder neue Bullen in den Markt holen und in Sicherheit wiegen. Im Verlaufe der nächsten Woche wird der Nasdaq dann schnell korrigieren und BTC vermutlich, wie wir es kennen, überproportional in die Tiefe reißen, womit das Ziellevel des H&S erreicht werden könnte. Die Woche drauf sehen wir bei dem M2 im BTC Chart wie eine massive Korrektur bevorsteht. Diese könnte die finale Kapitulationsphase zu den 45k darstellen.
Im Klartext: Noch ca. 2 1/2 Wochen und wir haben die 45k erreicht und können uns auf die weitere Zukunft, sowie das endgültige Bärenmarkttief fokussieren😁

25
4
34
11,215

May 26
Spotify、Apple Musicで #AND2BLE_Curious のスミン(音楽再生)をしましょう!!🎧🎶
(Spotify無料アカウントからも可能!)
音楽番組1位のためには音源公開から24時間の再生回数が最も大切です!🥹🥹Spotify/Apple Musicでのスミン(音楽再生)は韓国の音楽番組のエムカとインガに反映されます❣️
できるだけ手動で丁寧に再生しましょう❣️
また、シェアリレーも行いましょう🔗
手動再生が難しい場合はStationheadも活用!
【初日Spotify再生回数目標】25万回再生🎯
【Apple Music再生目標】日本Dailychart TOP100
★自動再生OFF
★リピート再生✕→スミン曲の間に2~3曲再生!自然な再生を意識!
★オフライン再生よりもストリーミング再生
★シェアリレーもしよう!Spotify共有リンクからAND2BLEの曲を30秒以上再生してシェア!
↓シェアリレーの際には以下のハッシュタグをつけて投稿しよう!🏷️
#AND2BLEシェアリレー
#AND2BLE_ShareRelay
引用元のスミンガイドを必ず確認して再生してください🍀🌟
#AND2BLE #앤더블 #アンダブル

May 25

🍀Spotifyスミンガイド🎧🍀
Spotifyでのスミンは韓国の音楽番組のエムカとインガに反映されます❣️
音楽番組のスコアの中で、音源点(ストリーミング点)は最も大きなファクターです❣️
エムカ、インガ共に反映される音源点(韓国音源含む)は50%以上の音楽番組です💐
★Premium会員推奨(※無料会員でもできます!)
★自動再生をOFF
★リピート再生しない→スミン曲の間に2~3曲再生!自然な再生を意識!
★ミュートで再生しない
★オフライン再生よりもオンラインストリーミング再生
一人一人が1回でも多く再生することが大事です🥹AND2BLEに音楽番組1位、新人賞をプレゼントするために、ガイドをしっかり確認して再生しましょう!!
#AND2BLE #앤더블 #アンダブル

15
20
8,668

May 20
DOTCOM FRACTAL — DAILY UPDATE
A follow-up to Saturday's analysis.
Same fractal. Smaller timeframe.
Now with internal wave structure.
───────────────
Saturday showed the big picture.
S&P and Nasdaq tracking the dotcom structure
with remarkable precision
on the weekly and monthly timeframe.
Today: the daily chart confirms the same.
Down to the Fibonacci levels.
───────────────
S&P 500 — DOTCOM 2000 vs. TODAY
Left: S&P dotcom 2000
Wave 2 correction: between 0.702 (1,350)
and 0.786 (1,343).
Deep and sharp.
Then: long Wave 3 higher.
Orange circle: Wave 4 consolidation
at 0.236 (1,446).
The final push from Wave 4 low
into the target box:
15 candles. 21 days.
Right: S&P today
Wave 2 correction: between 0.382 (6,497)
and 0.5 (6,463).
A moderate retracement
deeper than the projected Wave 4 at 0.236.
Then: long Wave 3 higher.
Orange circle: Wave 4 consolidation now.
0.236 at 7,272 — the projected floor.
The final push from Wave 4 low
into the target box ~8,100–8,400:
projected at 57 candles — approximately 84 days.
That is not the duration of the consolidation.
That is the projected duration
of the final push itself
if the compression factor holds.
───────────────
NASDAQ — DOTCOM 2000 vs. TODAY
Wave 2 today: corrected to 0.5 at ~23,500.
A moderate retracement
deeper than the projected Wave 4 at 0.236.
Wave 4 now: consolidating.
0.236 at 28,218 — the projected floor.
The final push from Wave 4 low
into the target box ~31,000–32,500:
projected at 39 candles — approximately 57 days.
Not the consolidation duration.
The projected duration of the final push
if current velocity is maintained.
───────────────
WHAT THESE PROJECTIONS MEAN
57 days for the Nasdaq final push
and 84 days for the S&P
are derived from the dotcom compression factor
not measured from the charts today.
They represent the upper boundary
of how long the final push could take
if the current pace holds.
If velocity increases as it historically does
in blow-off final phases
the move completes faster.
The projected window:
early to mid-June 2026.
This is an estimate. Not a prediction.
Timing is always the hardest part.
Structures stretch. Windows shift.
───────────────
THE ALTERNATION PRINCIPLE
In Elliott Wave structure,
Wave 2 and Wave 4 tend to alternate
in depth and character.
Both S&P and Nasdaq show this:
Wave 2: moderate retracement.
Wave 4: projected shallower move.
Grinding. Uncertain.
Everyone is calling it the beginning of the end.
If this alternation holds
Wave 4 finds its floor at the 0.236 levels
before Wave 5 begins.
Deeper levels remain possible.
That scenario exists and cannot be excluded.
───────────────
THE META-LEVEL
The news flow right now
creates a specific atmosphere.
Bond yields at multi-year highs.
Handelsblatt yesterday:
"US bond yields reach highest level
since the start of the Global Financial Crisis."
Geopolitical uncertainty.
Rate hike discussions.
Bearish voices growing louder.
That atmosphere makes it feel
like something is fundamentally breaking.
But the fractal does not read headlines.
In late 1999 into early 2000,
bond yields rose from ~4.2% to ~6.8%.
The Fed raised rates 1.75%.
No QE. No accommodation.
The S&P ran its final push anyway.
The current consolidation
the move that feels threatening
sits at exactly the same structural position
as the Wave 4 pause before the final leg
in the dotcom cycle.
Not before the move began.
Not in the middle.
At the pause before the last leg.
───────────────
The fractal is not only tracking
on the weekly and monthly timeframe.
It is tracking on the daily.
Down to the Fibonacci retracement levels.
Down to the wave alternation character.
That is not one data point.
That is structure repeating
across every timeframe simultaneously.
And structure ends
whether it is convenient or not.
CIF: 82/90 (91.1%) — Warning Level Orange.
@TheBigCycleGame
Not financial advice. DYOR.
#SPX #Nasdaq #DotcomFractal
#EndCycle #CIF #FinalPhase
#Fibonacci #ElliottWave
#MacroAnalysis #Contrarian
#DailyChart #Compression


2
1
19
816

5
4
34
2,583

May 18
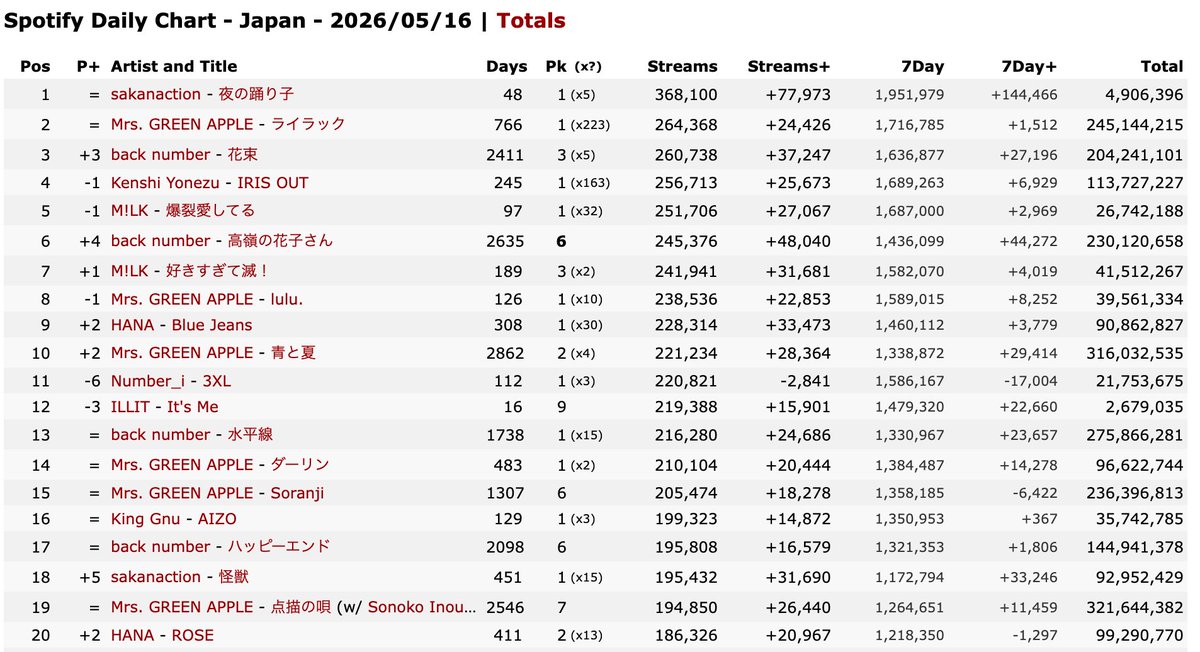
Spotify 5/16(日本時間は5/17かな)のDailyChart
1位 夜の踊り子
18位 怪獣
なにげに2位にミセスのライラックも返り咲きのように入ってくるのはなんか作為的なものを感じるな。。。
まぁでもStreams は圧倒的で寄せ付けない
1
21
994

#ZEROBASEONE #ZB1 #제로베이스원
カムバック1日目の目標
【MV再生数】 800万、高評価30万
【Spotify再生数】 40万
【AppleMusic再生数】 TOP100Japan dailychart入り
【Tiktokの音源数】8000
ゼロズ頑張ろうー😭‼️日付変わったら、5/25までは曲の再生とMVの視聴をお願いします😭‼️ステへ繋いでね‼️
May 12

🔥🕶カムバ応援目標👔🔥
6th Mini Album【#Ascend- 】の応援目標です!
達成のためには、一人一人の力が必要です!
目標を達成して、ゼベワンに1位をプレゼントしましょう❤️🔥
ゼロズファイティン🌹
#ZEROBASEONE #ゼベワン

22
22
1,608

May 10
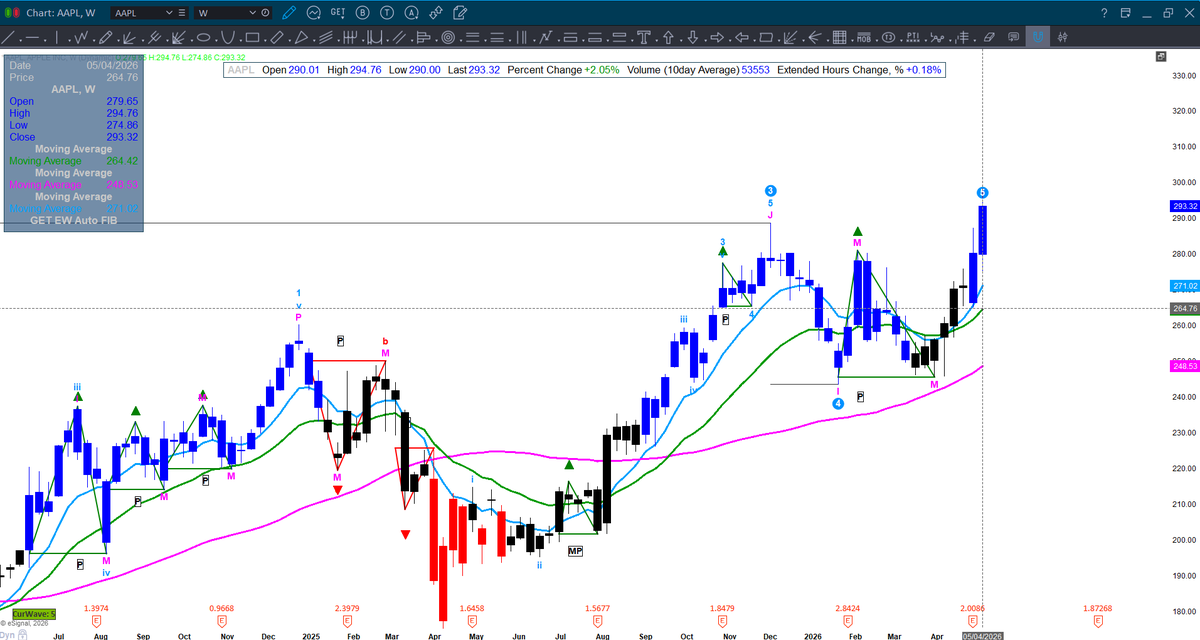
$AAPL — ATH BREAKOUT 🚀
📈 Closed 293.32 ( 2.05%) · Wave-5 extension active
🎯 Trigger: Daily close >294
🟢 Targets: 300 → 310 → 315
🛑 Stop: 282 (loses 9 EMA)
Calls: 5/15 297.5C
Full plan ↓
tradeselliot.vip
#AAPL #Apple #StockMarket #SwingTrading #ElliottWave #ChartAnalysis #Tech #SP500 #TradingView #OptionsTrading #DailyChart
1
3
761
May 5
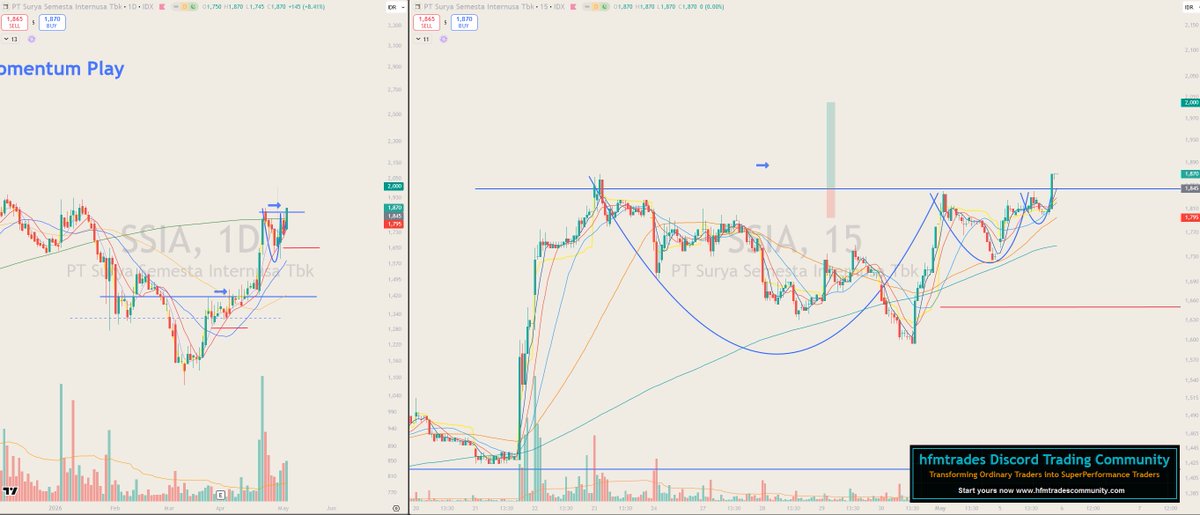
$SSIA Swing Trade Chart
Chart Pattern: hfmMomentum VCP
Entry, Stoploss di chart.
Target gunakan 2-3R dan Fibo extension.
#SwingTrade
#DailyChart
#hfmMomentum #VCP
#IDX
#hfmTradingCommunity
May 5

Breakout yg strong guyss... $SSIA
VCP pattern juga..
Chart breakout & Tradeplan (target, stoploss)..coming up nanti malam ya
#SwingTrade
#IHSG
#hfmTradingCommunity
2
3
26
2,448
May 5
$SSIA pattern yg sama persis seperti thn lalu saat di low April 2025 lalu naik.
Dan thn ini 2026, di April juga naik.
Pattern Momentum play.
Dan kalo yg cari saham yg ada flow nya.. ini termasuk.
#hfmMomentum
#SwingPlan
#DailyChart
#IHSG
#hfmTradingCommunity

2
8
48
8,868

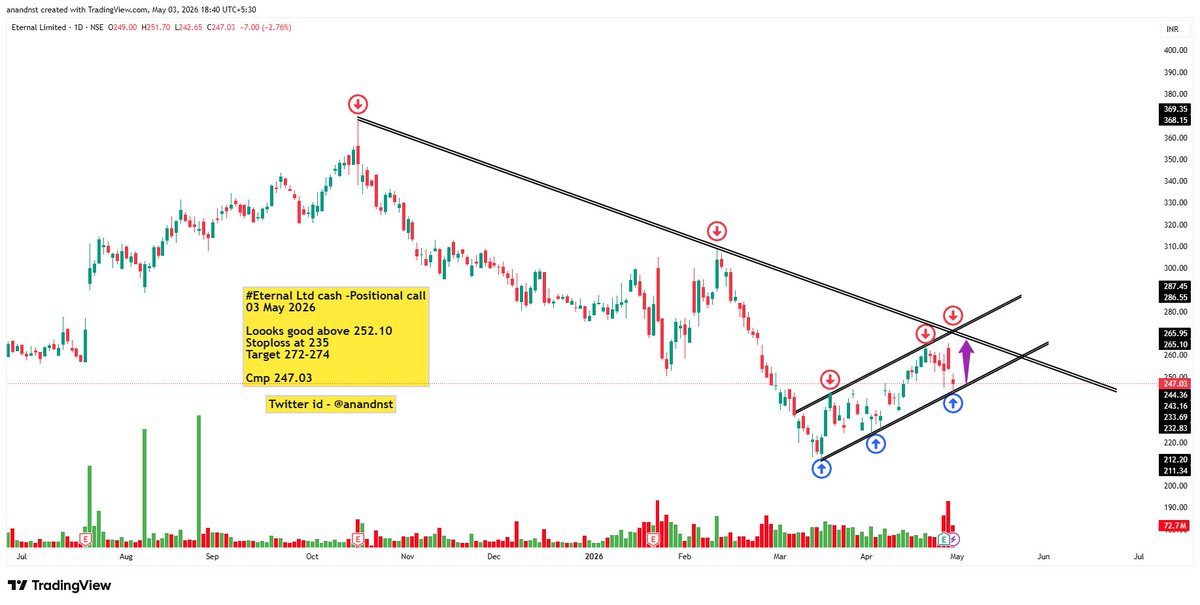
Stock Overview: Eternal Limited
The chart reflects the daily price movement of Eternal Limited, showing a prolonged bearish trend followed by a recent recovery phase. The stock has been forming lower highs for months, but recent price action indicates a possible shift toward bullish momentum as it attempts to break key resistance levels.
Fundamental Analysis
Eternal Limited operates in a competitive business environment where performance depends heavily on sector demand, operational efficiency, and financial discipline. Investors typically evaluate such companies based on revenue growth, profitability margins, debt levels, and future expansion strategies.
If the company demonstrates consistent earnings growth and controlled debt, it becomes attractive for long-term investment. However, if earnings are volatile or margins are under pressure, the stock may remain range-bound. Market sentiment also plays a key role, especially if the company is in a cyclical industry. Any positive developments such as expansion plans, improved earnings, or sector tailwinds can act as catalysts for price appreciation.
From a broader perspective, investors should monitor quarterly results, management commentary, and industry trends before taking long-term positions.
Technical Analysis
The chart clearly shows a strong downtrend marked by a descending trendline connecting multiple lower highs. This indicates sustained selling pressure over time. However, in recent weeks, the stock has started forming higher lows, suggesting accumulation and early signs of trend reversal.
A rising trendline from recent lows indicates improving demand at lower levels. This creates a pattern where price is moving within a narrowing range between a descending resistance line and an ascending support line. This type of structure often leads to a breakout move.
The key resistance zone lies around 252, which is also highlighted as a breakout level. A strong move above this level can confirm bullish momentum and invalidate the previous downtrend structure. Volume activity appears to increase during upward moves, which supports the possibility of accumulation by larger participants.
Momentum indicators, though not explicitly labeled here, appear to support recovery as price is making higher lows. However, the stock still faces resistance from the long-term trendline, making this a crucial decision point.
Key Levels to Watch
The immediate resistance is around 252, and a sustained move above this level could open the path toward 272–274 levels. On the downside, strong support is seen near 235, which also serves as a logical stop-loss level. Below this, the trend could weaken again.
The confluence of resistance from the descending trendline and support from the rising trendline makes the current price zone very important. A breakout or breakdown from this zone will likely define the next major move.
Trading Strategy Insight
A positional strategy can be considered above 252, where confirmation of breakout is visible. Maintaining a stop-loss near 235 helps manage risk effectively. If the breakout sustains, the stock may move toward the 272–274 target zone, offering a favorable risk-to-reward setup.
Traders should avoid early entry before confirmation, as false breakouts are possible in such consolidation patterns. Waiting for strong price action with volume support is a more disciplined approach.
Conclusion
Eternal Limited is currently at a critical technical juncture where a potential trend reversal is developing after a prolonged downtrend. While the fundamentals need continuous monitoring, the technical structure suggests that a breakout above key resistance could trigger a bullish move. Traders and investors should focus on confirmation levels and maintain proper risk management before entering positions.
Hashtags
#EternalLimited #StockMarketIndia #TechnicalAnalysis #FundamentalAnalysis #StockTrading #SwingTrading #BreakoutStocks #IndianStocks #NSEStocks #StockMarketLearning #InvestingIndia #StockAnalysis #MarketTrends #TradingStrategy #EquityMarket #StockMarketTips #VolumeAnalysis #PriceAction #ChartReading #StockMarketEducation #InvestSmart #WealthCreation #LongTermInvesting #ShortTermTrading #StockBreakout #TrendReversal #SupportResistance #MarketAnalysis #StockIdeas #TradingViewAnalysis #IndianEquity #StockInvesting #FinancialMarkets #StockResearch #InvestmentIdeas #BullishStocks #BearishToBullish #MarketMomentum #StockInsights #DailyChart #StockForecast #TradeSmart #StockOpportunities #CapitalMarkets #EquityResearch #InvestorMindset #SmartInvesting #StockWatcher #MomentumTrading #BreakoutTrading
5
394
Apr 24
🚑 sound....
Stock apa yaa...kira2 yg clue nya diatas..
1. Pattern daily chart: VCP
2. Jelas terlihat akumulasi nya
#IDX
#VCP
#DailyChart
#hfmtradesTradingCommunity
2
1,380


📌 FULL VIDEO: youtube.com/watch?v=8x6cD3-j…
Most traders are using VWAP…
but only on 5-minute charts.
That’s the mistake.
Because VWAP is not an intraday tool.
It’s a market positioning tool.
And once you shift it to higher timeframes…
the entire game changes.
Now think about this:
What if one level could tell you…
trend direction
entry zones
and high-probability reversals
across swing and positional trades?
That’s exactly what higher timeframe VWAP does.
But almost nobody uses it this way.
Here’s the shift you need to understand:
Daily VWAP → intraday bias
Weekly VWAP → swing trend
Monthly VWAP → positional direction
Yearly VWAP → major bias
This is not multiple indicators.
This is one framework across timeframes.
Now the real edge:
Price above Weekly VWAP on 4H → buyers in control
Price below Weekly VWAP on 4H → sellers dominate
So instead of guessing…
you align with where the market already is.
But entries don’t come from chasing.
They come from pullbacks.
Price moves away → stretches
Returns to VWAP → opportunity
That’s where trades form.
And when VWAPs align across timeframes…
that’s when probability increases sharply.
Weekly above Monthly above Yearly
That’s not just bullish.
That’s structured strength.
But if you miss this alignment…
you’ll keep entering late
or exiting early
This breakdown shows you:
How VWAP works beyond intraday
How to use Weekly VWAP on 4H charts
How to use Monthly VWAP on Daily charts
Complete swing and positional framework
Entry, stop loss, and target logic
Real examples on Nifty, Bank Nifty & stocks
Once you see this…
VWAP won’t be just another line on your chart.
🎓 Explore structured learning: prorsi.com/courses
📘 RSI Book:
India: amzn.in/d/9k8gK5Y
Global: amazon.com/dp/B0GJ6GX4GF
#VWAP #VWAPStrategy #SwingTrading #PositionalTrading #MultiTimeframe #TechnicalAnalysis #PriceAction #StockMarketIndia #Nifty #BankNifty #TradingStrategy #TrendFollowing #VWAPTrading #4HourChart #DailyChart
13
79
5,292

Und wieder sind wir an dem Punkt:
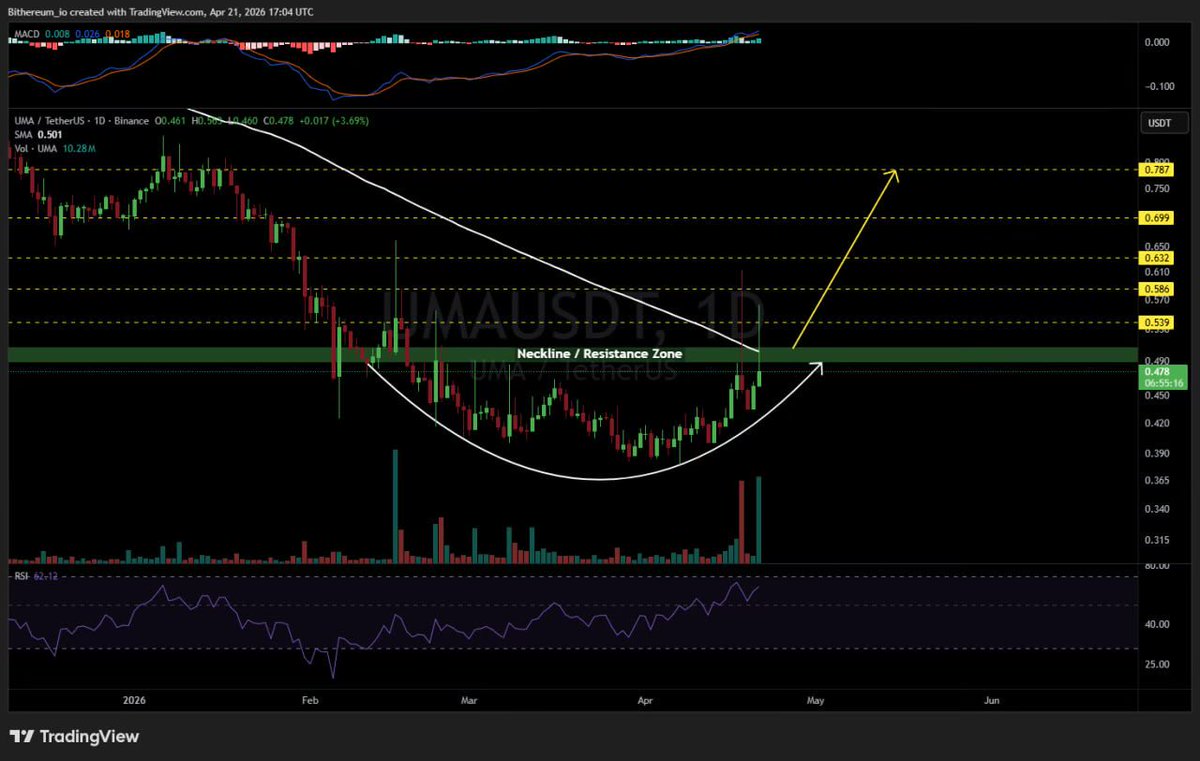
Der MoneyFlow Indikator steht kurz vor einem Übergang ins Grüne auf dem Dailychart.
Vision $VSN hat das seit dem Start noch nicht gesehen.
Wird spannend!


Zusammengefasst:
- bullische Divergenz im Wavetrend
- bullische Divergenz beim RSI
- Moneyflow an der Schwelle zu grün (gabs historisch bei $VSN noch nie)
- bullische Divergenz im Moneyflow
- weit überverkaufter RSI - wieder
Das bedeutet nicht, dass es keine Chance gibt, zu fallen.
Aber Charttechnisch gibt es ein gutes Potenzial für ein Reverse.
2
3
17
1,685

Mar 30
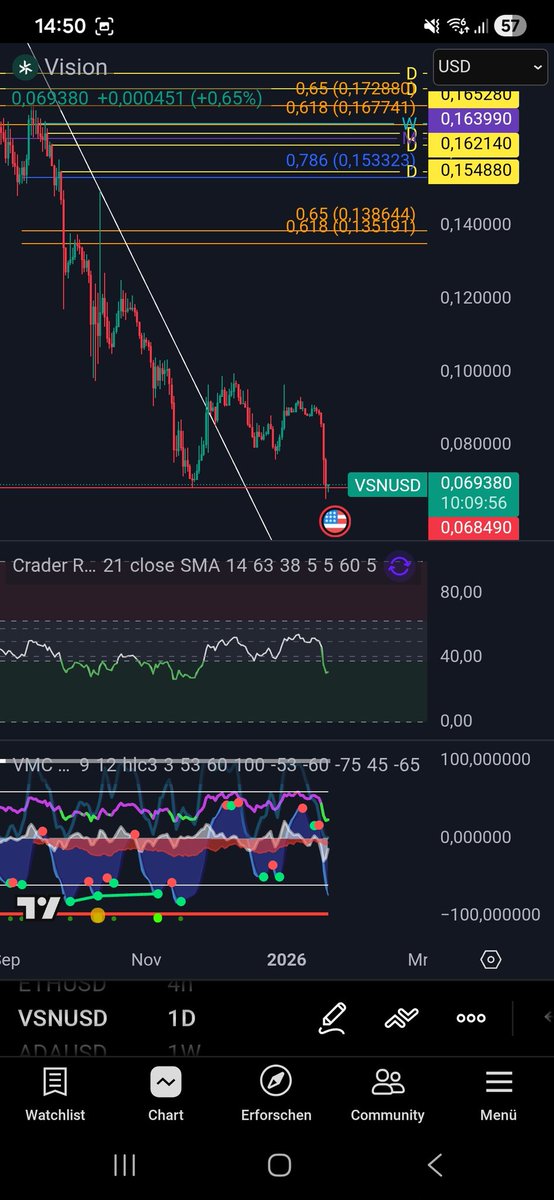
#Oilindia
Current Price: 475
Consolidation support 460-57
Upside: 505 and 524
1. YTD support on daily Chart at 460-55
2. Volume Spurt on chart
3. Trading above MA and MA-Plot support
4. Falling wedge on dailyChart
1
7
42
2,237