
📌 FULL VIDEO: youtube.com/watch?v=8x6cD3-j…
Most traders are using VWAP…
but only on 5-minute charts.
That’s the mistake.
Because VWAP is not an intraday tool.
It’s a market positioning tool.
And once you shift it to higher timeframes…
the entire game changes.
Now think about this:
What if one level could tell you…
trend direction
entry zones
and high-probability reversals
across swing and positional trades?
That’s exactly what higher timeframe VWAP does.
But almost nobody uses it this way.
Here’s the shift you need to understand:
Daily VWAP → intraday bias
Weekly VWAP → swing trend
Monthly VWAP → positional direction
Yearly VWAP → major bias
This is not multiple indicators.
This is one framework across timeframes.
Now the real edge:
Price above Weekly VWAP on 4H → buyers in control
Price below Weekly VWAP on 4H → sellers dominate
So instead of guessing…
you align with where the market already is.
But entries don’t come from chasing.
They come from pullbacks.
Price moves away → stretches
Returns to VWAP → opportunity
That’s where trades form.
And when VWAPs align across timeframes…
that’s when probability increases sharply.
Weekly above Monthly above Yearly
That’s not just bullish.
That’s structured strength.
But if you miss this alignment…
you’ll keep entering late
or exiting early
This breakdown shows you:
How VWAP works beyond intraday
How to use Weekly VWAP on 4H charts
How to use Monthly VWAP on Daily charts
Complete swing and positional framework
Entry, stop loss, and target logic
Real examples on Nifty, Bank Nifty & stocks
Once you see this…
VWAP won’t be just another line on your chart.
🎓 Explore structured learning: prorsi.com/courses
📘 RSI Book:
India: amzn.in/d/9k8gK5Y
Global: amazon.com/dp/B0GJ6GX4GF
#VWAP #VWAPStrategy #SwingTrading #PositionalTrading #MultiTimeframe #TechnicalAnalysis #PriceAction #StockMarketIndia #Nifty #BankNifty #TradingStrategy #TrendFollowing #VWAPTrading #4HourChart #DailyChart
13
79
5,292
📌 FULL VIDEO: youtube.com/watch?v=8x6cD3-j…
Most traders are using VWAP completely wrong.
They think it’s only for intraday.
That assumption alone is costing them real trades.
Because VWAP is not limited to one timeframe.
And when you shift it… everything changes.
Now look at this carefully.
What if you could read trend direction…
identify exhaustion…
and catch high-probability reversals…
using ONE reference level?
That’s where Monthly VWAP on the 4H chart comes in.
And almost nobody is using it properly.
Here’s the core shift:
VWAP is not just price.
It combines price time volume.
Which means:
You’re tracking where real participation happened.
Not just where price moved.
Now the logic becomes simple… but powerful:
If price is above Monthly VWAP → buyers are in control.
If price is below Monthly VWAP → sellers dominate.
So instead of guessing direction…
you align with where the market is already positioned.
But the real opportunity is not trend.
It’s the deviation.
When price moves too far away from VWAP…
that’s not strength.
That’s imbalance.
And imbalance doesn’t last.
This is where the “snapback” happens.
Price stretches.
Liquidity dries.
And then it pulls back toward VWAP.
That move… is where high-probability trades exist.
But here’s the mistake most traders make:
They treat every pullback as reversal.
Wrong.
Some moves snap back.
Some actually flip trend.
If you can’t differentiate this…
you’ll keep getting trapped.
This is exactly what is broken down step by step in the video:
How to use Monthly VWAP on 4H charts
How to identify bullish vs bearish bias
How to spot overextension
How to trade snapback with proper entries, SL & targets
How to avoid false reversals
Real examples on Nifty, Bank Nifty & stocks
Once you see it…
you won’t look at VWAP the same way again.
🎓 Explore structured learning: prorsi.com/courses
📘 RSI Book:
India: amzn.in/d/9k8gK5Y
Global: amazon.com/dp/B0GJ6GX4GF
#VWAP #MonthlyVWAP #VWAPStrategy #VWAPTrading #SnapbackTrading #SwingTrading #4HourChart #TechnicalAnalysis #PriceAction #StockMarketIndia #NiftyTrading #BankNifty #IntradayTrading #TradingStrategy #LearnTrading #MarketStructure
1
9
1,241

The "4-Hour Chart" Meme 🤡
When you're trying to trade the 4-hour chart while the world’s shipping lanes are blocked and the DXY is collapsing. 🤡
"It needs to confirm," they say, while the algorithms have already front-run the entry and exit. Stop trading the news; you are too slow. Trade the liquidity. 📉🚫
#Scalping #Volatility #TradingMemes #Forex #Crypto #4HourChart

2
20


15 Jun 2025
📉 Bitcoin 4-Hour Chart Update:
We’ve got a falling wedge trying to break out… but we’re still under the 21 & 200-day moving averages.
Can this double bottom play out—or will we test the $102,600 wick again?
Key levels:
🔸 21 MA & 200 MA = make-or-break
🔸 Watch for a breakout rejection or full reversal
🔸 If rejected again → likely retest $102.6K or lower
⚡️ More insight in the full episode 61
NOT FINANCIAL ADVICE! I'M NOT A FINANCIAL ADVISOR!
#Bitcoin #BTC #CryptoAnalysis #FallingWedge #BTCUpdate #BitcoinCrash #CryptoTrader #FlexCandle #CryptoMarkets #BitcoinPrice #BearishOrBullish #BTCLevels #4HourChart #CryptoX
1
31

27 May 2025
Invest in India💥
Ever feel like the market moves just before you act? 🤔
That’s because you’re watching the wrong time frame.
🔍 The 4-hour chart is the sweet spot—used by pros to track institutional footprints, spot high-probability entries, and ride powerful trends before they go mainstream.
From 🔥 Natural Gas explosions to 🥇 Gold breakouts and ☕ Coffee reversals, the 4H chart reveals the real story—before the crowd catches on.
Ready to uncover what seasoned traders already know? 👀
#4HourChart⏳ #CommoditiesTrading📈 #SmartMoney🧠 #TradeSetups🚀
1
1
53
13 May 2025
Invest in India💥
Think you’ve seen the full picture on commodities? 🤔
The 4-hour chart is where the real moves are brewing – not daily, not weekly.
📉 Crude Oil turning?
📈 Gold prepping a breakout?
🌽 Corn collapsing before you even blink?
Discover the mid-term sweet spot pros use to catch trend shifts before the herd — and why ignoring this timeframe could be costing you serious money. 💸
🧠 It’s not magic. It’s wave precision, Fibonacci timing, and a trader’s edge.
Join the thread and start spotting what others miss. 🎯
#CommoditiesTrading📦 #4HourChart⏱️ #TradingStrategy🔥
1
1
57
7 May 2025
Invest in India💥
Think you're reading the market right? 📉📈
What if the real moves are hiding in the 4-hour charts? 👀
From Gold's silent rally to Crude Oil's stealth drop — these charts don’t lie.
Unlock the patterns top traders use (but rarely share).
Your edge starts here. 🧠💰
#4HourChart🕓 #CommoditiesTrading⚙️ #ChartSmart📊
1
68
2 May 2025
Invest in India💥
Are you overlooking goldmines hidden in plain sight? 🧐
The 4-hour chart is where smart money moves silently — revealing patterns missed on daily & 15m setups. 📊
From 🛢️ Crude Oil to 🥇 Gold & ☕ Coffee — see how pros spot breakout waves before the crowd.
Unlock high-probability trades you’re not seeing... yet. 🔓
Join the wave riders. 🌊
#CommoditiesTrading📦 #4HourChart⏱️ #TradingAlpha🚀 #Gold🥇 #CrudeOil🛢️ #Coffee☕ #NaturalGas🔥 #ChartMastery📈 #InvestSmart💡 #ElliottWave📐
1
1
64

24 Dec 2024
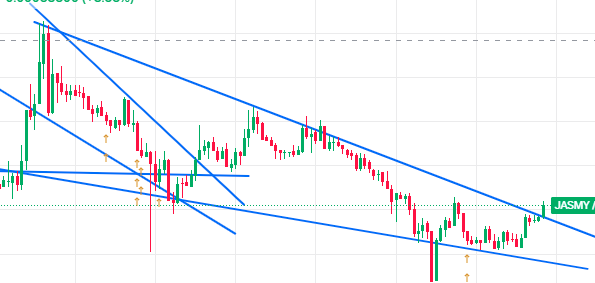
$JASMY is breaking out upwards on my 4 hour #charts !
Do you realize the power of this #japanesebeauty ?
It is called the $BTC of #Japan for a reason!
#JASMY #jasmycoin #4hourchart #up #LFG
2
381

17 Dec 2024
EURUSD mapping on 4-hour chart. No opportunity for now, however, good to buy on dips. See the video for more detailed insight.
#EURUSD #BuyOnDips #4HourChart #ForexAnalysis #ForexTrading #CurrencyMarket #MarketInsights #TradingStrategy #DipBuying #ForexSignals
2
5
12
435

Will Baby Dogecoin 🚀 Break to 1 Billion Market Cap? 💰
#BabyDoge #MarketCap #CryptoTrading #PriceAnalysis #MemeCoins #CryptoGrowth #4HourChart #CryptoInsights #BullMarket #Altseason
1
2
183

31 Oct 2024
Check out my #IWM analysis on @TradingView: /chart/IWM/xIdZk9Rl-SPX-7-Minute-Chart-Analysis-Identifying-Bullish-Momentum/
youtube.com/@DenoTrading?sub…
#SPY, #SP500, #SPYAnalysis, #SnP500, #StockMarket, #PriceAction, #TechnicalAnalysis, #MovingAverages, #MACD, #StockTrading, #ResistanceLevels, #SupportLevels, #BullishBreakout, #BearishReversal, #Trendlines, #DailyChart, #WeeklyChart, #4HourChart, #SwingTrading, #MarketTrends, #DenoTrading
2
113

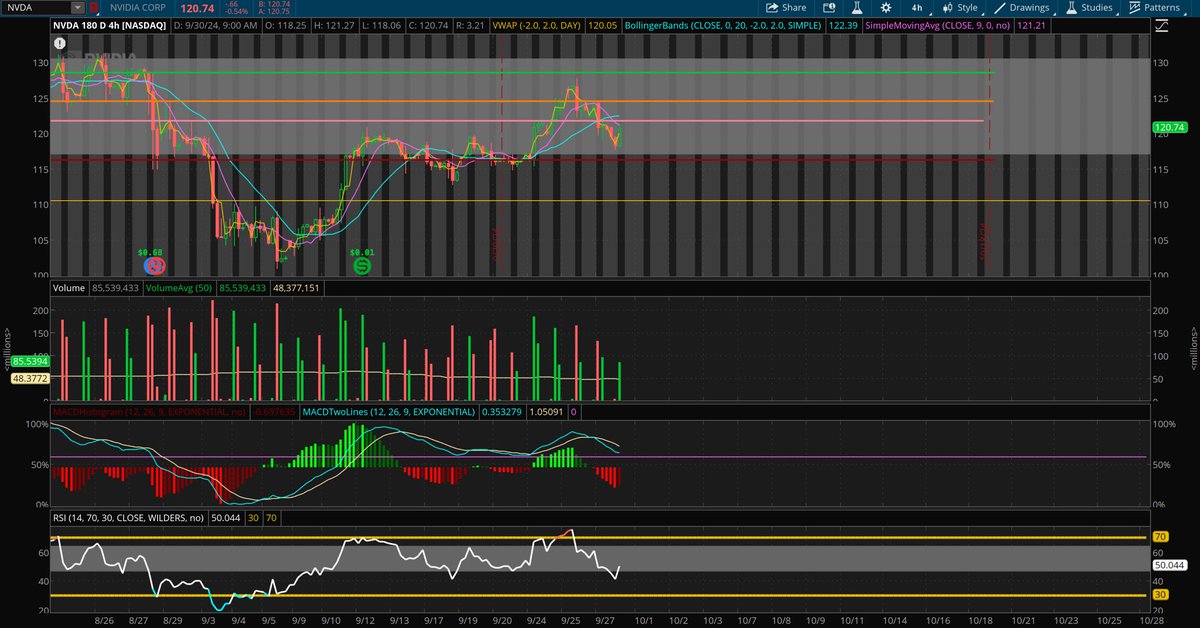
30 Sep 2024

3
1
2
352

2 Sep 2024
Afternoon session saw a rebound, but after altcoins hit new lows. Is it bottomed out? Personally, I don't think so. Even if there's a rebound, the best time would be during non-farm payrolls. The S&P remains strong, indicating that it's just the crypto market that's lacking funds; other markets still have money. It seems they're just shaking out the crypto space. Daily Chart: A brief dip and rebound, with resistance still present. The bottom support is around 56,000, with recent support near 57,000. Resistance levels are around 60,500 and maximum resistance near 65,000. 4-Hour Chart: The trend follows a normal oscillation pattern. Only above 59,000 can we consider a bullish trend in the 4-hour timeframe. Current resistance levels are around 59,200 and 60,000. Bitcoin's recent plunge is normal, mainly due to political uncertainty in the U.S. and economic instability, with risks of a hard landing. Big drops and spikes are normal now; just focus on surviving. There's no need to worry too much about other things. Intraday: A short-term rebound may occur, with resistance around 58,800 and bottom support at 57,700. If we break above 58,800, we can look for a 4-hour rebound. Let's take it step by step. The spot market needs to weather this tough moment in crypto history calmly. #加密货币 #Crypto #比特币 #Bitcoin #市场分析 #MarketAnalysis #日线图 #DailyChart #4小时图 #4HourChart #行情分析 #MarketUpdate #金融 #Finance #投资 #Investment #风险管理 #RiskManagement #区块链 #Blockchain #加密市场 #CryptoMarket #美国政治 #USPolitics #经济稳定 #EconomicStability #技术分析 #TechnicalAnalysis #资金管理 #FundManagement #现货市场 #SpotMarket #反弹 #Rebound #支持与阻力 #SupportResistance #市场趋势 #MarketTrends #风险投资 #VentureCapital

1
85

1 Sep 2024
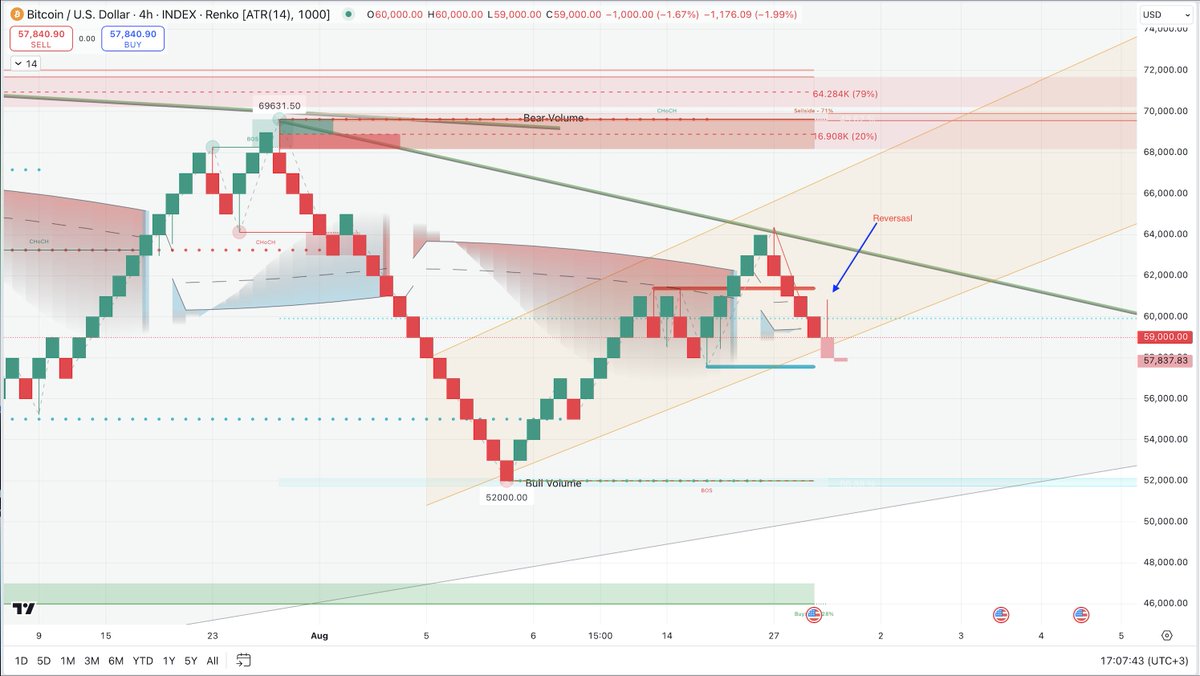
On the 4-hour Renko chart, there is a reversal signal below 58K, and it is breaking out of a minor uptrend.
#Crypto #Bitcoin #BTC #RenkoChart #Reversal #CryptoAnalysis #4HourChart
3
217

26 Jul 2024
Hey CryptoFam! 🌟
I’m taking another look at my analysis from July 22, 2024. 😉
I already hinted that there was still power in the 4-hour chart. Currently, I still see strength in the 4-hour chart.
The problem is, I see this power ending exactly at the end of the week.
However, this is not the case for every asset.
For example, the Dollar looks pretty good.
You get it, right? 😉
Thank you all! Everyone is welcome.
Also, feel free to check out my newly created Long/Short list.
More on short-term trading strategies coming soon. You obviously want to see something! 😎✨
#CryptoAnalysis #4HourChart #Trading #CryptoFam #LongOrShort #StayTuned
22 Jul 2024

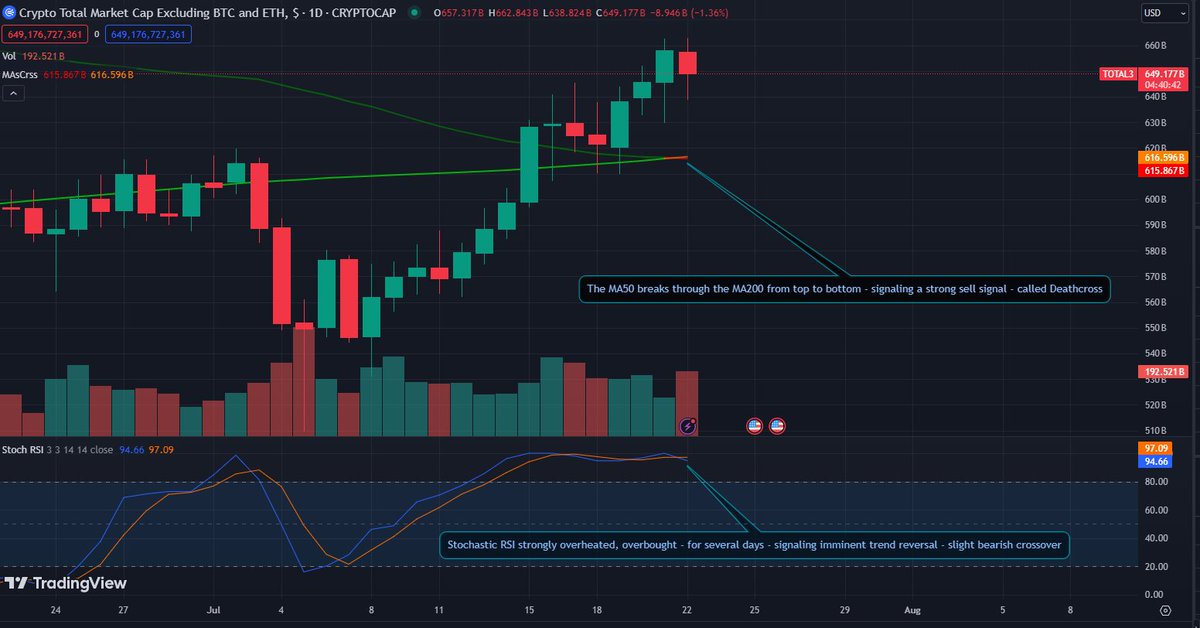
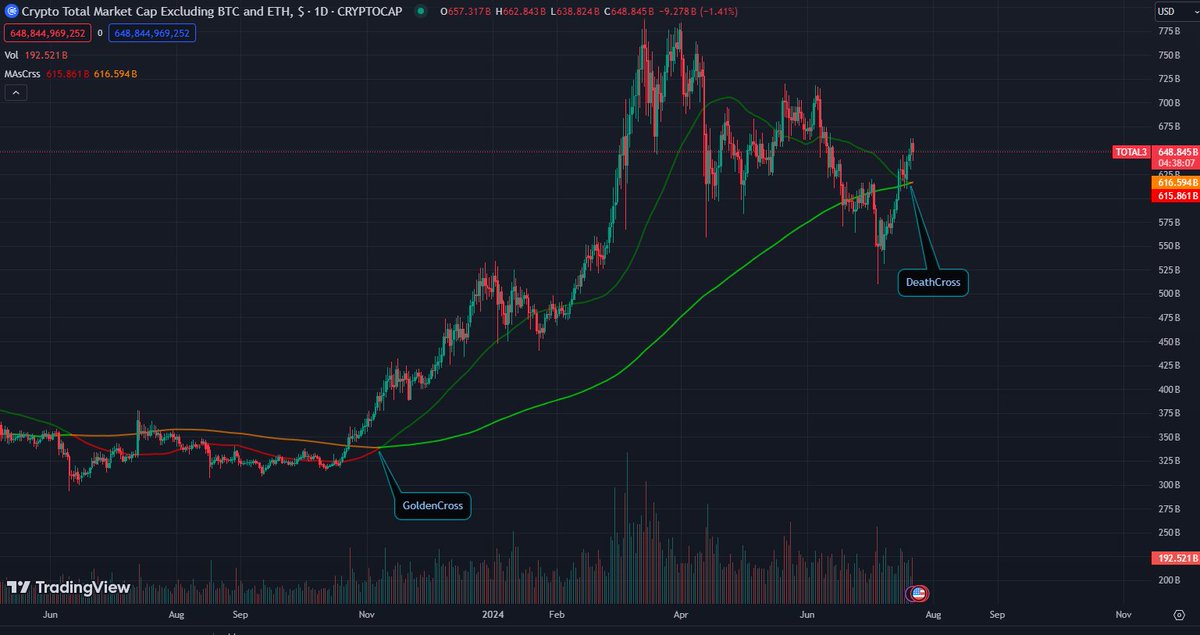
🚨 Attention: Death Cross Alert! 🚨
Dear Crypto Community,
As we experience a surge of greed in an overbought market and hear some amusing stories 😄, I've brought you the TOTAL3 Crypto Market Cap 1D $ update.
From yesterday to today, we've seen a Death Cross 📉.
This signals a potential longer downtrend for most altcoins.
Not ALL of them!!! We are noticing increasing weakness in the market.
A few days ago, I shared various indicators showing decreasing upward momentum and the possibilities of deeper resistance or support levels.
Now, combined with the Death Cross (MA50 crossing below MA200), this could surprise many. This is all on a daily basis.
On the 4-hour basis, we can still see upward momentum.
Likewise, many assets also look good on the weekly basis 📈.
Explanation on why we might still see a downward trend:
The 4-hour basis, daily basis, or weekly basis can take several periods to unfold or come to a halt.
For example, 20 periods of the 4-hour chart might mean we see the end of this week before the downtrend on the daily basis fully unfolds.
Which assets still look bullish?
Follow me for more exciting updates!
Thank you. Everyone is welcome. 🙌
#Crypto #Altcoins #MarketUpdate #DeathCross #CryptoCommunity #Bullish #Bearish #Trading #Investing #CryptoNews
2
138

cryptocurrency across daily, 4-hour, 1-hour, and 15-minute time frames! 📈Identify trade setups, and optimize your trading strategy.#Cryptocurrency #CryptoTrading #1DayChart #4HourChart #1HourChart #15MinChart #TechnicalAnalysis #MarketInsights #Blockchain #Investing #TradeSetups

2
62

