
Power in AI is not only a merit system. It is a network system.
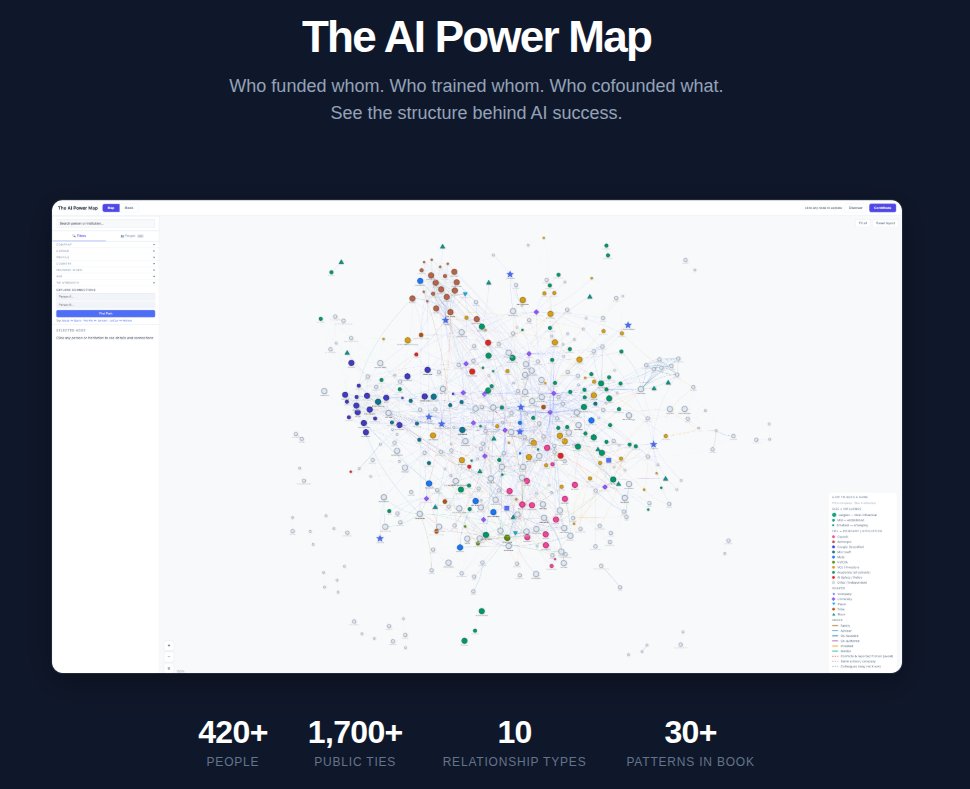
This is the core argument of The AI Power Map: a free 70,000-word companion book with an interactive graph of 420 people and 1,709 documented edges tracing how influence, trust, talent, and capital move across the AI industry.
The graph is the method. 8 methods of analysis were applied across the dataset, including betweenness centrality, community detection, motif analysis, and cofounder cluster identification.
The result is a map of recurring structural patterns: talent pipelines, diaspora arcs, acqui-hire chains, and the trust bridges that survive org chart changes.
Key findings from the network:
Stanford (77 nodes) and Google (#1 exporter) are the two dominant talent factories. School lineage, not company affiliation, is the stronger cohesion signal:
Sutskever, Gomez, and Karpathy share a Hinton-Toronto lineage across 5 different employers, visible in the graph edges, not inferred.
Network position is the strongest visible predictor of tier. T1 individuals average significantly more documented connections than lower-tier members.
8 canonical power transfer motifs repeat across the network: the walkout-to-lab pattern (OpenAI → Anthropic), the acqui-hire-as-talent-capture pattern (Google → DNNresearch), the reputation-round pattern (SSI: $32B, no product, no revenue).
Sam Altman holds the highest betweenness centrality in the dataset (0.145), connecting more disconnected subgraphs than anyone else. One node. 38 direct ties. YC, OpenAI, and Microsoft capital bridged through a single person.
The November 2023 board crisis resolved not through formal governance but through social capital: a staff letter, a private conversation, and external leverage. The network held the institution together, not the org chart.
The Transformer Eight paper is a single source node that produced a generation of careers and at least 3 frontier labs. One co-authored paper, eight trajectories, and an entire subgraph of the modern AI industry.
This is applied network science on one of the most consequential domains of our time. The interactive map lets you explore paths between nodes, filter by community, tie strength, and institution, and trace influence across the full connected graph.
By Yumi Kimura
map.behaviorgraph.com/?view=…
#NetworkScience #GraphAnalytics #GenAI #SocialNetworkAnalysis #AIIndustry
--
🤝 Put your graph tech brand in front of the people who matter
Your graph technology deserves to be seen by buyers, analysts, and builders who are actively shaping the space.
The Year of the Graph is the independent hub that this community trusts.
Slots for the upcoming Summer 2026 Issue are filling fast. Reach out and book yours now 👇
yearofthegraph.xyz/contact/
2
9
412

May 8
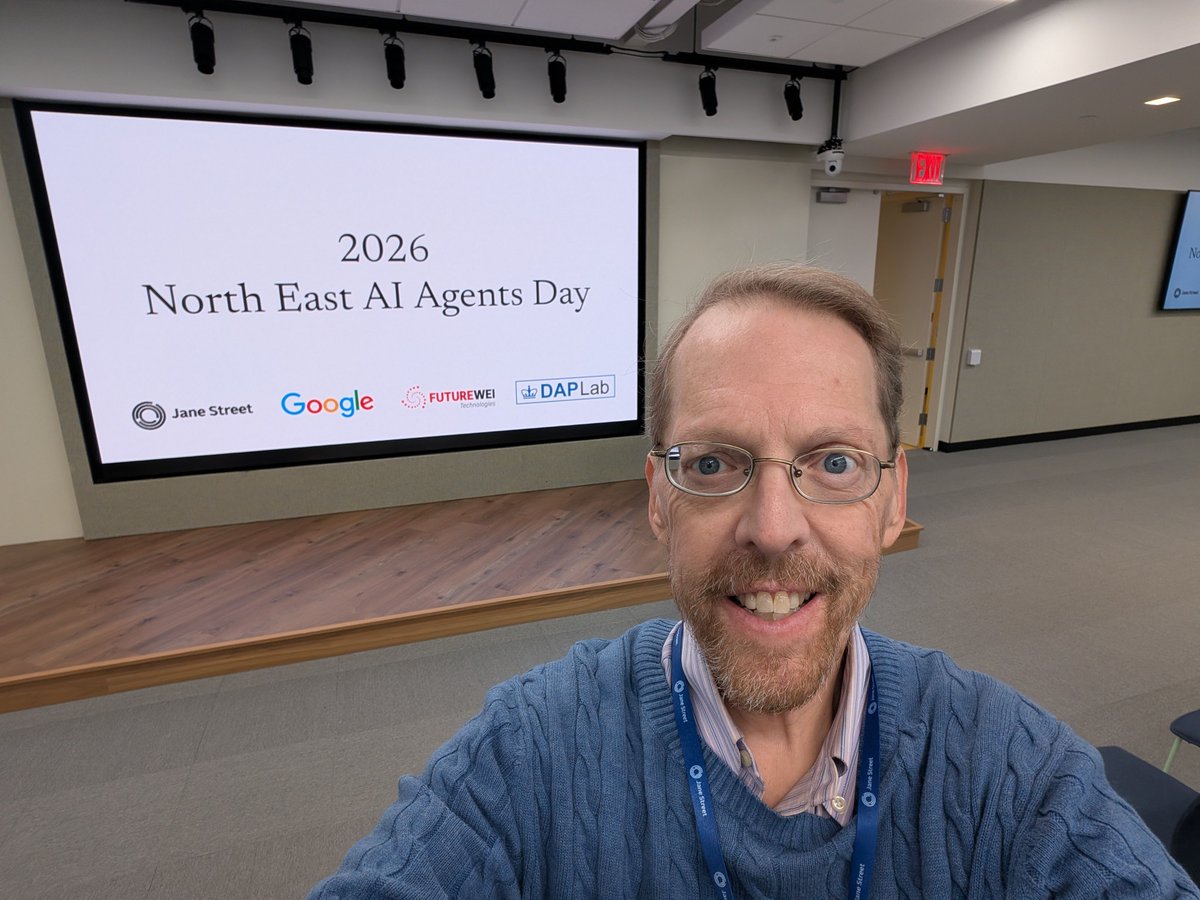
Great day at North East AI Agents Day at @JaneStreet NYC. Honored to give a talk on "Agentic Exploration of Large-Scale Graphs with Arkouda and Arachne." Thanks to the organizers for convening such a sharp crowd. #AIAgents #HPC #GraphAnalytics #LLM
ne-agents-day.github.io/
1
2
125

Apr 5
If your model is 70% accurate per step across a 10-step investigation, your actual success rate isn’t 70%.
It’s ~2.8%.
Even pushing to 90–95% per step doesn’t fix it:
→ 90% per step = ~35% overall
→ 95% per step = ~60% overall
That’s still not reliable enough for real-world security investigations.
This is the gap between demo-grade AI and production-grade systems.
Accuracy compounds.
So does failure.
Sign up for early access and receive updates with full videos → louie.ai/
Our upcoming AI agents for security training → louie.ai/trainings
#ai #cybersecurity #aiagents #securityoperationscenter #threatdetection #graphanalytics
3
168

Mar 11
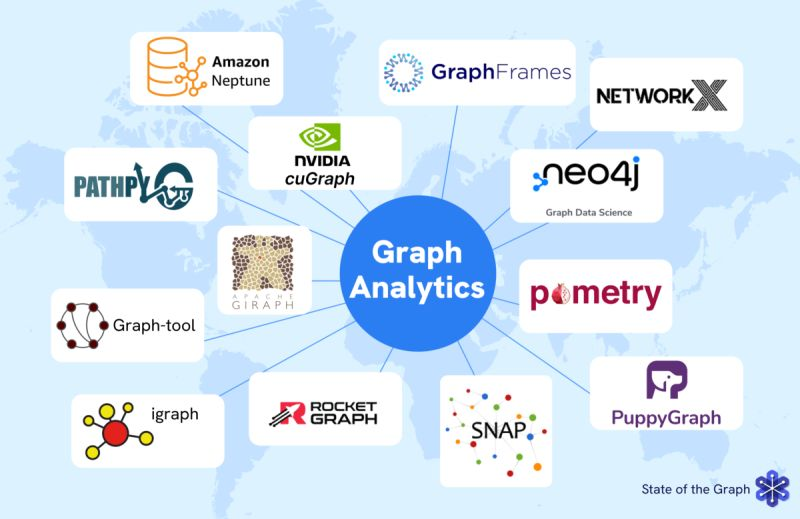
A visual map of the Graph Analytics landscape
Graph analytics uses graph queries and algorithms to uncover patterns and relationships in connected data, from fraud rings and attack paths to recommendation paths, communities, and influence.
It sits at a key intersection in the graph stack, where data platforms, algorithms, and applications come together to reveal structure you can’t see in rows and columns.
The State of the Graph recently published an open access catalog of all offerings in the Graph Analytics category, with detailed information for each one.
Today they published a visual aid to help navigate this landscape.
📌 Explore the catalog and visualization: stateofthegraph.com/graph-an…
#visualization #graphanalytics #algorithms #datascience
--
Connected Data London 2025 brought together leaders and innovators. Were you there?
🎥 Watch the sessions: 2025.connected-data.london/
📩 Join the community: connected-data.london
Join community legends and new voices in #CDL25 for all things #KnowledgeGraph #Graph #analytics #datascience #AI #graphDB #SemTech #Ontology
2
5
296

Feb 18
🗺️ The Graph Analytics market is heading toward $9.5B by 2032 - but can you navigate it?
Graph technology has evolved from a niche curiosity to a multi-billion dollar market, and it's accelerating fast with AI.
But for engineers, data scientists, architects, and technology leaders, the tooling landscape can feel overwhelming and fragmented.
That's exactly why we built The State of Graph: a comprehensive, structured repository, visualization, and analysis of the entire graph technology space.
Today, we're sharing the first of 7 categories: 🔍 Graph Analytics
Graph analytics uncovers patterns in connected data powering use cases like:
→ Fraud detection & network security
→ Risk propagation & anomaly detection
→ Community analysis & influence mapping
→ BI, retail, and social networks
📊 The numbers speak for themselves: $2.41B in 2025 → $9.49B by 2032 (21.61% CAGR)
This catalog is built for those who are choosing, building, or evaluating graph analytics tools.
Not just listing everything, but mapping how frameworks, libraries, and platforms align with real-world constraints. We limit inclusion to tools where graph algorithms are core functionality, not afterthoughts.
This project started as a hallway conversation at Connected Data London 2024, and has been a labor of love throughout 2025 with Maya Natarajan and Anisha Mane. We debuted it live at @Connected_Data London 2025, and now it's yours to explore.
👉 Check out the Graph Analytics Catalog v.1: stateofthegraph.com/2026/02/…
Do you have questions, feedback, or want help navigating it? Reach out - we'd love to hear from you.
#GraphAnalytics #GraphTechnology #DataScience #ConnectedData #NetworkAnalysis #FraudDetection #AIInfrastructure #DataEngineering #TechTrends #EmergingTech #Analytics #Algorithms
2
99

Feb 10
Algorithms on Trees and Graphs (with Python Code): amzn.to/3IrmKWs
——————
#AI #MachineLearning #DataScience #ML #LinkedData #GraphDB #GraphAnalytics #KnowledgeGraphs #RAG #LLMs #DataScientist
13
95
2,054
Jan 28
Algorithms on Trees and Graphs (with Python Code): amzn.to/3IrmKWs
——————
#AI #MachineLearning #DataScience #ML #LinkedData #GraphDB #GraphAnalytics #KnowledgeGraphs #RAG #LLMs #DataScientist

30
237
6,648

Graph Analytics uncovers hidden relationships in complex data using nodes and links, enabling smarter decisions in fraud detection, networks, and recommendation systems.
#GraphAnalytics #BigData #AI #DataScience #NetworkAnalysis
marketresearchfuture.com/rep…
2
11
Jan 14
#Algorithms on Trees and Graphs (with #Python Code): amzn.to/3IrmKWs
——————
#AI #MachineLearning #DataScience #ML #RDF #LinkedData #GraphDB #GraphAnalytics #Semantic #KnowledgeGraphs #RAG #LLMs #DataScientist

3
31
144
3,940
Jan 3
#Algorithms on Trees and Graphs (with #Python Code): amzn.to/3IrmKWs
——————
#AI #MachineLearning #DataScience #ML #RDF #LinkedData #GraphDB #GraphAnalytics #Semantic #KnowledgeGraphs #RAG #LLMs #DataScientist

2
10
58
2,266

21 Dec 2025
How OPNGraph Speeds Up Data-Heavy Apps @IOPn_io
Big data is not slow. Moving it is. OPNGraph keeps related data close, so queries travel less and finish faster.
It stores your world as a graph: nodes are things, edges are links. Queries follow links directly, not heavy joins. Less shuffling - more answers.
Smart indexes and caching cut disk trips. Parallel traversals use all cores. Streaming updates change only what moved, so freshness stays high without reprocessing everything.
Result: faster recommendations, fraud checks, and route planning in minutes, not hours. Want a quick speed check on your app? Reply with one bottleneck and we will share a graph-first approach. #DataPerformance #GraphAnalytics

60
53
192
20 Dec 2025
#Algorithms on Trees and Graphs (with #Python Code): amzn.to/3IrmKWs
——————
#AI #MachineLearning #DataScience #ML #RDF #LinkedData #GraphDB #GraphAnalytics #Semantic #KnowledgeGraphs #RAG #LLMs #DataScientist
3
13
102
3,903

18 Nov 2025
OneLake in @MicrosoftFabric just got its graph engine — and it speaks @ApacheIceberg. ⚡️
@puppyquery now supports @Microsoft OneLake via the OneLake Table API for Iceberg → run real-time graph analytics with zero ETL, no graphdb, and sub-second traversals.
openCypher Gremlin on your Fabric tables.
Cyber, observability, fraud, ops, GraphRAG — all on OneLake.
Huge thanks to @royhasson the Fabric team 🙌
🎥 Demo below. Full blog link in comments.
#MicrosoftFabric #OneLake #Iceberg #GraphAnalytics
1
1
3
300
18 Nov 2025
Complex Network Analysis in #Python — Recognize • Construct • Visualize • Analyze • Interpret: amzn.to/2Rw8ZKL
——————
#DataScientist #DataScience #AI #Semantic #MachineLearning #LinkedData #GraphDB #GraphAnalytics #NetworkScience #DataStorytelling

3
15
1,464
9 Nov 2025
Context fuels and boosts the #AI revolution!
———
#DataScience #MachineLearning #ML #DataSecurity #GraphAnalytics #Semantics #KnowledgeGraphs #IoT #LinkedData #InternetOfContext #Neo4j
———
➕See these books:
>amzn.to/34utTz7
>amzn.to/317XV9L

4
5
1,605
8 Nov 2025
Complex Network Analysis in #Python — Recognize • Construct • Visualize • Analyze • Interpret: amzn.to/2Rw8ZKL
——
#DataScientist #DataScience #AI #Semantic #MachineLearning #LinkedData #GraphDB #GraphAnalytics #NetworkScience #DataStorytelling

4
6
27
2,415
30 Oct 2025
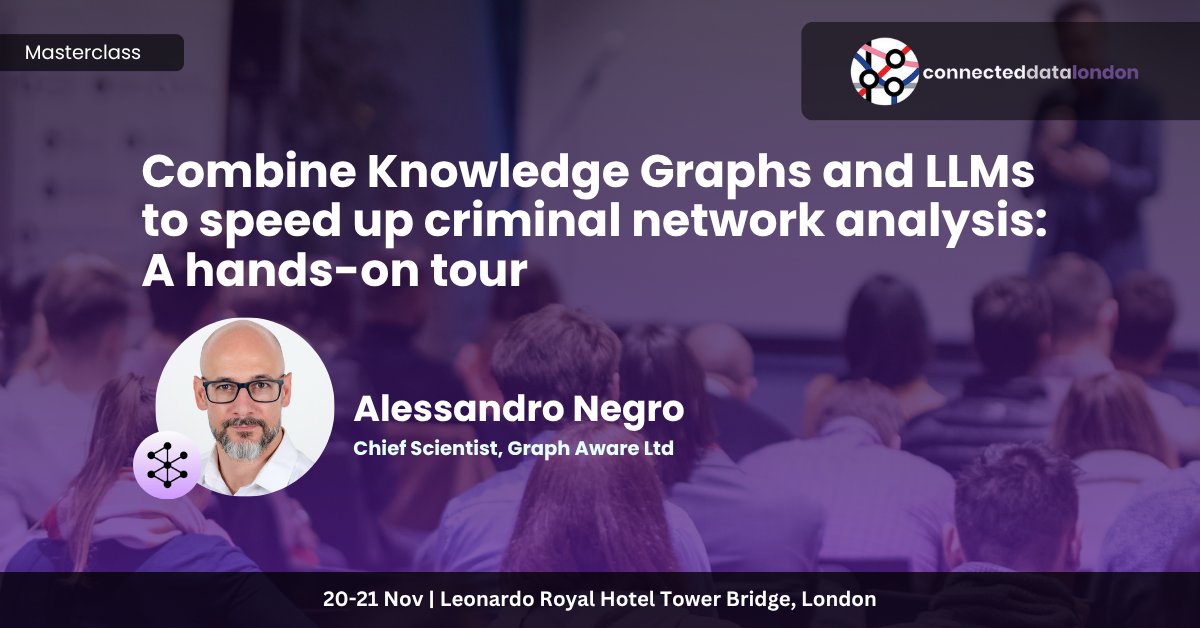
🕵️♂️ Supercharge network analysis with Alessandro Negro, Chief Scientist at @graph_aware, in his masterclass: “Combine Knowledge Graphs and LLMs to speed up criminal network analysis: A hands-on tour”
Learn how to merge knowledge graphs and LLMs to uncover hidden patterns in complex relational data and generate professional intelligence reports faster, more reliably, and with explainable outputs.
In this hands-on session, you’ll:
✅ Transform raw relational data into meaningful co-occurrence networks
✅ Apply graph analytics, community detection, and centrality measures
✅ Build multi-agent AI workflows using LangGraph
✅ Implement systematic prompt engineering and evaluation frameworks
Perfect for data scientists, AI engineers, and analysts working with complex relational data.
👉 Join Alessandro at Connected Data London 2025 on 20–21 November at the Leonardo Royal Hotel London Tower Bridge. Reserve your spot: 2025.connected-data.london/t…
#CDL25 #ConnectedDataLondon #KnowledgeGraphs #GraphAnalytics #LLM #GraphRAG #ExplainableAI #DataScience #NetworkAnalysis
1
4
199
26 Oct 2025
#Algorithms on Trees and Graphs (with #Python Code): amzn.to/3IrmKWs
——————
#AI #MachineLearning #BigData #DataScience #RDF #LinkedData #GraphDB #GraphAnalytics #Semantics #KnowledgeGraphs #RAG #LLMs #DataStructures #DataScientist #Coding
1
50
274
10,104
26 Oct 2025
Complex Network Analysis in #Python — Recognize • Construct • Visualize • Analyze • Interpret: amzn.to/2Rw8ZKL
——
#DataScientist #DataScience #AI #Semantic #MachineLearning #LinkedData #GraphDB #GraphAnalytics #NetworkScience #DataStorytelling
1
21
87
4,876
22 Oct 2025
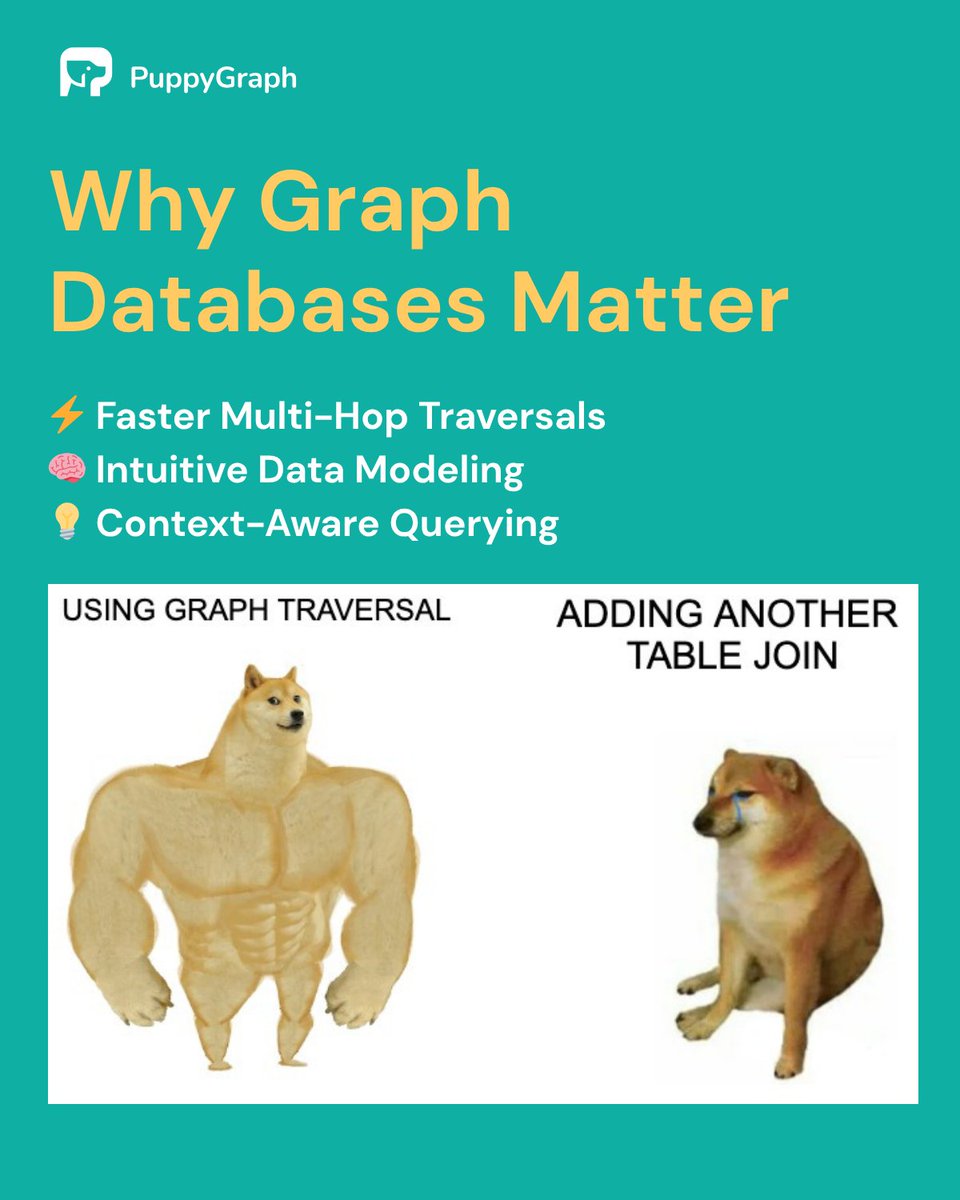
𝗚𝗿𝗮𝗽𝗵𝘀 𝘁𝘂𝗿𝗻 “𝗿𝗼𝘄𝘀” 𝗶𝗻𝘁𝗼 𝗿𝗲𝗮𝗹 𝗮𝗻𝘀𝘄𝗲𝗿𝘀.
Most of your toughest questions are multi-hop and context-heavy. That’s where graph shines: faster traversals, intuitive modeling, and queries that keep relationships intact.
🧑🤝🧑 Social networks → personalization, communities, influence paths
💳 Fraud detection → rings across cards, devices, merchants
🛍️ Recommendations → context-driven recommendations
🖧 Network & IT ops → topology, capacity, service dependencies
🧠 Knowledge graphs → semantic search, unified data, better RAG
🩺 Healthcare → patient journeys, drug discovery, disease tracking
But separate graph DBs mean complex ETL and maintaining multiple copies of data, and momentum dies when edges grow.
That's where PuppyGraph shines 🌟
PuppyGraph isn’t a database. It’s a 𝘨𝘳𝘢𝘱𝘩 𝘲𝘶𝘦𝘳𝘺 𝘦𝘯𝘨𝘪𝘯𝘦 🐾
✅ Zero ETL. Point directly at your existing tables
✅ Define nodes and edges as flexible graph views
✅ Query with Cypher or Gremlin in minutes
✅ Built for petabyte-level scalability
👀 Check the carousel for a sneak peek into the power of graph analytics (blog link at the end!)
#Graph #GraphAnalytics #GraphRAG #Security #Fraud #RecommendationSystems #ITOps #Healthcare #DataEngineering #PuppyGraph


1
2
47