
Power in AI is not only a merit system. It is a network system.
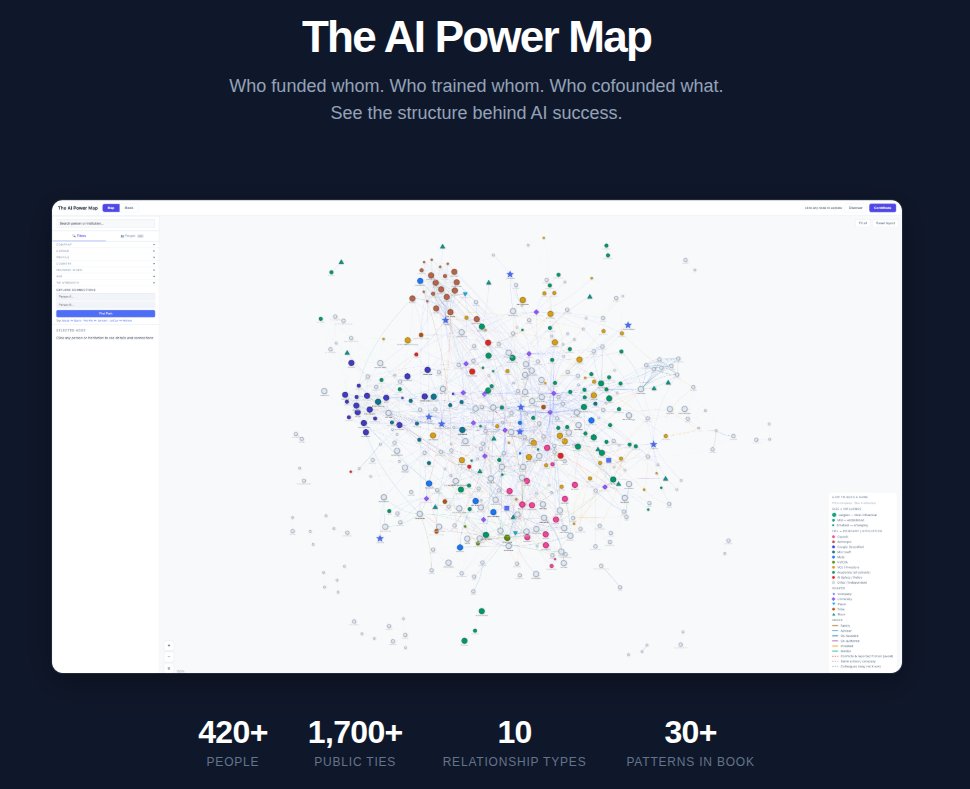
This is the core argument of The AI Power Map: a free 70,000-word companion book with an interactive graph of 420 people and 1,709 documented edges tracing how influence, trust, talent, and capital move across the AI industry.
The graph is the method. 8 methods of analysis were applied across the dataset, including betweenness centrality, community detection, motif analysis, and cofounder cluster identification.
The result is a map of recurring structural patterns: talent pipelines, diaspora arcs, acqui-hire chains, and the trust bridges that survive org chart changes.
Key findings from the network:
Stanford (77 nodes) and Google (#1 exporter) are the two dominant talent factories. School lineage, not company affiliation, is the stronger cohesion signal:
Sutskever, Gomez, and Karpathy share a Hinton-Toronto lineage across 5 different employers, visible in the graph edges, not inferred.
Network position is the strongest visible predictor of tier. T1 individuals average significantly more documented connections than lower-tier members.
8 canonical power transfer motifs repeat across the network: the walkout-to-lab pattern (OpenAI → Anthropic), the acqui-hire-as-talent-capture pattern (Google → DNNresearch), the reputation-round pattern (SSI: $32B, no product, no revenue).
Sam Altman holds the highest betweenness centrality in the dataset (0.145), connecting more disconnected subgraphs than anyone else. One node. 38 direct ties. YC, OpenAI, and Microsoft capital bridged through a single person.
The November 2023 board crisis resolved not through formal governance but through social capital: a staff letter, a private conversation, and external leverage. The network held the institution together, not the org chart.
The Transformer Eight paper is a single source node that produced a generation of careers and at least 3 frontier labs. One co-authored paper, eight trajectories, and an entire subgraph of the modern AI industry.
This is applied network science on one of the most consequential domains of our time. The interactive map lets you explore paths between nodes, filter by community, tie strength, and institution, and trace influence across the full connected graph.
By Yumi Kimura
map.behaviorgraph.com/?view=…
#NetworkScience #GraphAnalytics #GenAI #SocialNetworkAnalysis #AIIndustry
--
🤝 Put your graph tech brand in front of the people who matter
Your graph technology deserves to be seen by buyers, analysts, and builders who are actively shaping the space.
The Year of the Graph is the independent hub that this community trusts.
Slots for the upcoming Summer 2026 Issue are filling fast. Reach out and book yours now 👇
yearofthegraph.xyz/contact/
2
9
412

Jun 2
By integrating #GraphDatabases into AI architectures—specifically through #GraphRAG—we can ground #AI outputs in verifiable, connected knowledge.🤖 It's time to move beyond tables and embrace the graph.💡 na2.hubs.ly/H05M-J90
#NebulaGraph #KnowledgeGraph #GraphAnalytics #LLM
74
941

May 21
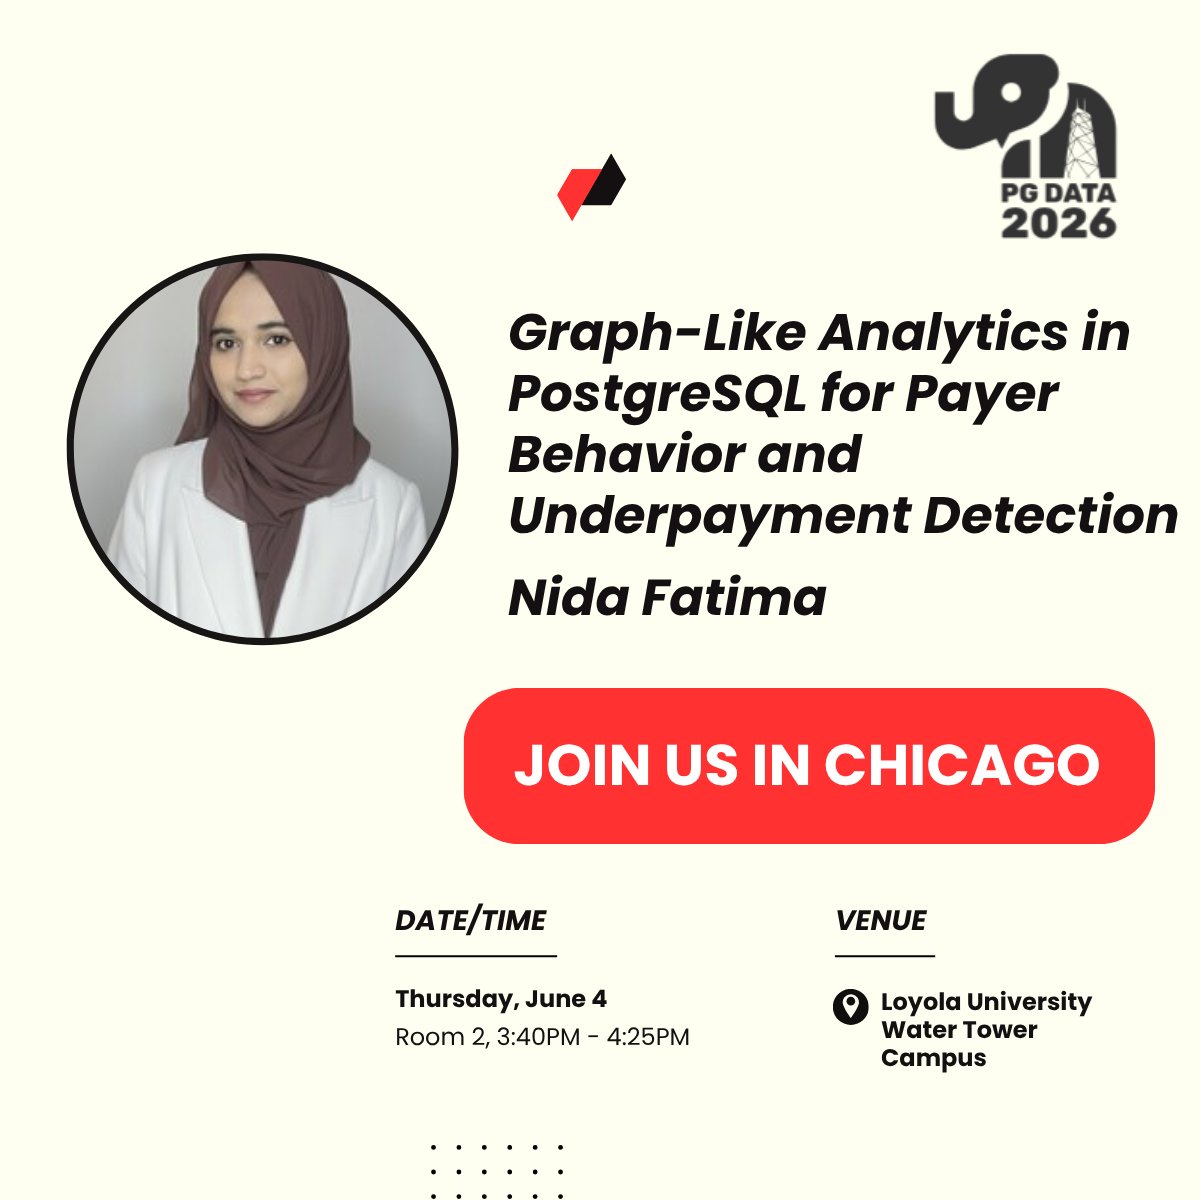
Uncover graph-like analytics in PostgreSQL with Nida Fatima at PG DATA 2026 on June 4!
Join us: 2026.pg-data.org/
#PGData #PGData2026 #PostgreSQL #Postgres #HealthcareData #Analytics #SQL #DataEngineering #OpenSource #GraphAnalytics
1
1
19

May 20
Insurance fraud is no longer just a financial problem.
It is becoming an AI-scale adversarial systems problem.
Fraud networks are increasingly sophisticated:
Organized fraud rings
Staged accidents
Synthetic identities
Medical billing manipulation
Coordinated legal exploitation
Cross-policy abuse
Multi-claim orchestration
Traditional rule-based detection systems struggle to keep pace.
At Xpert Systems Inc., we are building:
INS-007 — Synthetic Fraud Claims Dataset
A synthetic insurance fraud intelligence platform designed for:
Insurance carriers
Special Investigation Units (SIUs)
Fraud analytics teams
Government investigators
AI labs
Claims automation vendors
Risk intelligence firms
Law enforcement analytics groups
The dataset includes:
Fraudulent claims scenarios
Staged accident simulations
False injury claims
Inflated repair estimates
Medical provider fraud patterns
Social network fraud rings
Identity linkage graphs
Cross-policy claim relationships
Adjuster investigation notes
Litigation escalation patterns
Financial transaction anomalies
Organized fraud coordination indicators
Subrogation inconsistencies
Investigative outcomes and case resolutions
Potential AI/ML applications:
Fraud detection models
Graph-based fraud analytics
Claims anomaly detection
Social network risk scoring
SIU prioritization systems
Automated claims triage
Litigation risk analysis
Entity resolution intelligence
Behavioral fraud pattern detection
Adversarial insurance AI training
One of the most important advantages of synthetic fraud generation is the ability to simulate:
Rare fraud schemes
Large coordinated fraud networks
Emerging attack patterns
Cross-jurisdiction fraud operations
Adversarial adaptive behaviors
Long-duration fraud campaigns
Multi-party collusion
AI-generated synthetic identity abuse
Real-world fraud datasets are often incomplete because many fraud cases are never confirmed or fully investigated.
Synthetic simulation environments allow insurers and AI systems to train against fraud patterns that may not yet exist at scale — but are entirely plausible.
The future of insurance fraud defense may depend on:
Synthetic Adversarial Scenarios → Feature Engineering → AI Detection Models → Decision Intelligence → Autonomous Fraud Prevention Systems
This is where synthetic operational intelligence becomes strategically important.
Institutional and enterprise collaboration discussions welcome.
Xpert Systems Inc.
xpertsystems.ai/synthetic-da…
#ArtificialIntelligence #InsuranceAI #FraudDetection #SyntheticData #InsurTech #MachineLearning #ClaimsAutomation #GraphAnalytics #CyberFraud #EnterpriseAI #RiskModeling #DataScience #AIInfrastructure #PredictiveAnalytics
8

May 15
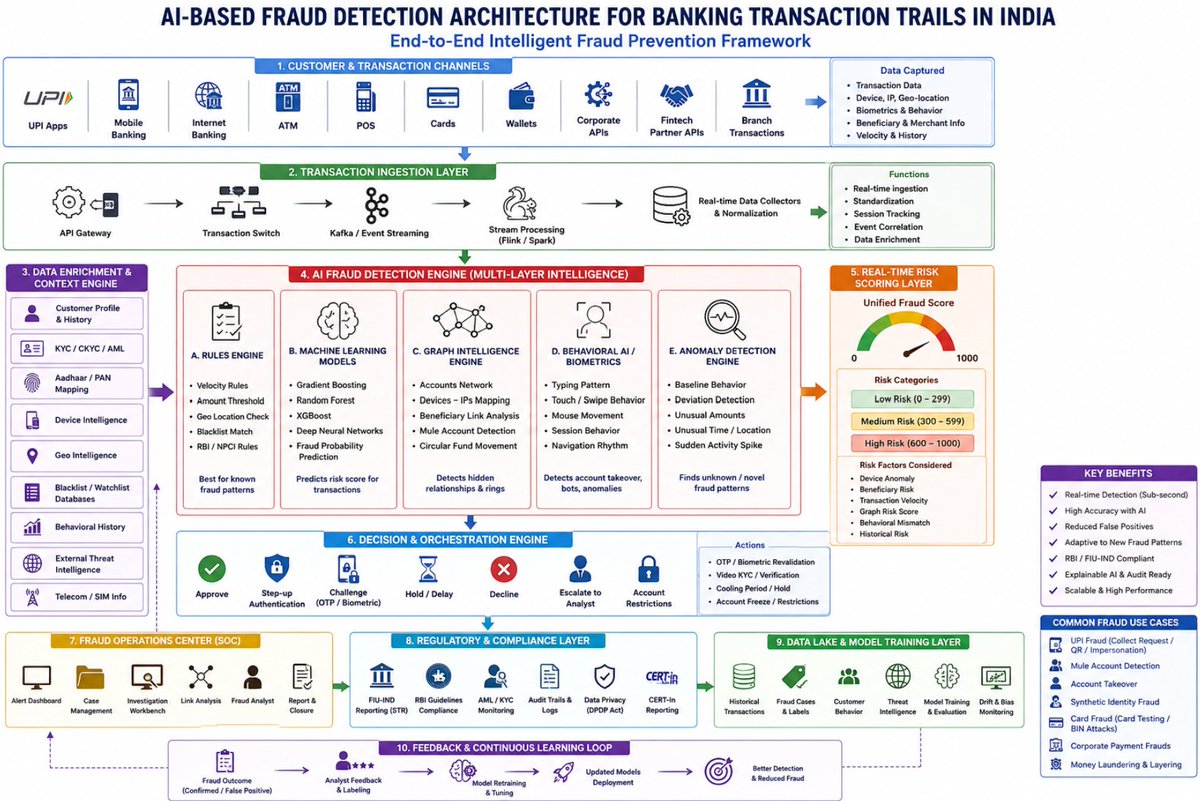
India’s banking fraud landscape is evolving faster than ever.
With billions of real-time transactions flowing through UPI, cards, wallets, and digital banking channels, traditional rule-based systems are no longer enough.
The future of fraud prevention will be powered by:
✅ AI Risk Engines
✅ Graph Intelligence
✅ Behavioral Biometrics
✅ Real-time Streaming Analytics
✅ Explainable Machine Learning
✅ Autonomous Decisioning
A modern AI fraud architecture for Indian banking combines:
Customer Channels
→ Real-time Event Streaming
→ AI Fraud Detection
→ Risk Scoring
→ Decision Engine
→ Fraud Ops / SOC
→ RBI & FIU Compliance
→ Continuous Learning Loop
The biggest shift?
Fraud detection is moving from:
“reactive monitoring”
to
“predictive autonomous intelligence.”
Banks that build AI-native fraud infrastructure today will define the next decade of digital finance in India.
#AI #FraudDetection #Banking #UPI #Fintech #CyberSecurity #MachineLearning #DigitalBanking #IndiaFintech #ArtificialIntelligence #RiskManagement #GraphAnalytics #AML #RBI #FinancialServices #DataScience #BehavioralAI #FintechIndia
36
May 14
NebulaGraph v5.2 is here! 🚀
100x faster path queries Native Hybrid Search (Graph Vector Text) = The ultimate AI-native engine. 🤖
👉 Start computing intelligence: na2.hubs.ly/H05p6Zm0
#GraphDatabase #NebulaGraph #AI #LLM #GraphAnalytics #KnowledgeGraph #GraphRAG
1
75
91
May 11
As businesses move from simply “storing connections” to “deriving intelligence from connections,” the need for a powerful, flexible, and scalable #GraphAnalytics solution becomes critical. 🤔 This is where NebulaGraph Analytics comes in: na2.hubs.ly/H05mm9H0
#NebulaGraph #AI
123
78

May 8
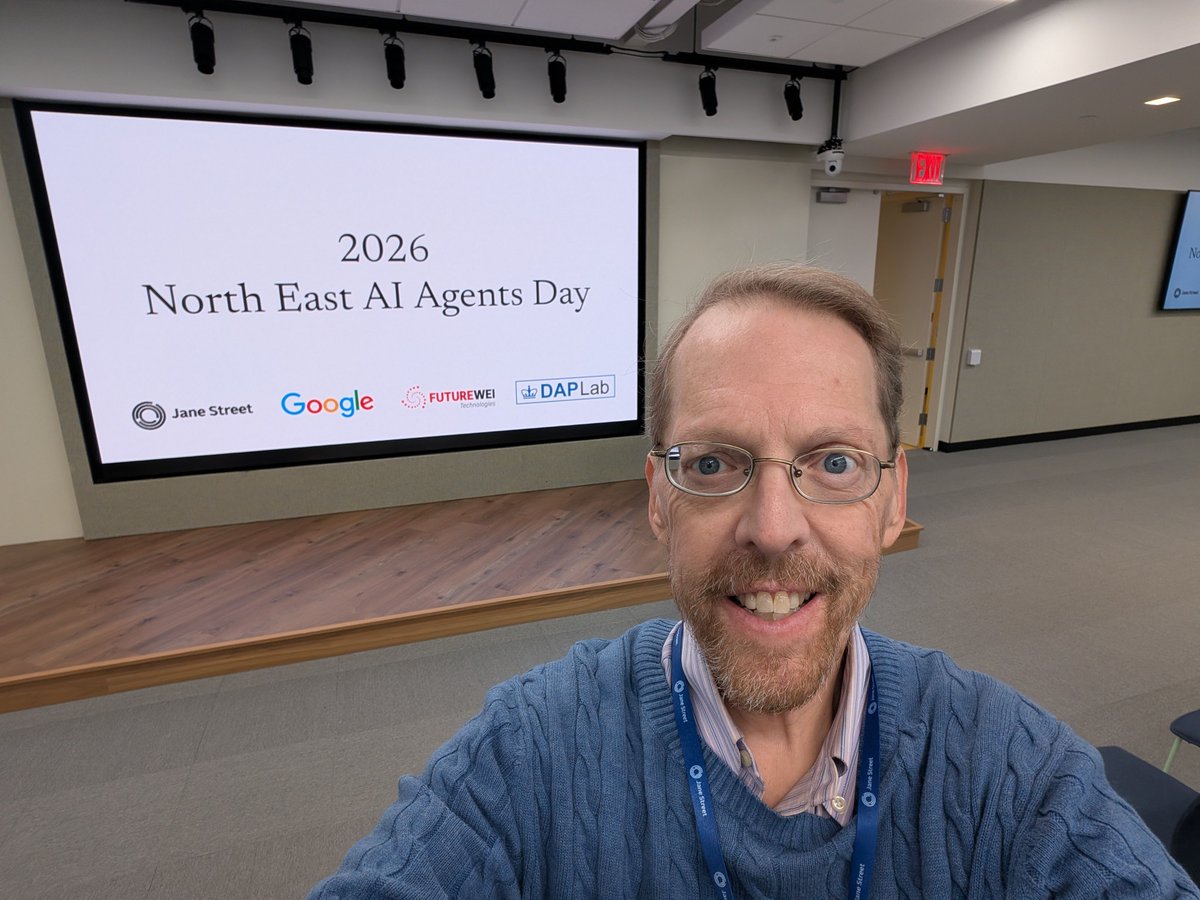
Great day at North East AI Agents Day at @JaneStreet NYC. Honored to give a talk on "Agentic Exploration of Large-Scale Graphs with Arkouda and Arachne." Thanks to the organizers for convening such a sharp crowd. #AIAgents #HPC #GraphAnalytics #LLM
ne-agents-day.github.io/
1
2
125
May 7
#GraphComputing ≠ graph databases: The former is the analysis layer, the latter is the storage layer. 🤖 Graph computing doesn’t replace your stack—it supercharges it with relationship-aware insights.💡
🔗 na2.hubs.ly/H05jksH0
#GraphDatabase #NebulaGraph #GraphAnalytics
61
59

May 5
Changing your graph schema shouldn’t mean 𝗿𝗲𝗹𝗼𝗮𝗱𝗶𝗻𝗴 all your data.
But with the traditional graph pipeline, that’s often the tradeoff:
📦 Move data into a graph database
🧩 Define the schema up front
🔁 Reload when the model changes
That slows teams down before they even get to the fun part: querying relationships.
With PuppyGraph, the data stays in tables while the graph schema sits logically on top.
Physically, tables.
Logically, a graph. 😎
Check out the clip below to see how this makes graph adoption much easier. 👇
#GraphAnalytics #GraphDatabase #DataEngineering #DataArchitecture #ZeroETL
1
68
Apr 30
#SubgraphComputing is a specialized form of graph computing that focuses on analyzing specific, smaller sections (subgraphs) within a larger graph, rather than processing the entire dataset. 🔍
🔗 Read more:
na2.hubs.ly/H056kqR0
#GraphDatabase #NebulaGraph #GraphAnalytics
53
Apr 28
AI is changing cybersecurity on both sides: 𝘩𝘰𝘸 𝘢𝘵𝘵𝘢𝘤𝘬𝘴 𝘩𝘢𝘱𝘱𝘦𝘯, 𝘢𝘯𝘥 𝘩𝘰𝘸 𝘵𝘦𝘢𝘮𝘴 𝘳𝘦𝘴𝘱𝘰𝘯𝘥.
As models become more capable, they’re powering more sophisticated attacks while also enabling stronger defenses. This puts more pressure on the data layer to keep security context fresh, connected, and ready for real-time detection.
That’s what Weimo Liu @wmliu (@puppyquery ) and Yingjun Wu @YingjunWu (@RisingWaveLabs) will explore in our live webinar on cybersecurity graph analytics on streaming data.
📅 May 7 | ⏰ 9:00–10:00 AM
This session looks at how to keep up:
🐾 Real-time data processing with RisingWave
🐾 Subsecond graph queries on fresh data with PuppyGraph
🐾 Faster detection with multi-hop reasoning across live relationships
🐾 An agent-friendly setup with ontology-enforced graph querying
We’ll use a cybersecurity demo to show how streaming data and graph queries can work together for faster investigation.
👉 Save your spot: luma.com/kv0l3y2t?utm_source…
#Cybersecurity #GraphAnalytics #StreamingData #AIInfrastructure #DataEngineering
1
63
Apr 23
#NebulaGraph Analytics empowers your teams to move beyond pre-packaged solutions and build algorithms that perfectly mirror your unique business logic. 🚀
Come to Try a Platform for the Era of Billion-Relation Analytics:
na2.hubs.ly/H04Z1BN0
#GraphAnalytics #GraphAlgorithms
851
Apr 17
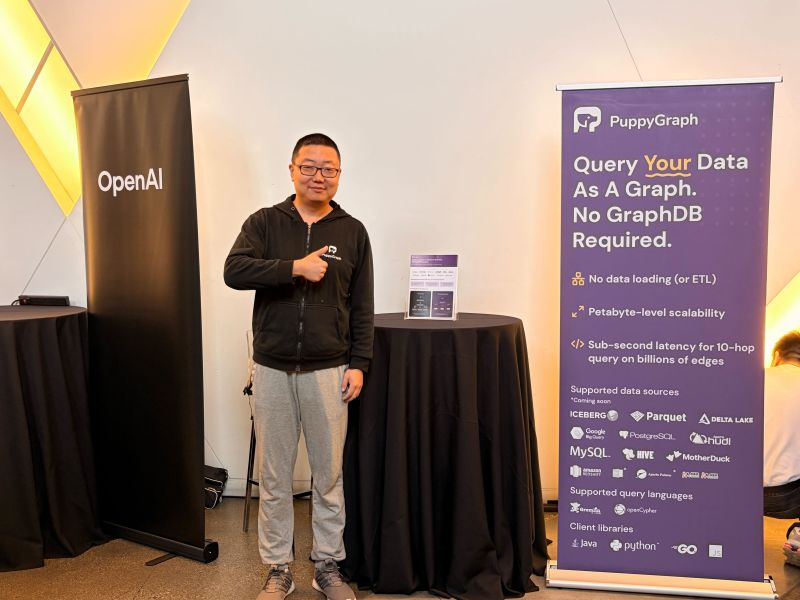
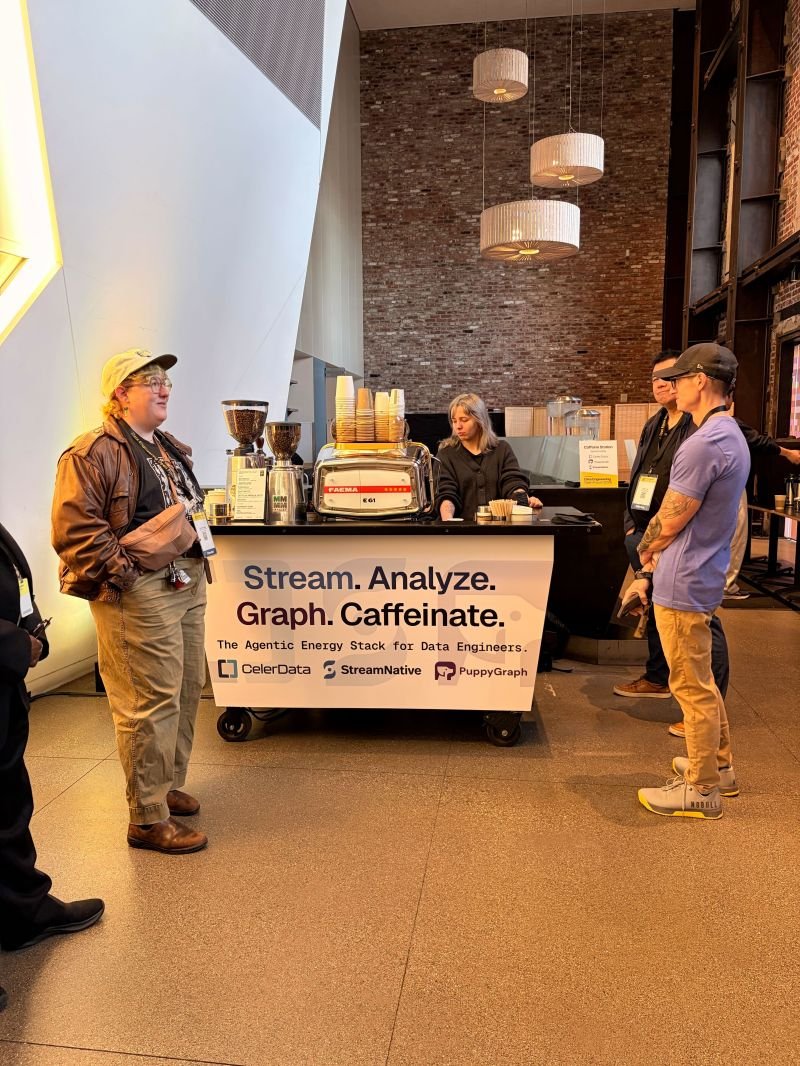
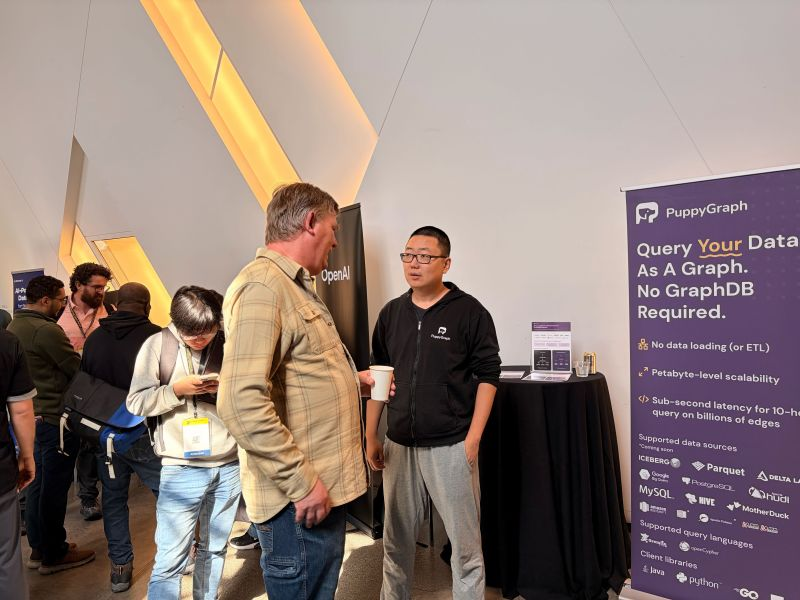
What a fun time at #DEOF2026 🐶
We had a blast meeting so many thoughtful data engineers and hearing how teams are architecting frontier solutions across AI, analytics, and modern data infrastructure. So many great conversations, big ideas, and inspiring builds packed into one event.
Safe to say the coffee cart was a hit… engineers need their caffeine ☕️
Huge shoutout to Xinran Waibel and @dataengthings for putting together such an awesome gathering. We’re so glad we got to be part of it.
#DEOF2026 #DataEngineering #GraphAnalytics #AIInfrastructure #DataArchitecture
3
53
Apr 10
By leveraging #NebulaGraph, Envision has constructed a "Whole Grid Graph," transforming disparate devices, data, and business logic into a unified, intelligible network that can be analyzed in real time. 🚀
🔗 na2.hubs.ly/H04LV9h0
#GraphDatabase #NebulaGraph #GraphAnalytics
1
912
Apr 9
#NebulaGraph Analytics lets you:
✅ Write custom graph algos in #GQL
✅ Generate code from natural language (#AI-assisted)
✅ Analyze data in-place (S3, HDFS, etc.)
✅ Get 5-10x speedup & 80% less resource use
🔗 na2.hubs.ly/H04KyV60
#GraphAnalytics #GraphAlgorithms
905

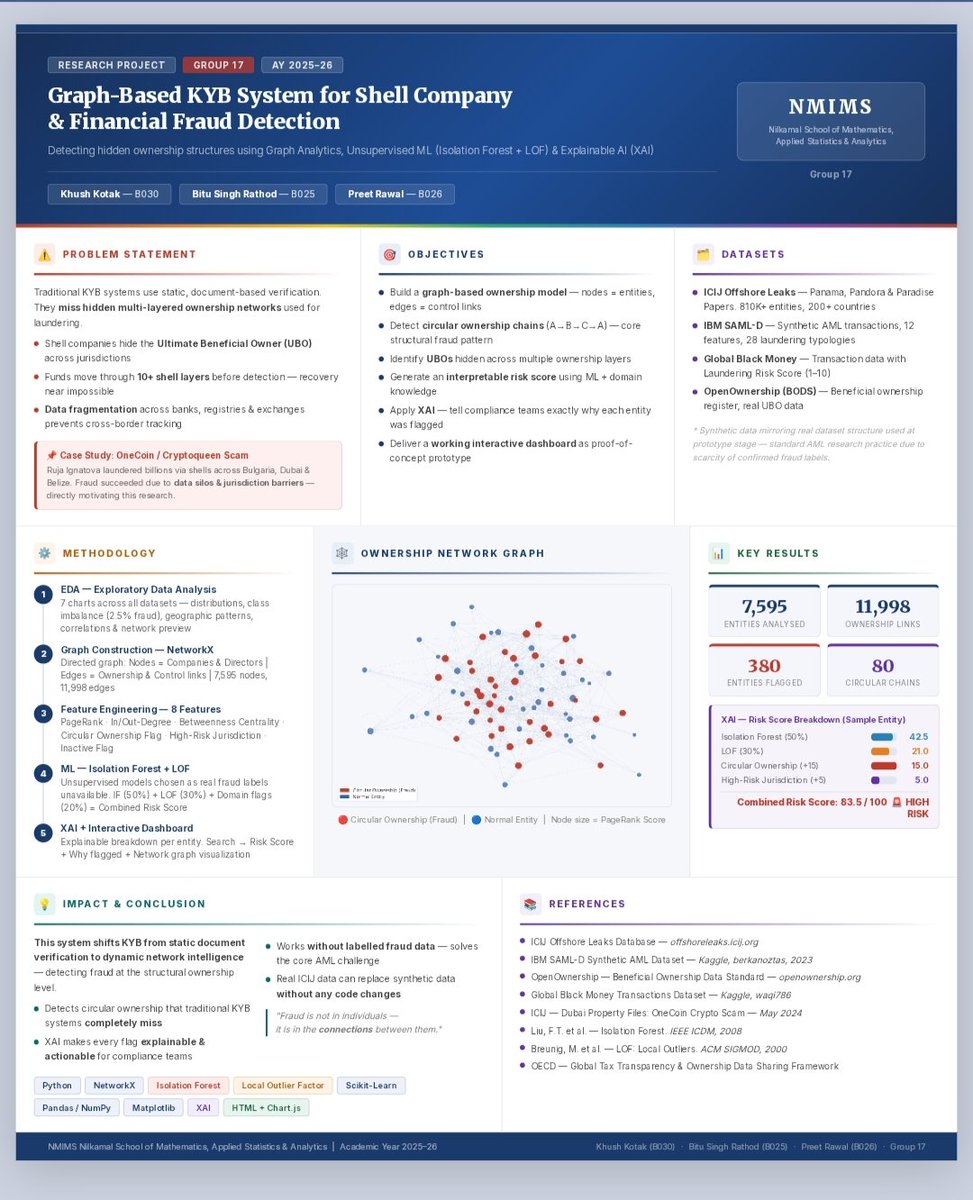
This is my #researchproject
Built a Graph-Based KYB System for detecting shell companies & financial fraud.
Used #GraphAnalytics ML (Isolation Forest, LOF) Explainable AI
to detect hidden ownership networks.
Key insight: Fraud hides in connections, not individuals.

57

Apr 5
If your model is 70% accurate per step across a 10-step investigation, your actual success rate isn’t 70%.
It’s ~2.8%.
Even pushing to 90–95% per step doesn’t fix it:
→ 90% per step = ~35% overall
→ 95% per step = ~60% overall
That’s still not reliable enough for real-world security investigations.
This is the gap between demo-grade AI and production-grade systems.
Accuracy compounds.
So does failure.
Sign up for early access and receive updates with full videos → louie.ai/
Our upcoming AI agents for security training → louie.ai/trainings
#ai #cybersecurity #aiagents #securityoperationscenter #threatdetection #graphanalytics
3
167
Apr 3
For teams building AI-driven investigations, speed isn’t a luxury, it's the difference between reactive and real-time.
Leo Meyerovich founder at Graphistry shares what we’re seeing with the new GFQL Cypher :
→ ~4s on 2M edges (vs 22s on Neo4j)
→ ~7s on 30M edges (where others time out)
→ Up to ~50× faster performance
→ 1–2B edges/sec on a single GPU
Click the link below to sign up for early access and receive updates with full videos → louie.ai/
Check out our upcoming AI agents for security training → louie.ai/trainings/ai-agent-…
#AI #Cybersecurity #MachineLearning #DataScience #GraphAnalytics #BigData
181
Apr 2
What inspired our zero-ETL architecture?
We kept coming back to a pretty simple problem:
Graph queries are great for complex, multi-hop questions 📈
Moving all your data first? Not so much 🛑
A lot of graph headaches start before you even get to the graph.
So we asked:
What would it look like to bring the Google approach to graph?
#PuppyGraph #GraphQuery #DataArchitecture #ETL #GraphAnalytics
43