
Please rectify my #missingdata #invisabledisability as it's not professional & not @NHSEngland policy your meant to have strict rules @aaroncumminsNHS @LSCICB @DHSCgovuk @healthdpt @HouseofCommons @HoCcommitteesUK #patientexperience #patientsafety #PatientCare #Towardsinclusion


1
392
#missingdata #invisabledisability could your new CEO of @UHMBT Please look into this matter @CQCProf as @aaroncumminsNHS your new CEO @LSCICB was asked to scan this vital information back into the system as it could effect a diagnosis & negative outcome


I attended @UHMBT A e 6-6-26 with high blood pressure & was treated in a professional manner & the staff were thorgher as they didn't want me to have a stroke & I mentioned the last time I had symptoms like this ,a pain in the back of my head was 2004 but this was not on system ?

1
25

May 27
Almost every survey has missing data… but the real question is WHY the data is missing.
In statistics, we usually distinguish between 3 missing data mechanisms:
MCAR: missingness is completely random.
Example: A response is missing because of a technical error.
MAR: missingness depends on other observed variables.
Example: Younger participants skip an income question more often.
MNAR: missingness depends on the unobserved value itself.
Example: People with very high income are less likely to report their income value.
I’ve just released a new module on missing data mechanisms in the Statistics Globe Hub: statisticsglobe.com/hub
#statistics #datascience #rstats #missingdata #statisticsglobehub
6
23
1,262
May 25
Almost every survey suffers from missing values. This can lead to biased results, loss of information, and increased uncertainty in your analysis.
But the number of missing values is not the only factor that matters. What is often even more important is the mechanism behind the missingness.
In statistics, we usually distinguish between three major missing data mechanisms:
🔹 MCAR (Missing Completely at Random): The probability of missingness is completely unrelated to the data itself. Example: A survey response is missing because of a random technical error.
🔹 MAR (Missing At Random): The probability of missingness depends on other observed variables, but not on the missing values themselves. Example: Younger participants are less likely to answer an income question.
🔹 MNAR (Missing Not At Random): The probability of missingness depends on the missing value itself. Example: People with very high income are less likely to report their income.
In a recent Statistics Globe Hub module, you will explore the differences between MCAR, MAR, and MNAR in R and learn why these missing data mechanisms are so important for statistical modeling and inference.
The Statistics Globe Hub is an ongoing learning program covering statistics, data science, AI, and programming with R and Python. New hands-on modules are published every Monday.
More info: statisticsglobe.com/hub
#rstats #datascience #statistics #missingdata #imputation #surveyresearch #statisticsglobehub
10
51
1,652
Imputar por defecto con 0, media o mediana es una mala práctica porque reduce artificialmente la varianza, cambia distribuciones y empuja correlaciones hacia cero.
#stats #Estadística #AnálisisDeDatos #DataScience #MissingData #Imputación #MachineLearning #cienciadedatos

1
2
11
769
Apr 16
Monte Carlo simulations are a great tool to compare different methods.
In this example, I’m comparing three different missing data handling techniques.
Predictive Mean Matching clearly wins.
I just released a new module on Monte Carlo simulation in the Statistics Globe Hub: statisticsglobe.com/hub
#datascience #statistics #probability #math #missingdata #statisticsglobehub
4
31
1,537

Mar 28
Missing Data Could Themselves Be Used as Predictors of Stroke Outcomes - Lucie Tvrdá
hemostasistoday.com/science/…
#CerebrovascularDiseases #Health #Hematology #Hemostasis #HemostasisNews #HemostasisToday #MachineLearning #Medicine #MissingData #ML #NonclinicalFactors #Stroke #Thrombosis #MedEd #MedX

1
2
19

#statstab #510 A Note on Dropping Experimental Subjects who Fail a Manipulation Check
Thoughts: Another paper to consider when "removing participants who failed our manipulation check"🤷♂️
#manipulationcheck #estimand #experiment #bias #guide #missingdata
doi.org/10.1017/pan.2019.5
1
2
343

Feb 20
Newly published #ImputationStudy demonstrates that #MissingData can often bias pooled estimates in #SystematicReviews (#SR) of #PatientReportedOutcomes(#PROs)
pubmed.ncbi.nlm.nih.gov/4146…
1
6
22
2,147

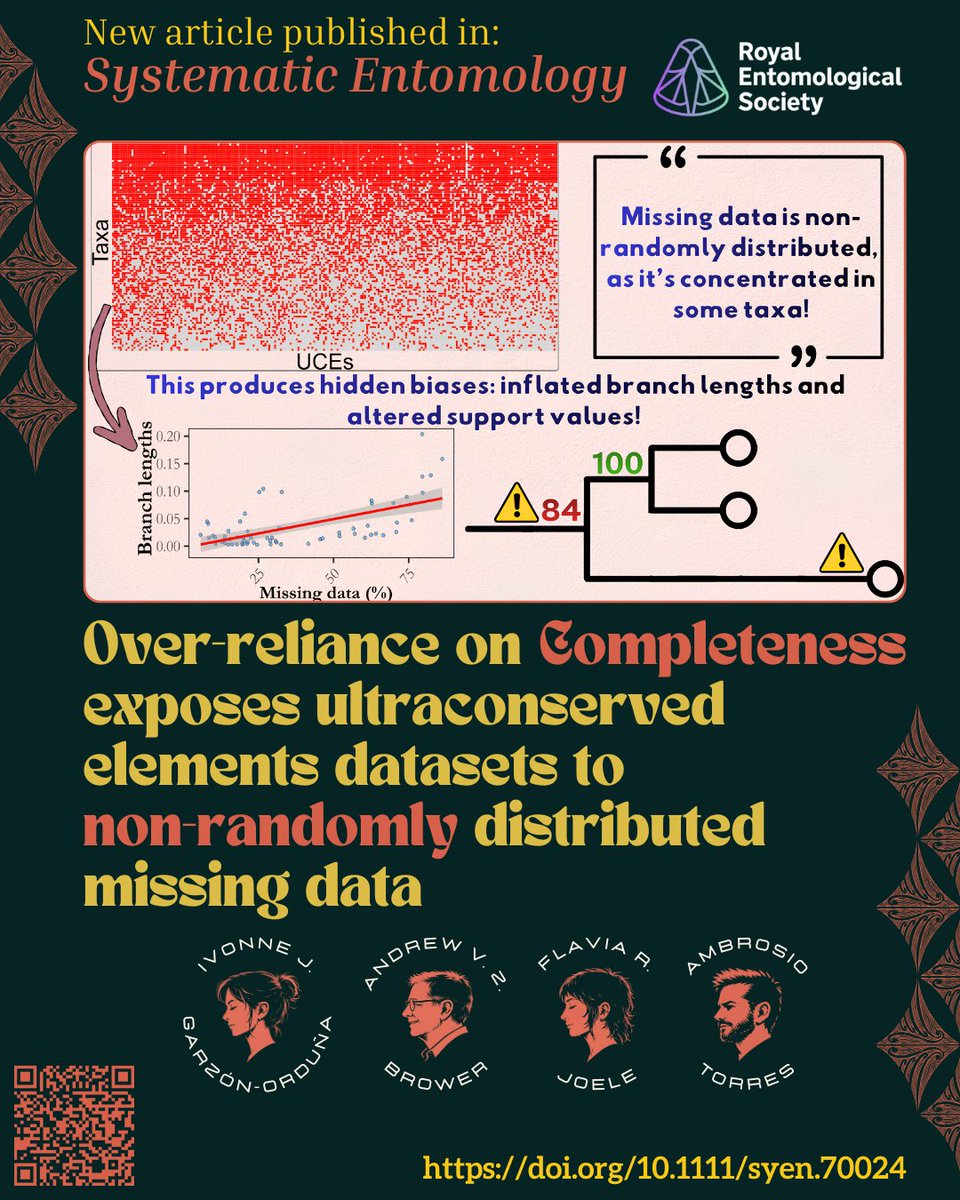
⚠️#NewArticle in @Systematic_Ent
Over-reliance on Completeness exposes ultraconserved elements datasets to non-randomly distributed missing data
By Garzón-Orduña et al.
Open Access: doi.org/10.1111/syen.70024
#Phylogenomics #MissingData #Completeness #UCEs #UltraConservedElements
1
4
115
Jan 30
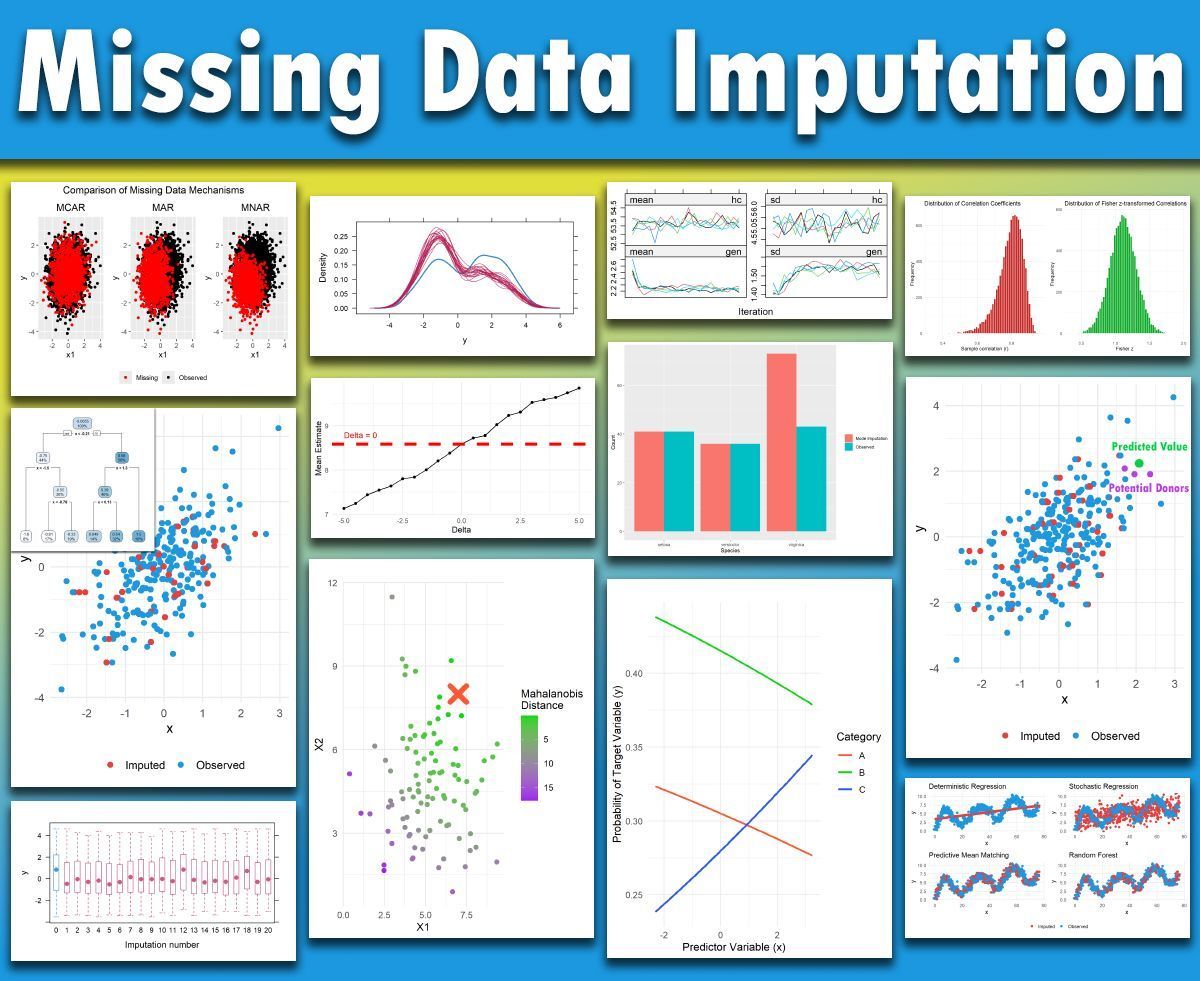
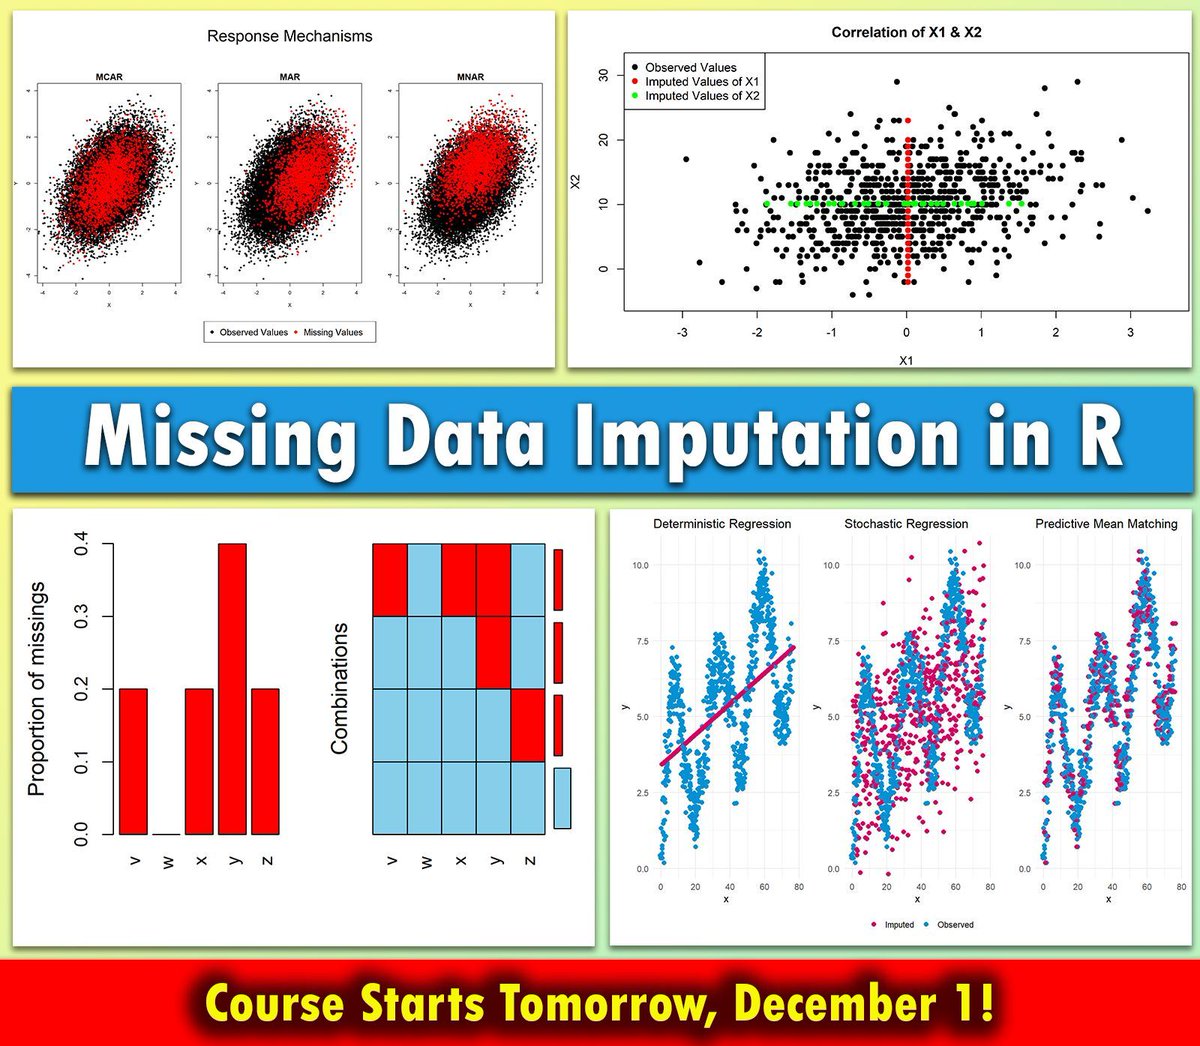
My Missing Data Imputation in R course finished earlier this week, and it was a great experience. Thanks to all participants!
To keep the course available for new learners, I have now converted it into a fully self-paced course, with full access to all materials and recordings, and the option to ask questions at any time in the comment section.
In addition to the core content, I added several bonus modules based on participant requests and course discussions. These bonus modules are now included in the course.
Below are some of the images and topics we discussed in the course.
Interested in learning more?
Check out the course: statisticsglobe.com/online-c…
Talk to you soon.
Joachim
#missingdata #statistics #datascience #rstats
12
67
2,127
Jan 23
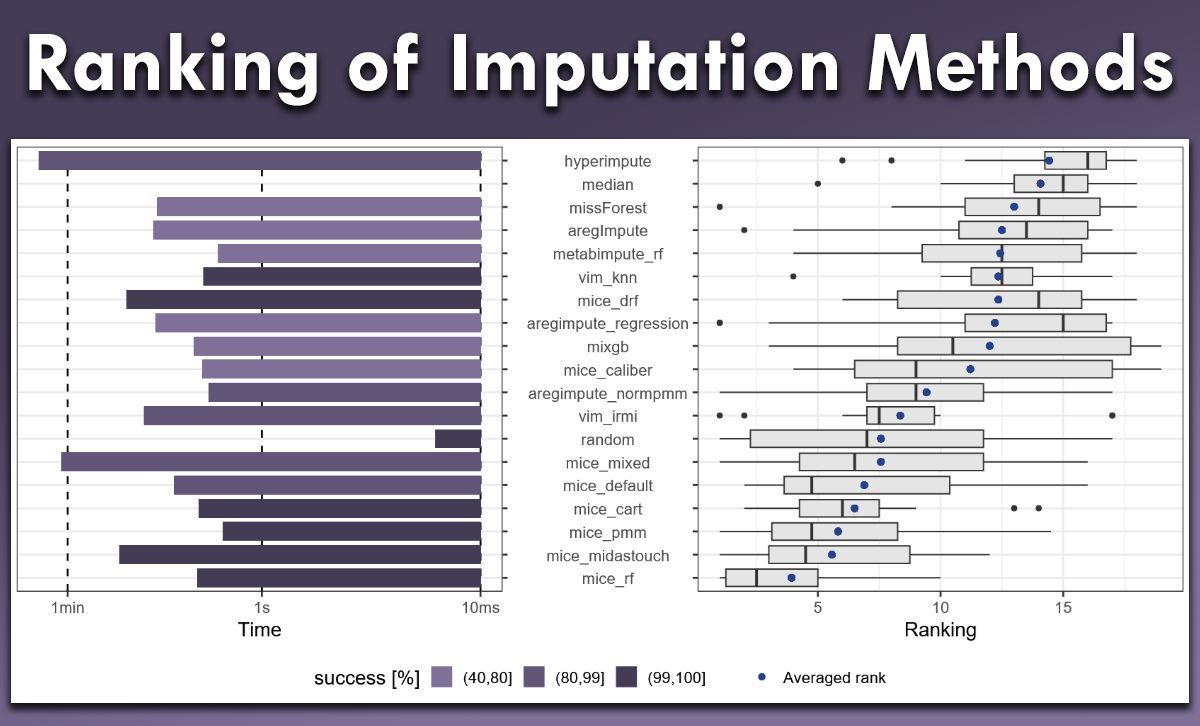
When you compare different imputation methods for missing data, the next question is always the same: How do you decide which one performs best?
A very practical answer is the Energy-I-Score. It’s a single metric that helps you benchmark imputation quality based on energy distances, making it easier to compare and rank different approaches in a consistent way.
The image below comes from a recent paper by Grzesiak et al. (2025). For more details and additional results across different data settings, see: arxiv.org/pdf/2511.04833 Special thanks to Jeffrey Näf for introducing me to the paper and the Energy-I-Score.
I’ve just released a new bonus module on the Energy-I-Score as part of my Missing Data Imputation in R course. In the module, I explain the idea behind the score and show how to compute it in R, including a reproducible example that compares several imputation methods side by side.
If you’d like to dive deeper, you can still join the course and get lifetime access to all materials: statisticsglobe.com/online-c…
Talk to you soon.
Joachim
#rstats #statistics #missingdata #datascience
20
107
3,336

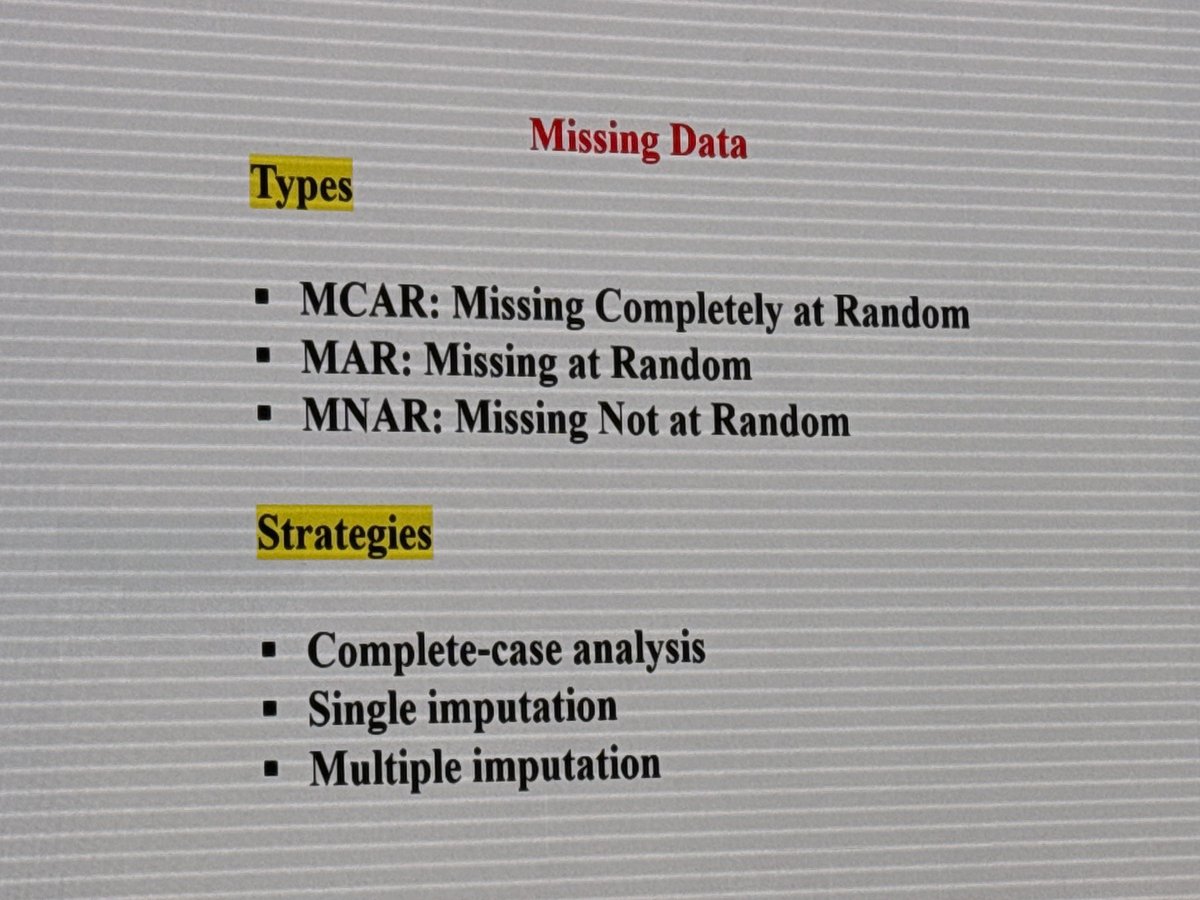
🕳️ Missing Data —📊🧠
🔖 Types
🎯 MCAR – Missing Completely At Random
• Missingness unrelated to data → least biased
🔁 MAR – Missing At Random
• Depends on observed data (e.g., age, sex)
⚠️ MNAR – Missing Not At Random
• Depends on unobserved value itself → most dangerous 🚨
🛠️ Strategies
📄 Complete-case analysis
• Simple, but ↓ power & ↑ bias if not MCAR
🧮 Single imputation
• Mean/median → underestimates uncertainty ⚠️
🧠 Multiple imputation ⭐
• Preserves variability
• Preferred in clinical research
🎯 Rule of thumb
👉 Diagnose why data are missing before choosing the method
#MissingData #Biostatistics #ClinicalResearch #ResearchMethods #Reproducibility #MedTwitter #HemeTwitter #RND_Data
2
112
Jan 20
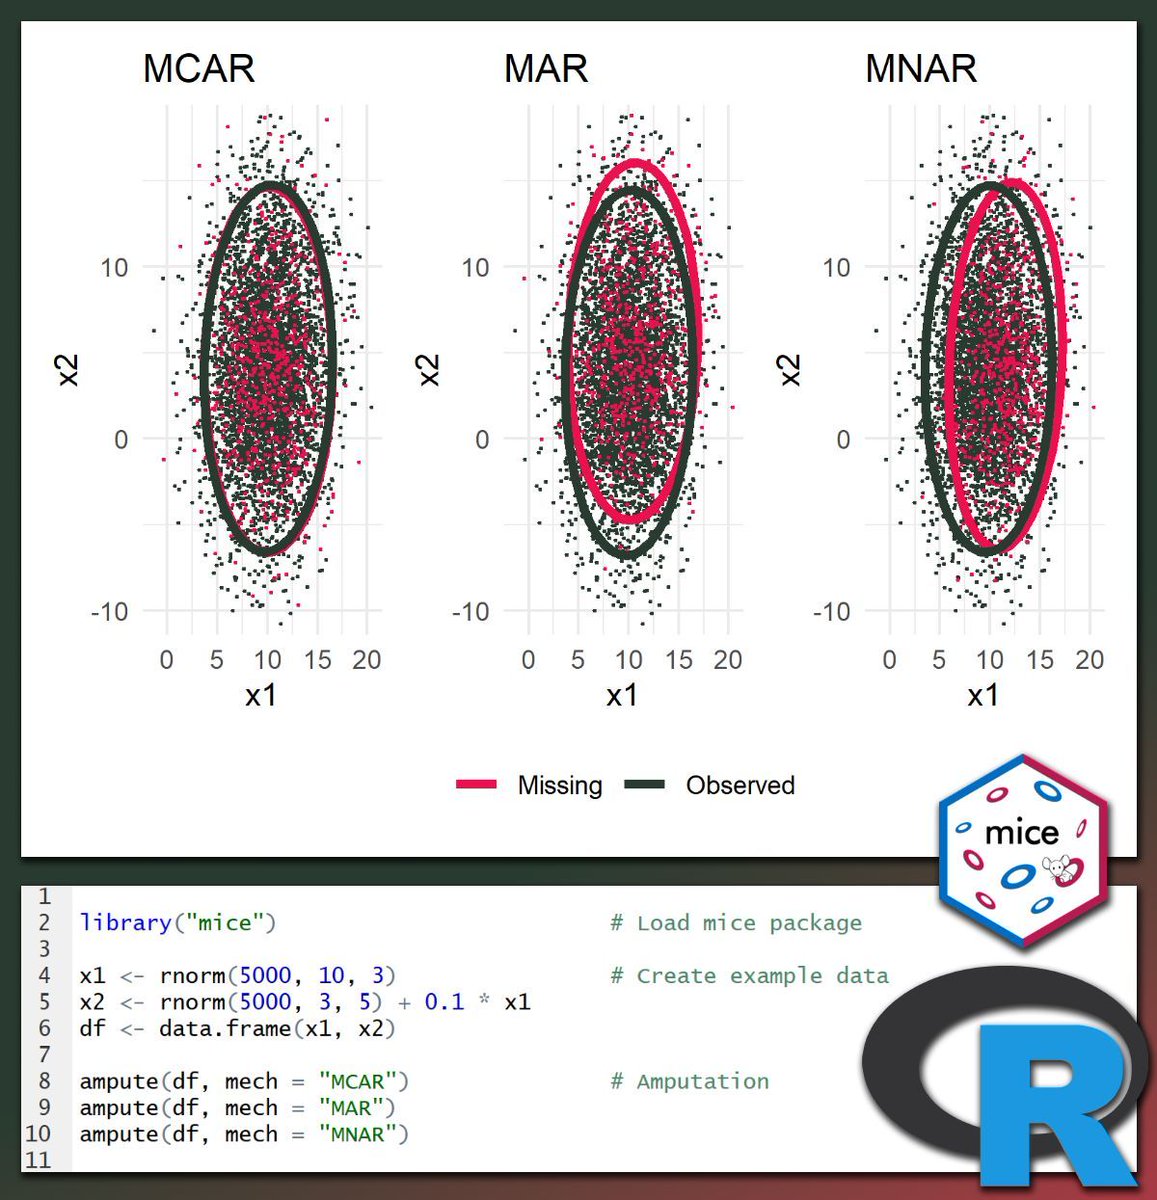
We usually want to avoid missing values in our data as much as possible, because they can reduce power, bias results, and make modeling harder.
But interestingly, inserting missing values on purpose can sometimes be very useful. For example, it allows you to compare imputation methods under controlled conditions, test how robust your results are when assumptions change, and create realistic practice datasets for tutorials and courses.
In R, a convenient way to do this is data amputation using mice::ampute(). The visualization below shows how the function can be used to insert different missingness mechanisms in the same dataset. Under MCAR, missingness is spread randomly across the data. Under MAR, the missingness in x1 shifts mainly along the x2 axis, meaning it is explained by an observed variable. Under MNAR, the shift happens mainly along the x1 axis, meaning the missingness depends on the missing variable itself. Note: The code shown below the graph is a simplified example and does not reproduce the exact same output.
Thanks to Rianne Schouten for introducing me to the ampute() function. Make sure to check out this article by Schouten et al. (2022), which explains the topic in more detail: rianneschouten.github.io/mic…
I’ve also added a new bonus module on data amputation to my Missing Data Imputation in R course. It introduces the core concept and walks through a reproducible R example.
If you’d like to explore the full course, you can still join and get lifetime access to all materials: statisticsglobe.com/online-c…
Talk to you soon.
Joachim
#rstats #datascience #statistics #missingdata
1
13
56
2,635
11 Dec 2025
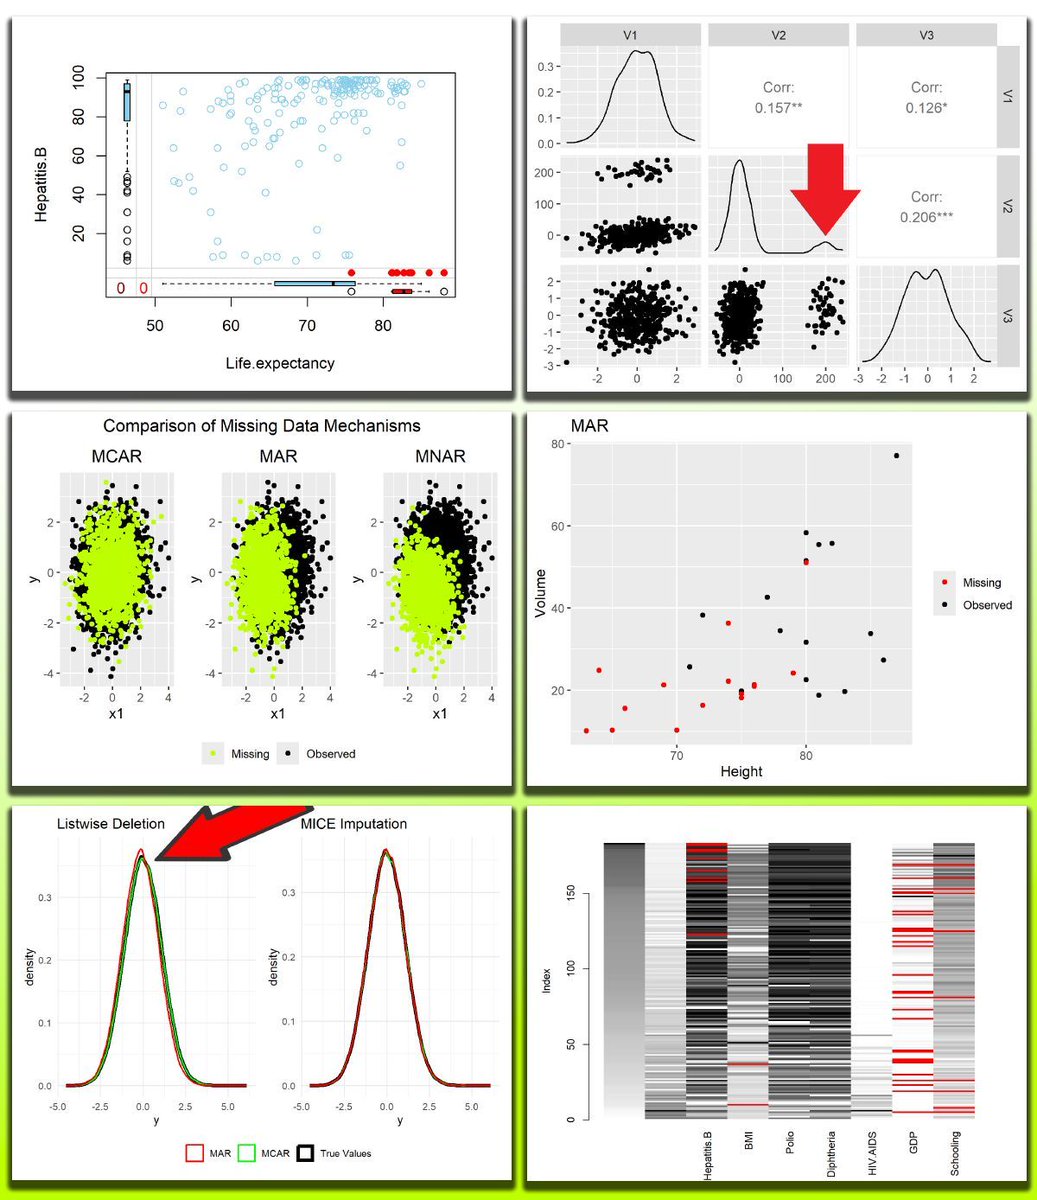
We are now in the second week of my course on Missing Data Imputation in R, and we have already covered several important topics.
Here is a selection of the most interesting points so far:
- MCAR vs MAR vs MNAR response mechanisms
- Little’s MCAR test and its assumptions
- Logistic regression for analyzing missingness
- Bias introduced by listwise deletion
- Simple imputation methods and their limitations
The visualization below shows a few of the topics we have already discussed in the course.
Next, we will move on to more advanced imputation methods that help preserve the true distribution of the data and maintain high data quality.
Interested in learning more about these topics? You can still join the course by enrolling here: statisticsglobe.com/online-c…
Talk to you soon.
Joachim
#missingdata #statistics #datascience #rstats
1
2
41
1,871
5 Dec 2025
Just-published survey #simulation studies: how should #RCTs with binary outcomes address #MissingData? Multiple imputation best, single imputation, complete case less well. Data missing not at random, typical situation, nothing works well. Missing data risks #bias, too bad.
pubmed.ncbi.nlm.nih.gov/4085…
1
4
25
1,955

2 Dec 2025
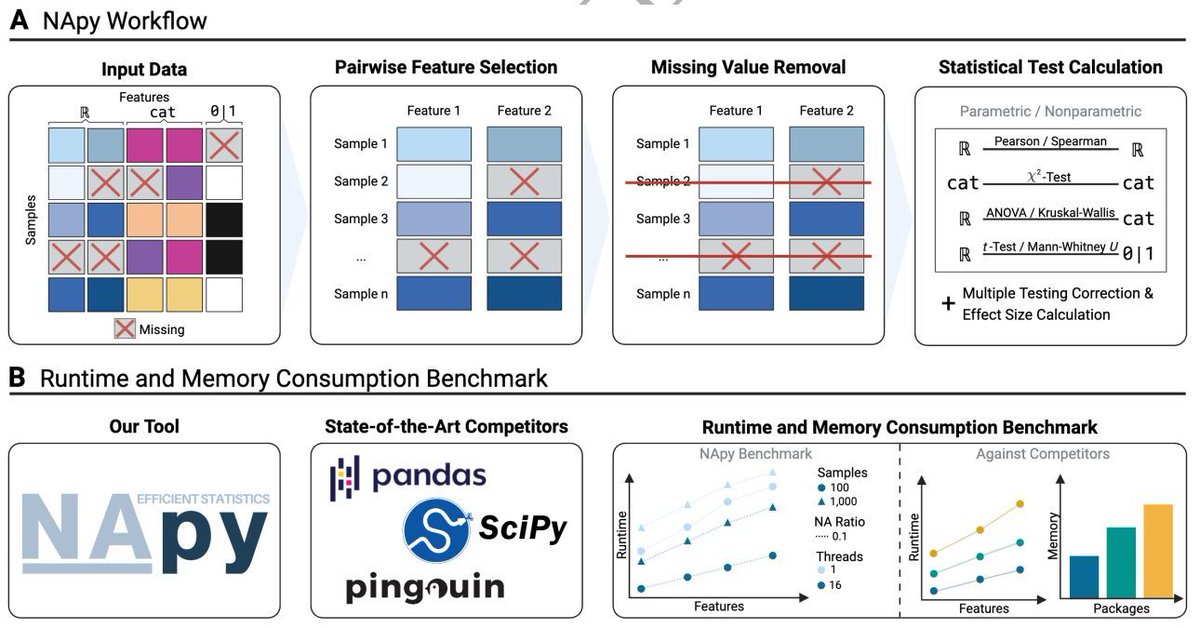
NApy: Efficient Statistics in Python for Large-Scale Heterogeneous Data with Enhanced Support for Missing Data. #Statistics #Python #MissingData #HeterogeneousData #Bioinformatics @GigaScience
academic.oup.com/gigascience…
4
24
1,731
30 Nov 2025
My online course, "Missing Data Imputation in R," starts tomorrow!
I’ve made two modules available for free as a preview if you’re still unsure about joining:
- Module 1) Course Structure & About the Instructor. Learn how the course is structured and what to expect from the sessions: statisticsglobe.com/online-c…
- Module 4) Simple Missing Data Imputation Techniques. Understand basic imputation methods and why they might even harm your data quality: statisticsglobe.com/online-c…
It would be great to have you in the course. So if you are interested, please register now: statisticsglobe.com/online-c…
Looking forward to seeing you there!
Joachim
#rstats #statistics #datascience #missingdata #imputation
4
38
2,177

28 Nov 2025
🙈Los datos que NO ves cuentan (a veces) más que los que ves 👻📊
¿Eres de los que ve un NaN y corre a eliminarlo o a rellenar con la media sin mirar atrás? ✋ Si es así... CUIDADO.👇🧵
#stats #DataScience #Analytics #Statistics #MachineLearning #MissingData #DataEngineering

2
22
102
4,260
27 Nov 2025
Handling missing values correctly is not as straightforward as it might seem. Many factors influence the quality of your analysis, and even small mistakes can introduce serious bias.
To help you navigate this, I structured my upcoming online course on Missing Data Imputation in R into 12 focused modules, each covering one key aspect of the missing data workflow.
Here’s the table of contents:
- Missing Data Basics: Sources of missing data, MCAR vs MAR vs MNAR, why imputation is needed, and key assumptions.
- Handling Missing Data in R: How to identify, visualize, and explore missingness patterns in R, plus basic handling strategies.
- Simple Missing Data Imputation Techniques: Mean, median, and mode imputation and why these approaches often lead to poor results.
- Advanced Imputation of Numerical Data: Regression imputation, predictive mean matching, and random forest imputation.
- Advanced Imputation of Categorical Data: Logistic and polynomial regression, random forest, and hot deck imputation.
- Variable Selection for Imputation Models: How to choose predictors for your imputation models and how to automate the process.
- Single vs Multiple Imputation: Why multiple imputation is usually the better approach and how to implement it effectively in R.
- Longitudinal & Clustered Data: How to handle missing data in repeated-measures and clustered structures.
- Evaluating Imputation Quality: Numerical and visual tools to assess imputation performance.
- Sensitivity Analysis: How to test the robustness of your results under different imputation assumptions.
If you want to improve your missing data workflow in R, my course starts on December 1: statisticsglobe.com/online-c…
It would be great to see you in the course.
Talk to you soon.
Joachim
#rstats #dataanalysis #datascience #statistics #missingdata

4
39
1,538