
Jun 16
link below to join the trading discord / dm me for 1 on 1 mentorship #explorepage #viral #daytrading #pullbacktrading #sremodel
whop.com/premium-community-5…
45
Jun 16
this is your sign to lock in on
day trading
#explorepage #viral #daytrading #pullbacktrading #sremodel
1
49
Jun 14
link below to join the trading discord / dm me for 1 on 1 mentorship #explorepage #viral #daytrading #pullbacktrading #sremodel
whop.com/premium-community-5…
47

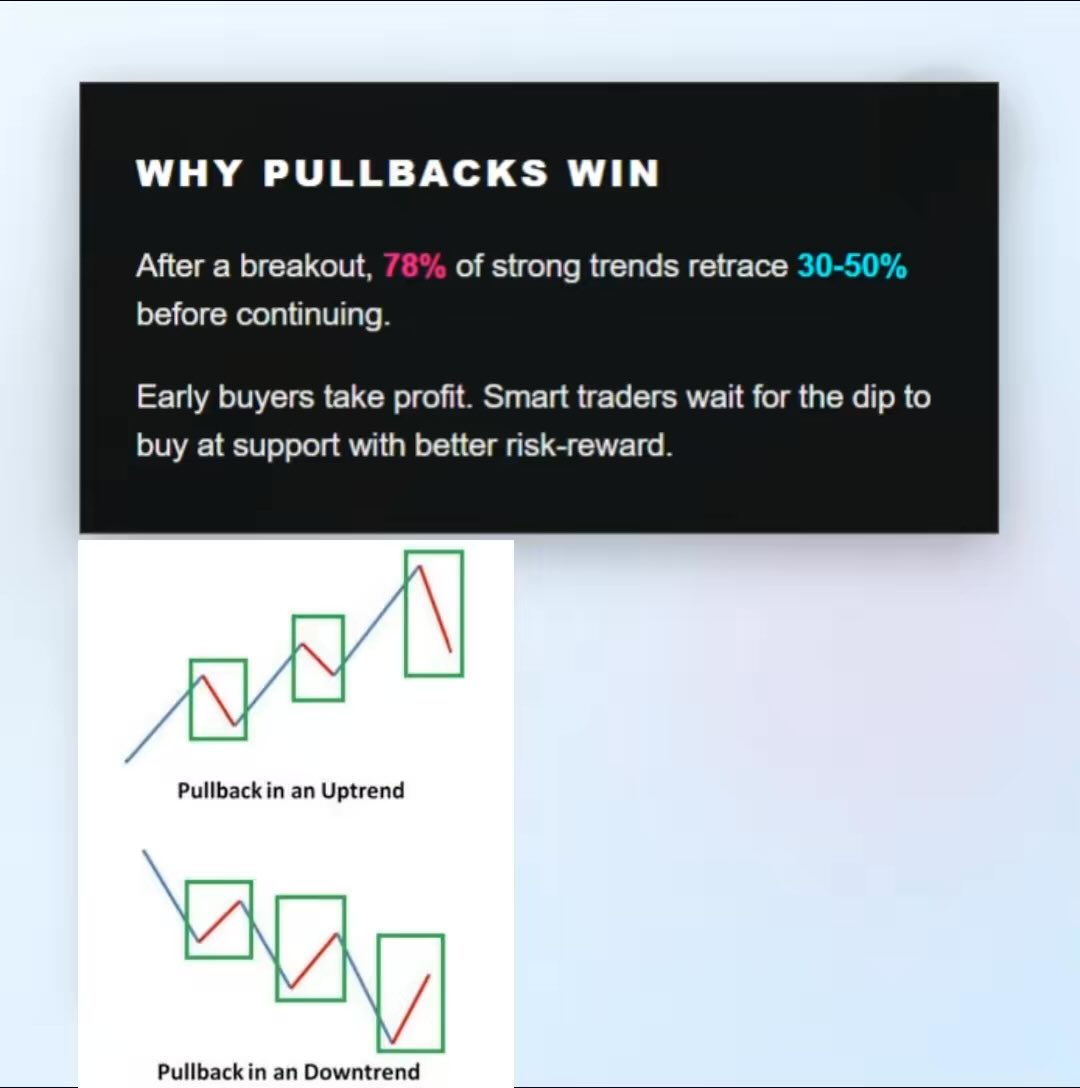
Most traders chase breakouts. Smart traders wait for the pullback. 📈
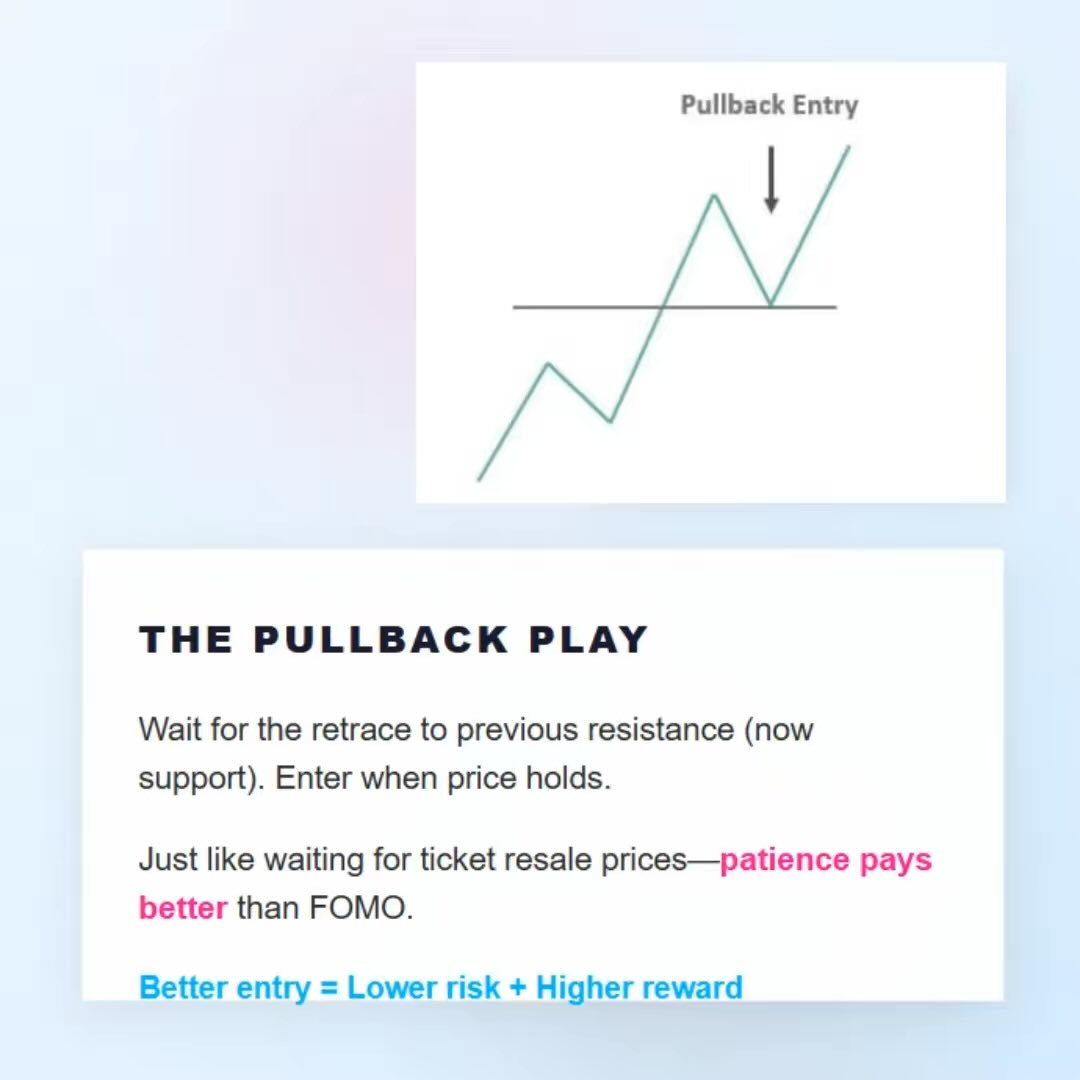
A strong trend is built on a simple structure: Higher Highs and Higher Lows. Instead of entering after a big green candle, patience allows you to buy at key support zones where risk is lower and reward is higher.
The market rarely moves in a straight line. Every healthy uptrend creates pullbacks before continuing higher. Learning to identify these retracements can improve your entries, reduce emotional trading, and help you ride the trend with confidence.
Trade the trend. Respect the pullback. Let probability do the heavy lifting. 🚀
#Trading #StockMarket #PriceAction #TechnicalAnalysis #SwingTrading #PullbackTrading #BoomingBulls #anishsinghthakur

2
7
230
Jun 13
link below to join the trading discord / dm me for 1 on 1 mentorship #explorepage #viral #daytrading #pullbacktrading #sremodel
whop.com/premium-community-5…
1
83

📌 Full Video: youtu.be/Lw6tnZqM0GA
Most traders buy after a stock has already moved.
Then they wonder why their risk is high and their reward is low.
The problem isn't the trend.
The problem is the entry.
The best traders rarely chase.
They wait.
They let the market come to them.
That's where pullback trading comes in.
A strong trend.
A controlled retracement.
A low-risk entry.
And a chance to participate before the next leg higher.
In this short, you'll learn:
• The difference between a pullback and a reversal
• Why the weekly chart should guide your direction
• How the daily chart helps time the entry
• Where disciplined traders define risk
• Why buying strength after a dip often works better than chasing breakouts
Most market participants spend their time trying to predict tops and bottoms.
Professional traders focus on something simpler:
Finding strong trends and joining them at better prices.
That's the edge.
Watch till the end and see if you're trading pullbacks...
Or simply chasing candles.
#PullbackTrading #SwingTrading #PriceAction #TradingStrategy #StockMarketIndia #Nifty #BankNifty #TechnicalAnalysis #TraderEducation #prorsi
1
3
474
Jun 12
link below to join the trading discord / dm me for 1 on 1 mentorship #explorepage #viral #daytrading #pullbacktrading #sremodel
whop.com/premium-community-5…
62
Jun 11
link below to join the trading discord / dm me for 1 on 1 mentorship #explorepage #viral #daytrading #pullbacktrading #sremodel
whop.com/premium-community-5…
59
Jun 11
link below to join the trading discord / dm me for 1 on 1 mentorship #explorepage #viral #daytrading #pullbacktrading #sremodel
whop.com/premium-community-5…
40

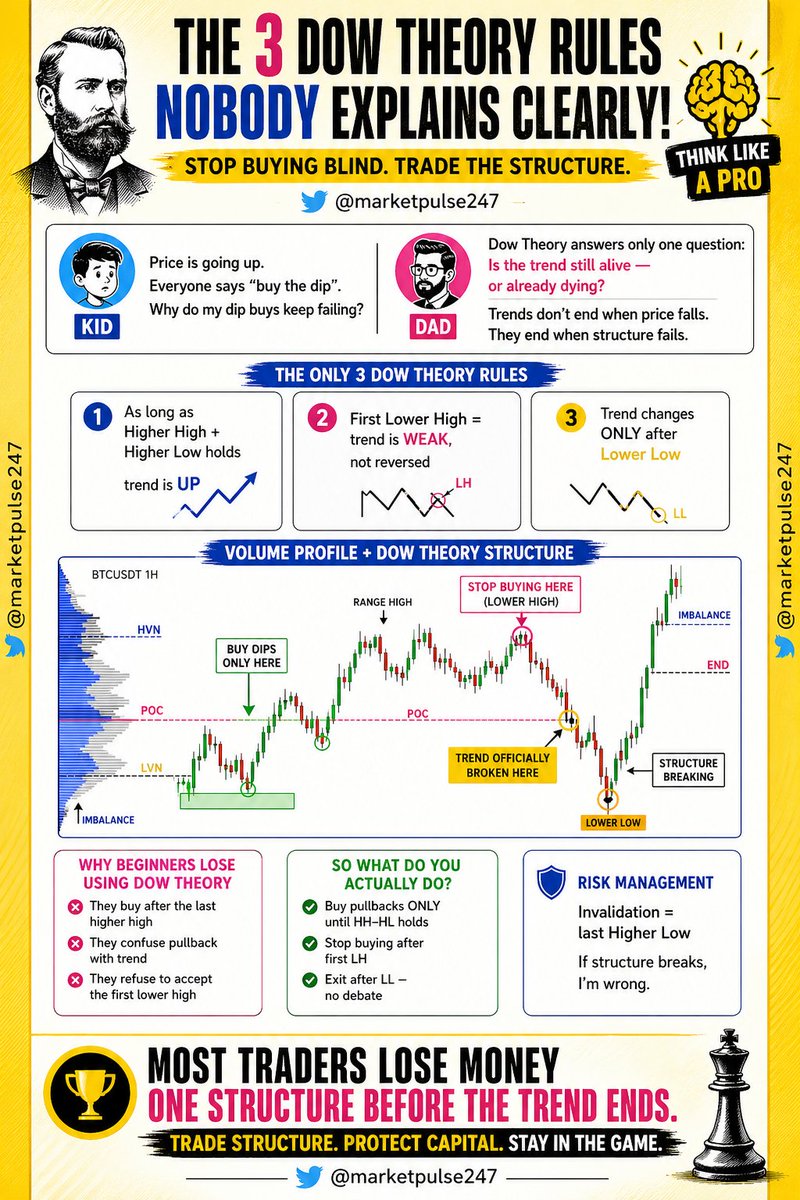
WHY YOUR DIP BUYS KEEP FAILING THE HIDDEN DOW THEORY RULE MOST TRADERS IGNORE
The market is not random your entries are
Most beginners believe that if price is going up the only smart move is to buy every dip. Social media screams buy the dip and traders rush in without understanding structure. Then comes frustration when those dip buys keep failing. The problem is not bad luck. The problem is ignoring trend structure. Dow Theory does not predict tops or bottoms. It answers one powerful question. Is the trend still alive or already dying. An uptrend is defined by higher highs and higher lows. As long as that sequence holds buyers control the market. When that structure weakens smart money becomes cautious. Most retail traders buy because price looks cheap. Professionals buy because structure confirms strength. If you stop focusing on price alone and start focusing on structure your results can completely change.
The three Dow Theory rules nobody explains clearly
There are only three rules you truly need to remember. First as long as higher high and higher low continues the trend is up. That means pullbacks are opportunities not threats. Second the first lower high does not mean reversal. It signals weakness. This is where most traders get trapped. They keep buying aggressively thinking the trend will resume instantly. Third the trend officially changes only after a lower low forms. That is the confirmation that structure is broken. Without a lower low the market is only correcting not reversing. Understanding this sequence gives clarity. Higher high and higher low equals strength. First lower high equals caution. Lower low equals trend change. Trading becomes simple when you respect this progression instead of reacting emotionally to every candle.
Why beginners lose money using Dow Theory
Many traders claim they understand Dow Theory but still lose money because they apply it incorrectly. They buy after the last higher high instead of buying near higher lows. This means they enter when risk is highest not lowest. They confuse a healthy pullback with a full reversal and panic exit early. Or worse they refuse to accept the first lower high and continue buying aggressively even when structure is weakening. Ego becomes expensive. The market does not care about opinions. It respects structure. Most losses happen one structure before the actual trend ends. Traders ignore the first warning sign and keep averaging down. When the lower low finally appears they are already trapped. If you simply stop buying after the first lower high you eliminate a huge percentage of unnecessary losses.
What smart traders actually do differently
Professionals follow a structured process. They buy pullbacks only while higher high and higher low sequence remains intact. They reduce position size or stop buying completely after the first lower high appears. They exit without debate once a lower low confirms trend reversal. There is no emotional argument. There is only structure. Risk management becomes clear because invalidation is defined. In an uptrend the last higher low is the line in the sand. If price breaks below it the trade idea is wrong. This clarity removes confusion and hesitation. Instead of predicting what the market should do they react to what the market is showing. That shift in mindset separates consistent traders from hopeful gamblers. Structure first opinion last becomes the guiding rule.
Risk management is the real edge
The most powerful part of Dow Theory is not entries. It is invalidation. Every trade must have a clear point where you admit you are wrong. In an uptrend that point is the last higher low. If structure breaks you exit. No excuses no averaging no hope. This simple discipline protects capital and keeps you in the game long term. Most traders lose money not because they cannot spot trends but because they refuse to respect structure breaks. Capital preservation allows you to survive until the next clean trend forms. When you combine structural clarity with disciplined exits you stop reacting emotionally to noise. You begin operating with logic. And that is when consistency begins.
CONCLUSION STRUCTURE WINS OPINIONS LOSE
Dow Theory is not complicated. It is brutally simple. Buy pullbacks while higher highs and higher lows hold. Stop buying after the first lower high. Exit after the lower low confirms reversal. Define invalidation at the last higher low. Most traders lose money one structure before the trend actually ends because they ignore warning signs. If you master structure instead of chasing price you transform your trading mindset. Follow structure protect capital stay patient and let the market confirm your bias before committing aggressively. That is how professionals trade and that is how consistency is built.
x.com/@marketpulse247
Hashtags
#DowTheory
#PriceAction
#StockMarket
#Trading
#TechnicalAnalysis
#SmartMoney
#MarketStructure
#TrendTrading
#SwingTrading
#DayTrading
#Investing
#TraderLife
#FinancialFreedom
#RiskManagement
#CapitalProtection
#HigherHigh
#HigherLow
#LowerHigh
#LowerLow
#TrendReversal
#PullbackTrading
#BreakOfStructure
#VolumeProfile
#ChartAnalysis
#TradingPsychology
#Discipline
#WealthBuilding
#EquityMarket
#Nifty
#BankNifty
#IndianStockMarket
#CryptoTrading
#BTCUSDT
#MomentumTrading
#MarketEducation
#LearnTrading
#RetailTrader
#ProTrader
#TradingStrategy
#StockEducation
#InvestmentTips
#MoneyManagement
#TechnicalTrader
#MarketWisdom
#TradeSmart
#FollowTheTrend
#ChartPatterns
#MarketInsights
#TradingCommunity
#WealthMindset
3
4
130
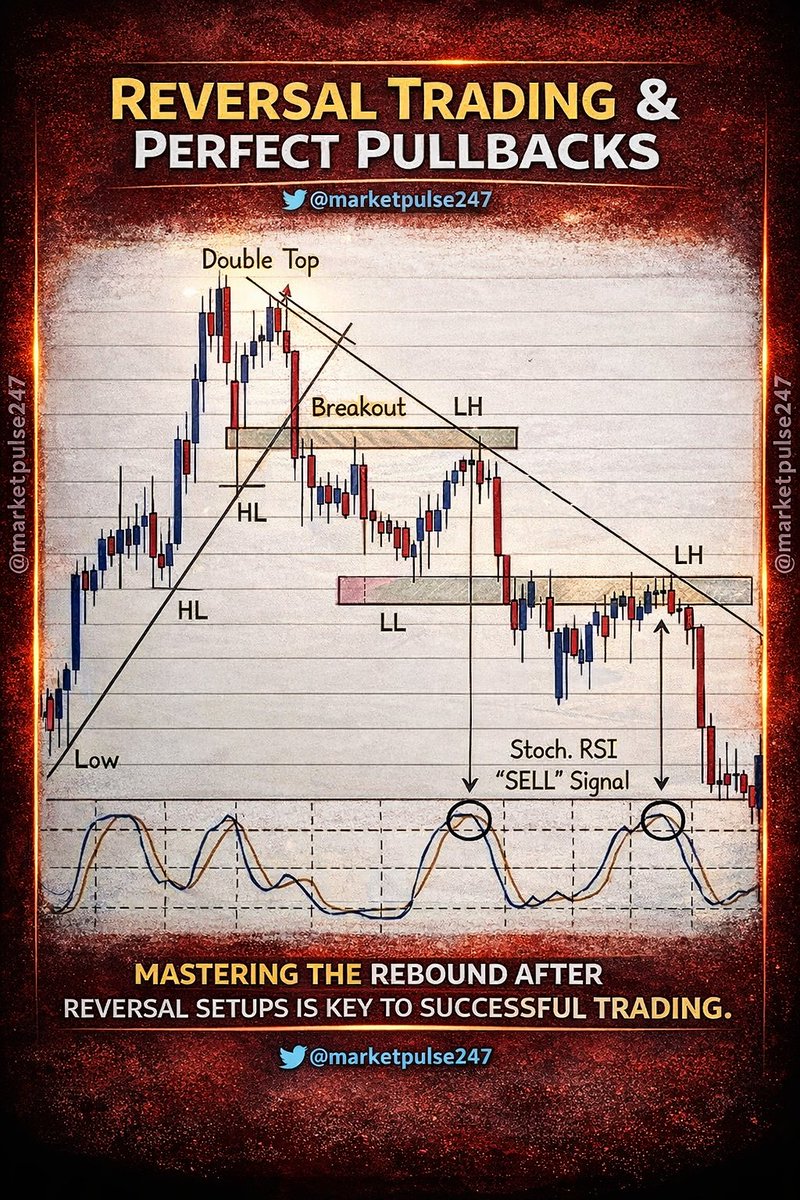
REVERSAL TRADING AND PERFECT PULLBACK STRATEGY EXPLAINED
The market does not move in a straight line. It trends, pauses, reverses, and then continues again. The real skill in trading is not just catching trends but understanding when a trend is about to reverse and how to enter at the right pullback. This is where reversal trading combined with perfect pullbacks becomes a powerful strategy for consistent profits.
1 The journey starts with identifying a strong uptrend. The chart clearly shows higher highs and higher lows, which confirms bullish strength. Many traders get comfortable here and keep buying, but smart traders stay alert. Trends do not last forever, and signs of exhaustion always appear before a reversal.
2 One of the most reliable reversal signals is the double top pattern. This forms when price tests the same resistance level twice but fails to break higher. The second rejection is a warning sign that buyers are losing strength. This is where experienced traders start preparing for a potential trend change instead of blindly buying.
3 After the double top, the price breaks below support. This is known as the breakout, but in this case, it is a breakdown signaling the start of a downtrend. However, entering immediately after the breakdown can be risky because markets often retest the breakout zone.
4 This is where the concept of pullback becomes important. After the breakdown, price often comes back to retest the previous support which now acts as resistance. This area is marked clearly in the chart. Many traders miss this opportunity because they chase the initial move, but professionals wait patiently for this retest.
5 The formation of a lower high confirms that the trend has changed. Earlier the market was making higher highs, but now it fails to reach previous highs. This shift from higher highs to lower highs is a clear indication of bearish control. This is one of the most important confirmations in reversal trading.
6 As the trend continues downward, the market starts forming lower lows. This creates a clear structure of a downtrend. Traders who understand this structure can ride the trend instead of fighting it. The key is to align with the market, not against it.
7 The Stochastic RSI indicator adds another layer of confirmation. When the price pulls back and the indicator shows an overbought condition, it signals a potential sell opportunity. In the chart, the sell signals are clearly marked where the indicator peaks and starts turning downward.
8 Combining price action with indicators increases the probability of success. Price action tells you what is happening, and indicators help confirm it. When both align, the trade becomes stronger and more reliable.
9 Risk management is what separates successful traders from the rest. Even the best setups can fail. Always place a stop loss above the recent lower high when taking a sell trade. This protects your capital and keeps you in the game for the long term.
10 Patience is the real edge in this strategy. Many traders lose money because they rush into trades. Waiting for the perfect pullback, confirmation of lower high, and indicator signal requires discipline, but it significantly improves accuracy.
11 Consistency comes from repeating the same process again and again. Identify the trend, wait for reversal signals, confirm the structure change, and enter on pullbacks. This structured approach removes emotional decision making and builds confidence over time.
12 The beauty of this strategy is its simplicity. You do not need complex indicators or complicated systems. Just understanding market structure, support and resistance, and timing your entry correctly can transform your trading.
CONCLUSION
Reversal trading with perfect pullbacks is not about predicting the market but about reacting to what the market is showing. When you combine chart patterns like double top with structure shifts like lower highs and confirmations from indicators like Stochastic RSI, you create a high probability trading setup. The real power lies in patience, discipline, and execution. Master this approach and you will stop chasing the market and start trading with confidence and clarity.
x.com/Marketpulse247/status/…
#trading #stockmarket #priceaction #reversaltrading #pullbacktrading #technicalanalysis #chartanalysis #tradingstrategy #intradaytrading #swingtrading #stocktrading #marketstructure #lowerhigh #higherlow #doubletop #breakout #breakdown #supportandresistance #stochasticrsi #tradingtips #learntrading #traderlife #marketanalysis #financialmarkets #stockmarketindia #nifty50 #banknifty #equitymarket #tradingcommunity #investing #wealthcreation #moneygrowth #marketinsights #tradingmindset #riskmanagement #patterntrading #markettrends #chartpatterns #tradingjourney #stockanalysis #tradingknowledge #technicaltrading #daytrading #scalping #marketpsychology #smarttrading #pricepatterns #marketlearning #tradingrules

REVERSAL TRADING AND PERFECT PULLBACK STRATEGY EXPLAINED
The market does not move in a straight line. It trends, pauses, reverses, and then continues again. The real skill in trading is not just catching trends but understanding when a trend is about to reverse and how to enter at the right pullback. This is where reversal trading combined with perfect pullbacks becomes a powerful strategy for consistent profits.
1 The journey starts with identifying a strong uptrend. The chart clearly shows higher highs and higher lows, which confirms bullish strength. Many traders get comfortable here and keep buying, but smart traders stay alert. Trends do not last forever, and signs of exhaustion always appear before a reversal.
2 One of the most reliable reversal signals is the double top pattern. This forms when price tests the same resistance level twice but fails to break higher. The second rejection is a warning sign that buyers are losing strength. This is where experienced traders start preparing for a potential trend change instead of blindly buying.
3 After the double top, the price breaks below support. This is known as the breakout, but in this case, it is a breakdown signaling the start of a downtrend. However, entering immediately after the breakdown can be risky because markets often retest the breakout zone.
4 This is where the concept of pullback becomes important. After the breakdown, price often comes back to retest the previous support which now acts as resistance. This area is marked clearly in the chart. Many traders miss this opportunity because they chase the initial move, but professionals wait patiently for this retest.
5 The formation of a lower high confirms that the trend has changed. Earlier the market was making higher highs, but now it fails to reach previous highs. This shift from higher highs to lower highs is a clear indication of bearish control. This is one of the most important confirmations in reversal trading.
6 As the trend continues downward, the market starts forming lower lows. This creates a clear structure of a downtrend. Traders who understand this structure can ride the trend instead of fighting it. The key is to align with the market, not against it.
7 The Stochastic RSI indicator adds another layer of confirmation. When the price pulls back and the indicator shows an overbought condition, it signals a potential sell opportunity. In the chart, the sell signals are clearly marked where the indicator peaks and starts turning downward.
8 Combining price action with indicators increases the probability of success. Price action tells you what is happening, and indicators help confirm it. When both align, the trade becomes stronger and more reliable.
9 Risk management is what separates successful traders from the rest. Even the best setups can fail. Always place a stop loss above the recent lower high when taking a sell trade. This protects your capital and keeps you in the game for the long term.
10 Patience is the real edge in this strategy. Many traders lose money because they rush into trades. Waiting for the perfect pullback, confirmation of lower high, and indicator signal requires discipline, but it significantly improves accuracy.
11 Consistency comes from repeating the same process again and again. Identify the trend, wait for reversal signals, confirm the structure change, and enter on pullbacks. This structured approach removes emotional decision making and builds confidence over time.
12 The beauty of this strategy is its simplicity. You do not need complex indicators or complicated systems. Just understanding market structure, support and resistance, and timing your entry correctly can transform your trading.
CONCLUSION
Reversal trading with perfect pullbacks is not about predicting the market but about reacting to what the market is showing. When you combine chart patterns like double top with structure shifts like lower highs and confirmations from indicators like Stochastic RSI, you create a high probability trading setup. The real power lies in patience, discipline, and execution. Master this approach and you will stop chasing the market and start trading with confidence and clarity.
#trading #stockmarket #priceaction #reversaltrading #pullbacktrading #technicalanalysis #chartanalysis #tradingstrategy #intradaytrading #swingtrading #stocktrading #marketstructure #lowerhigh #higherlow #doubletop #breakout #breakdown #supportandresistance #stochasticrsi #tradingtips #learntrading #traderlife #marketanalysis #financialmarkets #stockmarketindia #nifty50 #banknifty #equitymarket #tradingcommunity #investing #wealthcreation #moneygrowth #marketinsights #tradingmindset #riskmanagement #patterntrading #markettrends #chartpatterns #tradingjourney #stockanalysis #tradingknowledge #technicaltrading #daytrading #scalping #marketpsychology #smarttrading #pricepatterns #marketlearning #tradingrules
3
4
160

Mar 22
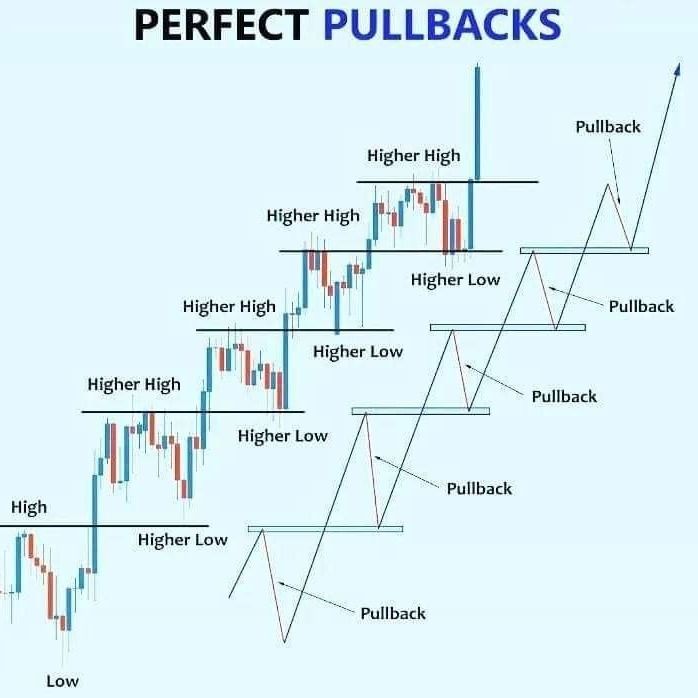
"Perfect Pullbacks
Uptrend में Higher Highs और Higher Lows बनते रहते हैं, और हर pullback एक golden buying opportunity!
#Trading #PullbackTrading #StockMarket #PriceAction

5
69
Mastering the Art of Trading Complex Pullbacks
In the world of trading, trends rarely move in a straight line. Markets move in waves — rising, pulling back, and then continuing in the direction of the main trend. Understanding how to trade these pullbacks is one of the most valuable skills a trader can develop. Among the various pullback strategies, the complex pullback setup stands out because it helps traders enter strong trends at better prices while keeping risk under control.
A complex pullback usually occurs when a stock or index has already shown a strong upward move and then begins to correct gradually. Instead of falling sharply, the price moves sideways or slowly downward in multiple small waves before continuing its upward trend. This period of consolidation often shakes out impatient traders, but experienced traders see it as an opportunity.
The first step in trading a complex pullback is patience. When the market makes the first strong upward move, many traders rush to buy immediately. However, disciplined traders often skip this first leg up. The reason is simple — entering after a big move can expose traders to unnecessary risk if the price corrects. Waiting for the pullback allows traders to enter the trade at a more favorable level.
Once the pullback begins, traders start watching the price action carefully. During this stage, the market may form reversal candlestick patterns, which often signal that selling pressure is weakening. One such pattern is the Bullish Harami, a formation where a small candle appears within the body of the previous larger candle. This pattern indicates that the downward momentum may be fading and buyers could soon regain control.
Another important element in this setup is support and moving averages. When the price pulls back toward a rising moving average—such as the 10-day, 20-day, or 50-day average—it often finds support. These moving averages act like dynamic support levels where institutional traders and experienced investors may step in to buy.
After the reversal pattern appears near support, traders prepare for the next step: entry. Instead of buying immediately, many traders prefer to place their entry slightly above the closing price of the first strong bullish candle after the reversal signal. This confirms that buyers are indeed stepping back into the market.
Risk management plays a critical role in the setup. A stop-loss is usually placed just below the recent swing low or below the second candle in the reversal structure. This ensures that if the setup fails, the loss remains small and controlled.
Finally comes the profit target. Many traders use Fibonacci levels such as 1.618 extensions or the next resistance level to estimate where the next upward move might reach. While targets provide guidance, experienced traders also pay attention to overall market momentum and adjust their exits accordingly.
What makes the complex pullback strategy powerful is that it aligns traders with the dominant trend while providing a structured way to manage risk. Instead of chasing price after a big rally, traders wait for the market to offer a better entry during temporary weakness.
Conclusion
Successful trading is not about catching every move in the market. It’s about identifying high-probability setups and executing them with discipline. The complex pullback strategy teaches traders patience, precision, and proper risk management. By learning to recognize these patterns and waiting for the right confirmation, traders can participate in strong trends with confidence while keeping their risk under control.
x.com/@marketpulse247
#StockMarket
#TradingStrategy
#PriceAction
#TechnicalAnalysis
#SwingTrading
#DayTrading
#TradingEducation
#TradingTips
#ChartPatterns
#StockMarketIndia
#MarketAnalysis
#TradeSmart
#RiskManagement
#Fibonacci
#PullbackTrading
#TraderLife
#LearnTrading
#TradingPsychology
#MarketPulse247
#StockMarketLearning

4
5
149
📍 Full Video: youtube.com/watch?v=EaAgHNcu…
The market drops.
Your stock turns red.
Fear kicks in.
You exit.
Two weeks later…
the same stock makes a new high — without you.
This cycle destroys more traders than bad strategies ever will.
Because most corrections are not trend reversals.
They are shakeouts.
Sharp pullbacks.
Sideways chop.
Sudden red candles.
All designed to test patience.
The problem?
Most traders have no objective rule telling them when the trend is still intact.
This is where one simple tool changes everything.
RSI 50.
When RSI (50-period) stays above 50,
average gains still dominate average losses.
Which means:
The trend is mathematically intact.
No matter how ugly the correction looks.
Most traders panic during these phases because they rely on:
• Emotions
• Headlines
• Short-term candles
Professionals rely on momentum structure.
In this breakdown you’ll learn how the RSI 50 level helps you:
• Stay calm during complex market corrections
• Separate temporary pullbacks from real trend reversals
• Hold winning positions instead of panic selling bottoms
• Identify the true trend break — RSI falling below 50
• Avoid giving back profits from emotional exits
• Ride powerful trends from start to finish
The video shows real market examples where stocks corrected sharply but RSI stayed above 50 — and the uptrend continued.
The market often tests conviction before rewarding patience.
Your biggest enemy during corrections is not the price drop.
It’s your reaction to it.
Save this post and revisit it during your next correction.
If you want to see how RSI 50 helps traders hold trends with confidence, the full breakdown is in the video above.
Quick question:
Have you ever sold during a correction…
only to watch the stock rally without you?
#RSI50 #RSIIndicator #RSIStrategy #TrendTrading #MomentumTrading #TechnicalAnalysis #PriceAction #StockMarketIndia #SwingTrading #IntradayTrading #TradingPsychology #MarketCorrection #PullbackTrading #NSEStocks #CryptoTrading #ForexTrading #TrendFollowing #ProfessionalTrading #BharatJhunjhunwala #ProRSI
4
877
📍 Full Video: youtube.com/watch?v=EaAgHNcu…
The market drops.
Your stock turns red.
Fear kicks in.
You exit.
Two weeks later…
the same stock makes a new high — without you.
This cycle destroys more traders than bad strategies ever will.
Because most corrections are not trend reversals.
They are shakeouts.
Sharp pullbacks.
Sideways chop.
Sudden red candles.
All designed to test patience.
The problem?
Most traders have no objective rule telling them when the trend is still intact.
This is where one simple tool changes everything.
RSI 50.
When RSI (50-period) stays above 50,
average gains still dominate average losses.
Which means:
The trend is mathematically intact.
No matter how ugly the correction looks.
Most traders panic during these phases because they rely on:
• Emotions
• Headlines
• Short-term candles
Professionals rely on momentum structure.
In this breakdown you’ll learn how the RSI 50 level helps you:
• Stay calm during complex market corrections
• Separate temporary pullbacks from real trend reversals
• Hold winning positions instead of panic selling bottoms
• Identify the true trend break — RSI falling below 50
• Avoid giving back profits from emotional exits
• Ride powerful trends from start to finish
The video shows real market examples where stocks corrected sharply but RSI stayed above 50 — and the uptrend continued.
The market often tests conviction before rewarding patience.
Your biggest enemy during corrections is not the price drop.
It’s your reaction to it.
Save this post and revisit it during your next correction.
If you want to see how RSI 50 helps traders hold trends with confidence, the full breakdown is in the video above.
Quick question:
Have you ever sold during a correction…
only to watch the stock rally without you?
#RSI50 #RSIIndicator #RSIStrategy #TrendTrading #MomentumTrading #TechnicalAnalysis #PriceAction #StockMarketIndia #SwingTrading #IntradayTrading #TradingPsychology #MarketCorrection #PullbackTrading #NSEStocks #CryptoTrading #ForexTrading #TrendFollowing #ProfessionalTrading #BharatJhunjhunwala #ProRSI
5
924
📍 Full Video: youtu.be/EaAgHNcurAM
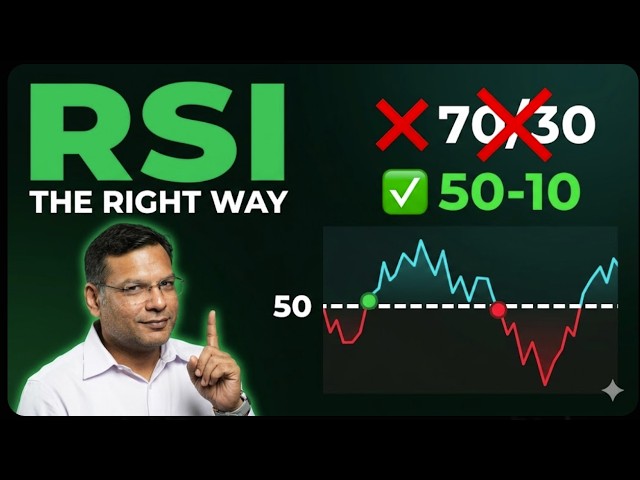
Most traders think they understand RSI.
But the truth is — they are only using 10% of its power.
They buy at 30.
They sell at 70.
And then they blame the indicator when trades fail.
Because RSI was never meant to be used like that.
RSI is not just an overbought–oversold indicator.
It is a complete momentum framework when used correctly.
The real shift begins when you stop using one RSI…
and start using two RSI structures together.
First layer: Trend Identification
A 50-period RSI acts like a momentum compass.
If RSI holds above 50 → buyers dominate the trend.
If RSI stays below 50 → sellers control the market.
No guessing.
No subjective trendlines.
Just pure momentum math.
Second layer: Entry Timing
A 10-period RSI reacts faster to pullbacks.
Inside an uptrend:
When RSI crosses above 60, momentum expansion begins.
Inside a downtrend:
When RSI drops below 40, selling pressure increases.
Now the system becomes clear:
RSI-50 identifies the trend.
RSI-10 times the entry.
One indicator.
Two powerful roles.
This Dual RSI structure works across markets:
• Stocks
• Crypto
• Forex
• Commodities
And across timeframes:
• Intraday trading
• Swing trading
• Positional setups
In the video you’ll see real market examples including:
Tata Motors
Kotak Mahindra Bank
CG Power
Zee Entertainment
Navin Fluorine
Tata Communications
Bitcoin
Ethereum
Once you understand this framework, RSI stops being a simple oscillator…
and starts becoming a precision trading system.
Save this post and revisit it before your next trade.
If you want to understand the complete Dual RSI system, the full breakdown is in the video above.
Question for serious traders:
Did you know RSI could identify trend this clearly?
#RSI #RSIStrategy #DualRSI #RSIIndicator #TechnicalAnalysis #PriceAction #MomentumTrading #SwingTrading #IntradayTrading #StockMarketIndia #NSEStocks #CryptoTrading #ForexTrading #TradingSystem #PullbackTrading #MomentumIndicator #ChartAnalysis #TradingEducation #ProfessionalTrading #RSIMastery
2
22
1,376
Most traders lose money buying dips for one simple reason:
they buy every dip.
Here’s the truth 👇
Not every dip is a buying opportunity.
The real edge lies in understanding thrust and retracement.
First, look at the thrust.
A thrust shows intent and participation.
Strong thrust =
• Fast move
• Large candles
• Fewer candles in less time
Weak thrust =
• Slow, choppy move
• Small candles
• No urgency
Then comes the pullback.
The depth of the pullback decides whether you buy or stay out.
Core rule:
Strong thrust shallow pullback = buy the dip
Weak thrust deep pullback = dip trap
Buy the dip when:
• Thrust is strong and steep
• Pullback is shallow (23.6%–38.2%)
• Momentum remains bullish
• Structure is intact
• Volume supports the move
Avoid the dip when:
• Thrust is weak
• Pullback is deep (61.8%–78.6%)
• Momentum divergence appears
• Structure breaks
• Volume fades
Professionals don’t guess.
They measure thrust strength and retracement depth.
Before buying any dip, ask one question:
Did price earn the right to be bought?
Full video breakdown 👇
youtu.be/qh9AvezvpRg
#BuyTheDip #PriceActionTrading #PullbackTrading #ThrustAnalysis #Retracement #MarketStructure #FibonacciRetracement #TrendTrading #TradingEducation #SmartMoney
21
116
6,068
📌 5 Golden Rules of Price Action Trading (That Professionals Actually Follow)
🎥 Full Video: youtu.be/qh9AvezvpRg
Most traders fail at price action not because the strategy doesn’t work — but because risk, structure, and momentum are misunderstood. This video breaks down the 5 golden rules of price action trading used by professional traders to stay in winning trades and avoid getting stopped out unnecessarily.
You’ll learn how to trade pullbacks with structure, place ATR-based stop losses that adapt to volatility, and identify real momentum and thrust moves instead of reacting to noise. This is not indicator clutter or prediction-based trading — it’s clean, rule-based price action grounded in how markets actually move.
🔍 Perfect for traders searching for:
• Price action trading rules
• How to trade pullbacks correctly
• ATR stop loss explained
• Market structure trading
• Momentum & thrust trading
• Why traders get stopped out
📈 What This Video Covers
✅ Why most price action traders lose despite “right” analysis
✅ The 5 golden rules professionals follow
✅ Pullback trading with structure and context
✅ ATR stop loss for volatility-aware risk management
✅ Reading market structure shifts early
✅ Identifying momentum vs fake moves
✅ Trading expansion and thrust phases
✅ Common mistakes that kill good trades
✅ Real chart examples with clean execution
🎯 You Will Learn
✔️ How to stop using random stop losses
✔️ How to align pullbacks with structure
✔️ How to trade momentum instead of chop
✔️ How professionals manage risk objectively
✔️ How to stay in winning trades longer
✔️ How to build discipline with price action
If you want clarity, consistency, and confidence in price action trading, this framework is essential.
#PriceActionTrading #PullbackTrading #ATRStopLoss #MarketStructure
#MomentumTrading
7
32
2,661

Trading Cheat Code - Pullbacks
Here's a look at why pullbacks can feel like a "cheat code" in trading. #tradingtips #PullbackTrading #DayTrading #TradeSmart #Traderlnsights
3
132
Most traders struggle with pullbacks because they rely on single-factor setups.
Professional traders think differently — they wait for confluence.
This video explains pullback trading using multiple confluence, where price structure, key levels, and institutional behavior align before a trade is considered.
You’ll learn how Fibonacci retracements, moving averages, and support–resistance zones work together — and how smart money activity often appears during pullbacks, not at breakouts.
Instead of random dip buying, this approach focuses on structured pullback zones where probability improves due to alignment across tools and timeframes.
This is an educational framework used to filter noise, reduce overtrading, and focus on higher-quality pullback scenarios.
Works across stocks, indices, crypto, forex, and commodities.
🔍 WHAT THIS VIDEO COVERS
• Why single-indicator pullbacks often fail
• How multiple confluence improves trade context
• Fibonacci retracement levels that matter
• Moving averages as dynamic support
• Support & resistance for pullback validation
• Liquidity behavior during pullbacks
• Identifying weak vs strong retracements
• Entry, risk, and trade management concepts
• Multi-timeframe examples for clarity
⚡ WHY THIS MATTERS
→ Pullbacks are where trends are tested
→ Confluence helps separate noise from structure
→ Institutions often act during retracements
→ Fewer trades, better context, cleaner execution
→ Focus on process, not prediction
This is not a signal or a shortcut.
It’s a structured way to study pullbacks with discipline and clarity.
LIKE if you trade pullbacks
COMMENT: Fibonacci or Support–Resistance — which do you rely on more?
FOLLOW for structured price-action education
#PullbackTrading
#TradingEducation
#FibonacciRetracement
#MovingAverages
#SupportAndResistance
#PriceActionTrading
10
37
2,302