
Jun 12
Abi bu uyumsuzlukları kullanıyormusun şuanda olduğu gibi eth lowerhigh yaparken btc higher high yapması gibi
1
2
219

Jun 8
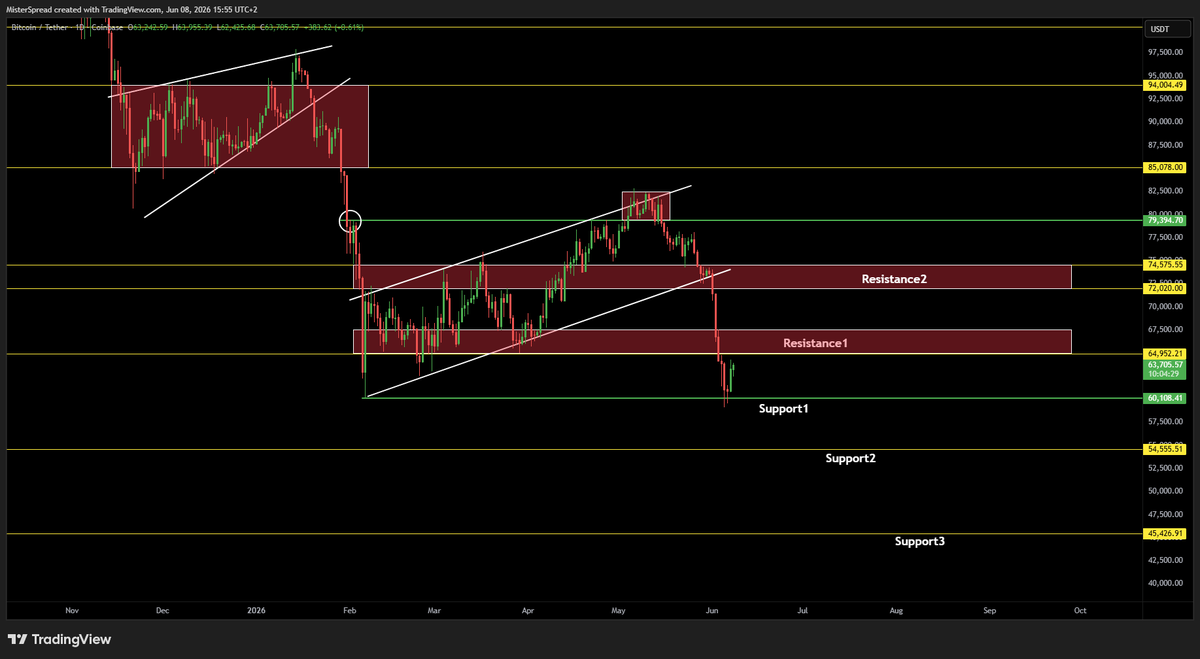
ZERO bottom confirmations on bitcoin:native so far
I know it's cool and trendy to speak about bottoms, but as of today there are zero bottom confirmations.
As long as we don't have a weekly close above 74k area and continuation above 80k, any rally that will reject will be just another HTF LowerHigh.
P.S: Too early to speak about DoubleBottom as well.
10
10
137
4,155
May 31
Hi ,
The difference is that in September 2023 bitcoin:native was already in a bullrun after it left the lows behind and confirmed the break above 20k with that leaving the macro accumulation range behind.
Here we are still in a bearmarket and just printed a HTF LowerHigh, so we don't have yet that macro accumulation range the break above it confirming it.
1
14
1,255
May 29
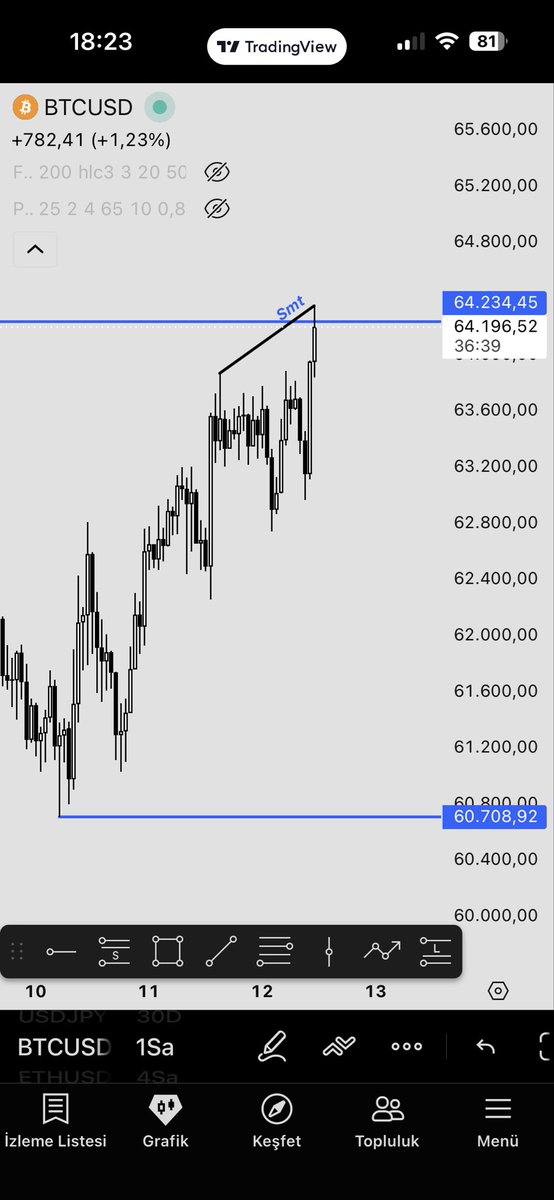
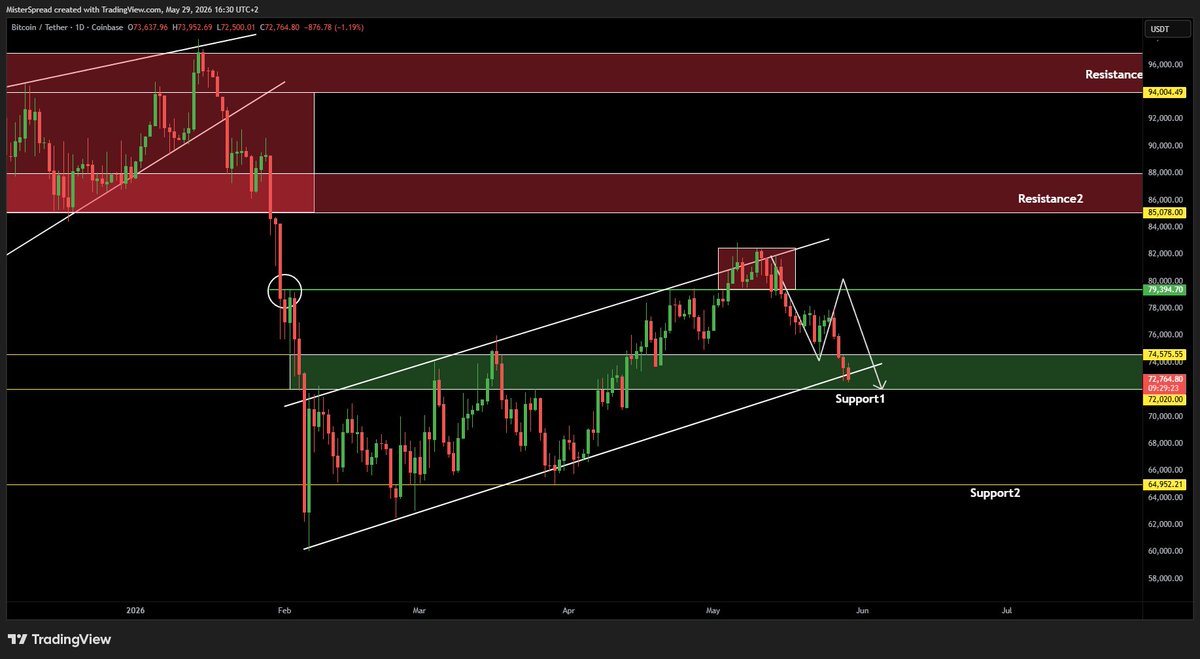
Update on $BTC short-term positioning part 3
After the last bounce under 79k area, we saw a very weak reaction from buyers which printed an internal LowerHigh on LTF.
We are approaching fast an extremely important support > 72k area (the fractal worked out very clean for those who follow Price), lose that and I don't see any other relevant support till 68kish area, so 65k would be the area to target IF we lose 72k.
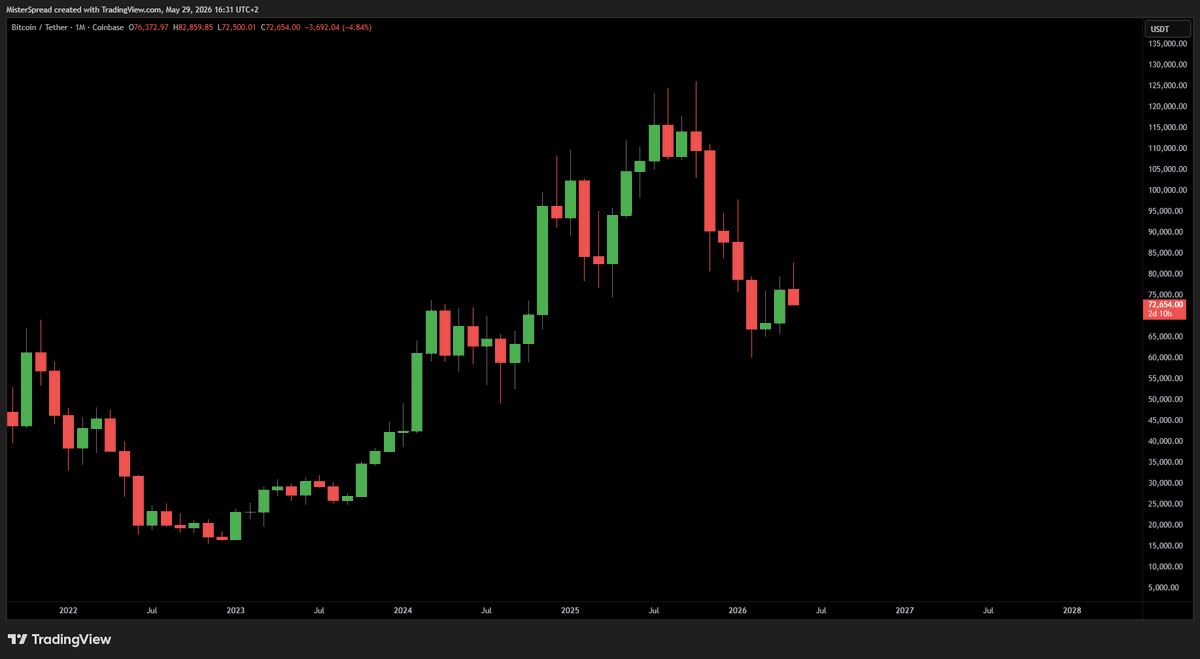
Oh yeah, don't check the monthly chart on Bitcoin, with 2 more days till the monthly close, bulls have to pull a rabbit out of the hat to save this ugly candle. 👀
May 20

Update on bitcoin:native short-term positioning
Previous shorts from 79.4k are closed on this bounce in profit.
Waiting to see what we reaction we get and how much juice this bounce has.
As long as we are under 79.4k area on weekly close I will look to short rejections. Thoughts?🫡

5
5
70
11,048

May 25
You are making a very fundamental mistake. There are NO HIGHERHIGHS or HIGHERLOWS .... yet. The first VALID HigherHigh will need to close ABOVE the last LowerHigh (around the $98K mark). That's a LONG WAY away, my guy. What you are seeing now are PULLBACKS!!
That's basic chart reading 101, dude!!
1
3
239

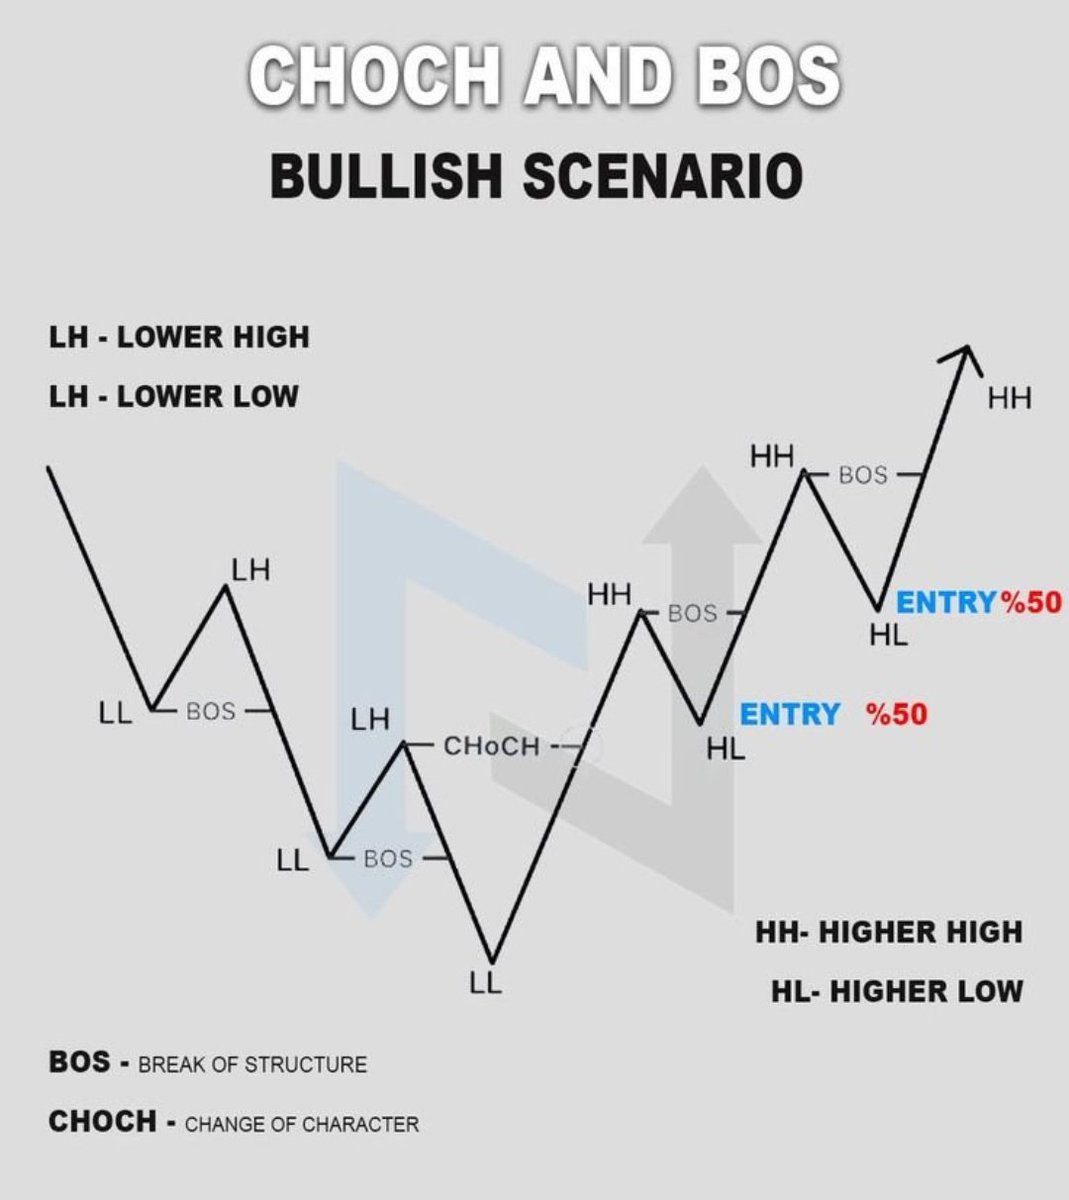
#CHOCH
#BOS
Simple and effective...
#Changeofcharacter
#Breakofstructure
#Lowerlow
#Lowerhigh
#Higherhigh
#Higherlow
1
6
310
May 10
Conform textbook charting / Price Action
Acest first weekly high e ceva normal dupa -52% si ceva sideways.
Cand o sa trecem peste precedentul LowerHigh atunci o sa fie prima schimbare de structura, am explicat in video de mai jos punct cu punct fara brizbrizuri
May 6
This is how Bitcoin bottoms
If you're tired of permabulls or permabears and you want a balance talk with no fluff or bs, just watch this video.
P.S: I'm open to debate with anyone, so reshare it with anyone who has a different view🫡
1
1
9
948

May 6
85/88k will be the next LowerHigh, will explain in a video soon
1
17
1,919
May 4
Funny, some of us "charts squigglers" reminded you since December that we will start a massive correction and at each bounce that we will go lower.
I think after a -52% drop is fair to say at least some of the TA people nailed it.
P.S: Even if we continue to rally to 85/88k, and not continue higher, it will still have the potential for a new macro LowerHigh, will explain in depth later.
1
11
855

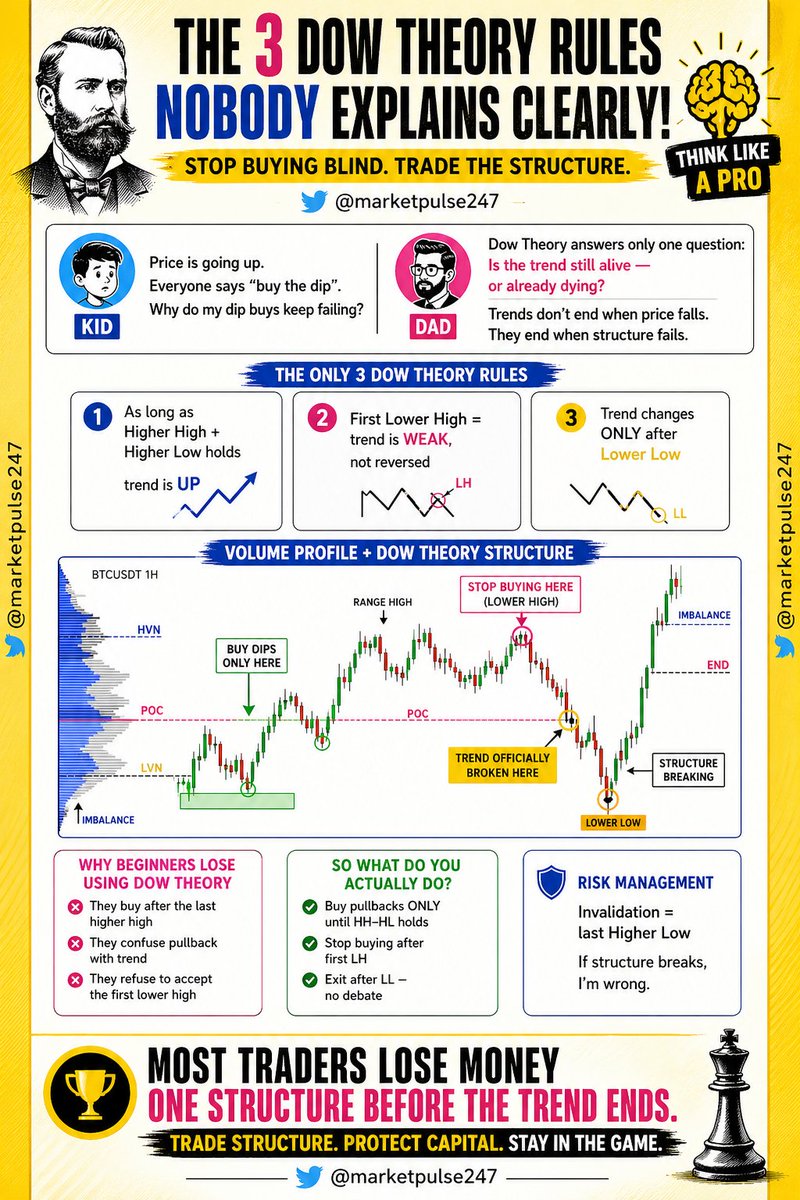
WHY YOUR DIP BUYS KEEP FAILING THE HIDDEN DOW THEORY RULE MOST TRADERS IGNORE
The market is not random your entries are
Most beginners believe that if price is going up the only smart move is to buy every dip. Social media screams buy the dip and traders rush in without understanding structure. Then comes frustration when those dip buys keep failing. The problem is not bad luck. The problem is ignoring trend structure. Dow Theory does not predict tops or bottoms. It answers one powerful question. Is the trend still alive or already dying. An uptrend is defined by higher highs and higher lows. As long as that sequence holds buyers control the market. When that structure weakens smart money becomes cautious. Most retail traders buy because price looks cheap. Professionals buy because structure confirms strength. If you stop focusing on price alone and start focusing on structure your results can completely change.
The three Dow Theory rules nobody explains clearly
There are only three rules you truly need to remember. First as long as higher high and higher low continues the trend is up. That means pullbacks are opportunities not threats. Second the first lower high does not mean reversal. It signals weakness. This is where most traders get trapped. They keep buying aggressively thinking the trend will resume instantly. Third the trend officially changes only after a lower low forms. That is the confirmation that structure is broken. Without a lower low the market is only correcting not reversing. Understanding this sequence gives clarity. Higher high and higher low equals strength. First lower high equals caution. Lower low equals trend change. Trading becomes simple when you respect this progression instead of reacting emotionally to every candle.
Why beginners lose money using Dow Theory
Many traders claim they understand Dow Theory but still lose money because they apply it incorrectly. They buy after the last higher high instead of buying near higher lows. This means they enter when risk is highest not lowest. They confuse a healthy pullback with a full reversal and panic exit early. Or worse they refuse to accept the first lower high and continue buying aggressively even when structure is weakening. Ego becomes expensive. The market does not care about opinions. It respects structure. Most losses happen one structure before the actual trend ends. Traders ignore the first warning sign and keep averaging down. When the lower low finally appears they are already trapped. If you simply stop buying after the first lower high you eliminate a huge percentage of unnecessary losses.
What smart traders actually do differently
Professionals follow a structured process. They buy pullbacks only while higher high and higher low sequence remains intact. They reduce position size or stop buying completely after the first lower high appears. They exit without debate once a lower low confirms trend reversal. There is no emotional argument. There is only structure. Risk management becomes clear because invalidation is defined. In an uptrend the last higher low is the line in the sand. If price breaks below it the trade idea is wrong. This clarity removes confusion and hesitation. Instead of predicting what the market should do they react to what the market is showing. That shift in mindset separates consistent traders from hopeful gamblers. Structure first opinion last becomes the guiding rule.
Risk management is the real edge
The most powerful part of Dow Theory is not entries. It is invalidation. Every trade must have a clear point where you admit you are wrong. In an uptrend that point is the last higher low. If structure breaks you exit. No excuses no averaging no hope. This simple discipline protects capital and keeps you in the game long term. Most traders lose money not because they cannot spot trends but because they refuse to respect structure breaks. Capital preservation allows you to survive until the next clean trend forms. When you combine structural clarity with disciplined exits you stop reacting emotionally to noise. You begin operating with logic. And that is when consistency begins.
CONCLUSION STRUCTURE WINS OPINIONS LOSE
Dow Theory is not complicated. It is brutally simple. Buy pullbacks while higher highs and higher lows hold. Stop buying after the first lower high. Exit after the lower low confirms reversal. Define invalidation at the last higher low. Most traders lose money one structure before the trend actually ends because they ignore warning signs. If you master structure instead of chasing price you transform your trading mindset. Follow structure protect capital stay patient and let the market confirm your bias before committing aggressively. That is how professionals trade and that is how consistency is built.
x.com/@marketpulse247
Hashtags
#DowTheory
#PriceAction
#StockMarket
#Trading
#TechnicalAnalysis
#SmartMoney
#MarketStructure
#TrendTrading
#SwingTrading
#DayTrading
#Investing
#TraderLife
#FinancialFreedom
#RiskManagement
#CapitalProtection
#HigherHigh
#HigherLow
#LowerHigh
#LowerLow
#TrendReversal
#PullbackTrading
#BreakOfStructure
#VolumeProfile
#ChartAnalysis
#TradingPsychology
#Discipline
#WealthBuilding
#EquityMarket
#Nifty
#BankNifty
#IndianStockMarket
#CryptoTrading
#BTCUSDT
#MomentumTrading
#MarketEducation
#LearnTrading
#RetailTrader
#ProTrader
#TradingStrategy
#StockEducation
#InvestmentTips
#MoneyManagement
#TechnicalTrader
#MarketWisdom
#TradeSmart
#FollowTheTrend
#ChartPatterns
#MarketInsights
#TradingCommunity
#WealthMindset
3
4
130

Apr 27
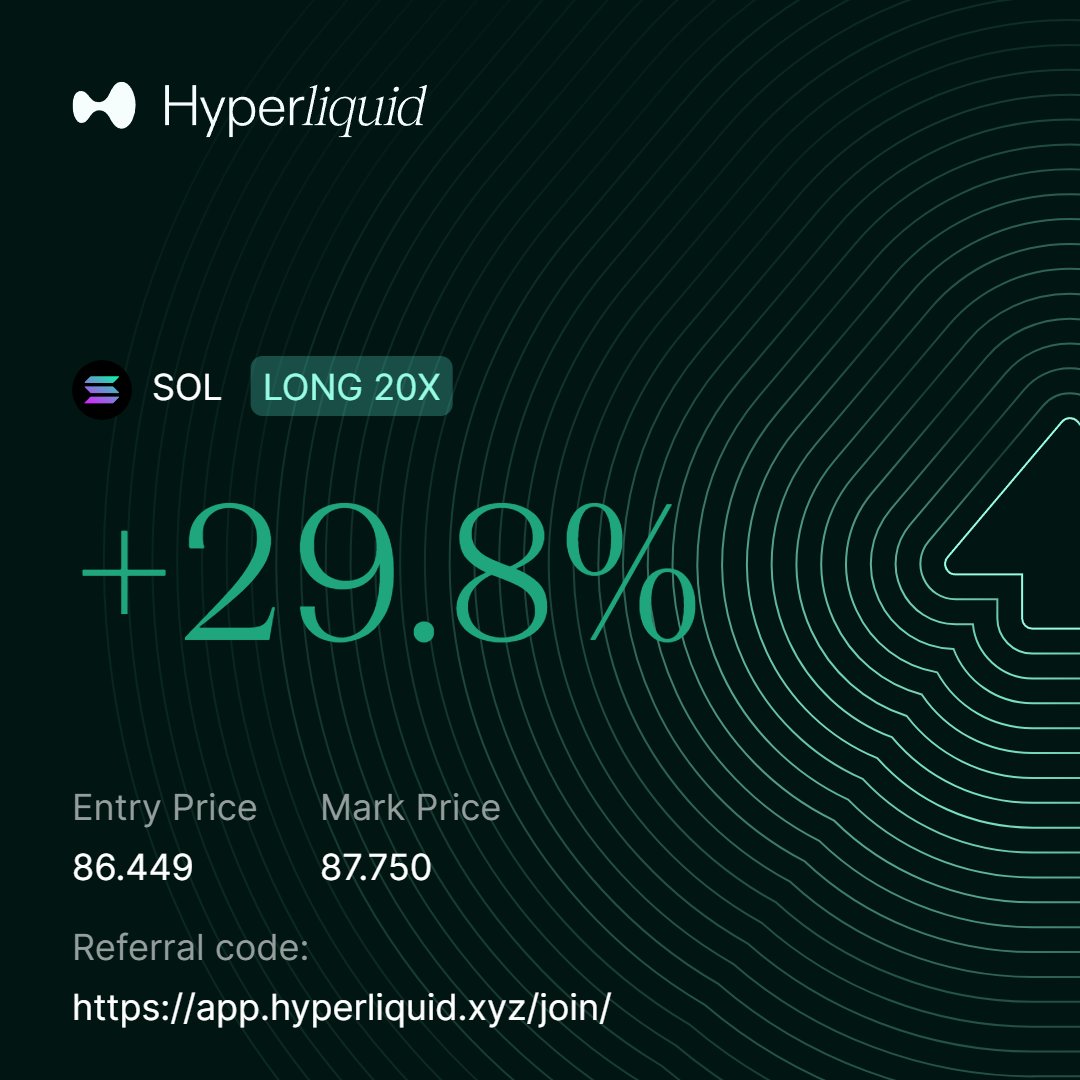
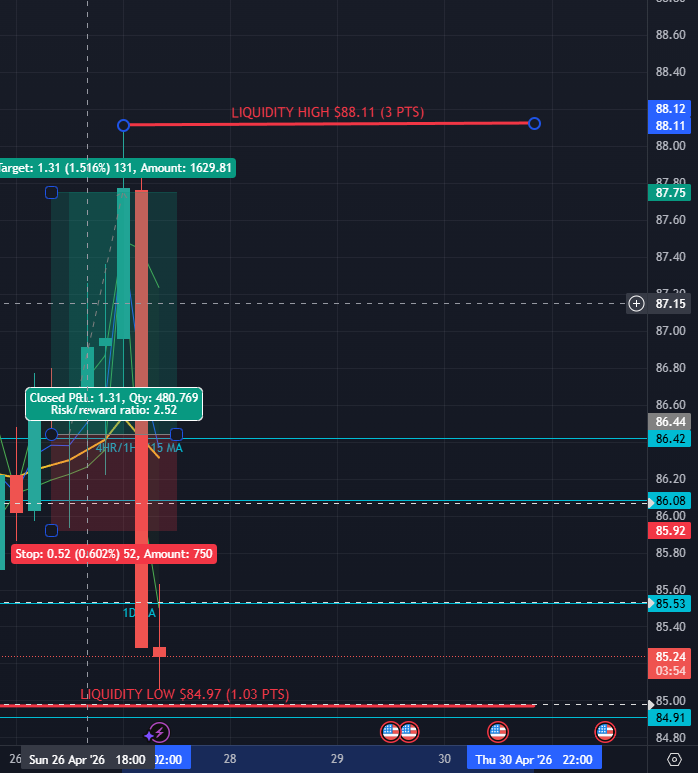
$SOL went to $88.11 high during the weekend.
Missed the dump because it happened so fast but did hit the long tho 😎.
Last week I said another lowerhigh needed to be made, now the most recent one is $88.11.
I am also long right now btw at $85.18. Target=$87.28-$86 | SL=$84.99
$BTC $SOL $ETH $CRYPTO
Apr 24

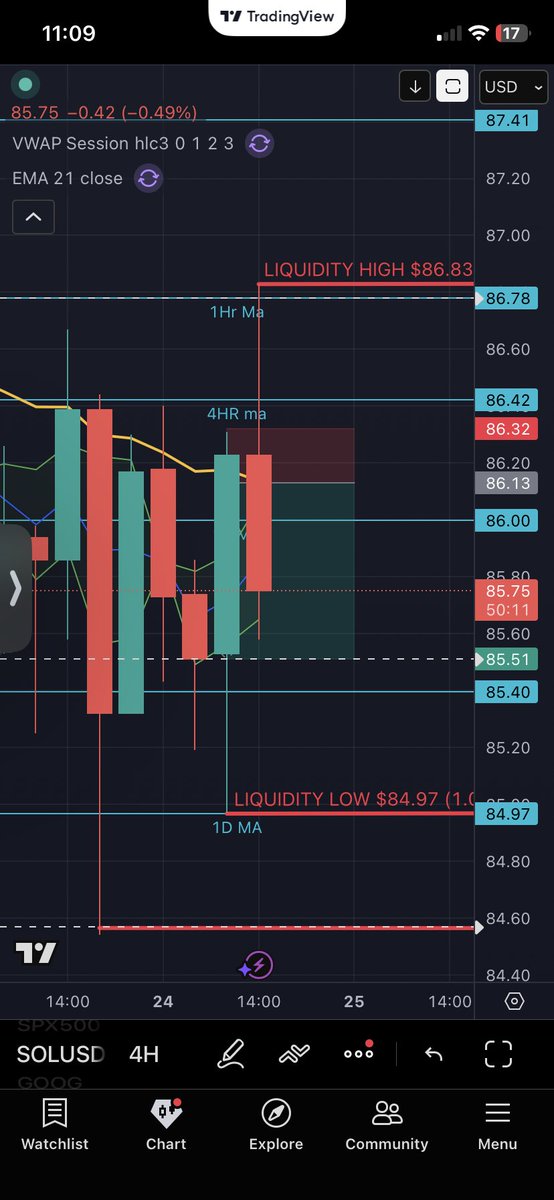
I actually fumbled this trade lmao.
Was too focused on $GOOGL, for some reason when the 4HR candle wicked out & saw $SPY pump to $711 on the range I got scared. 🫠
$SOL moves so violently off small moves from $SPY. Hope you guys held though.
Some psychology here, always do what you say you’re gonna do with conviction.
Also don’t multi task trade lol.
It’s not a loss but could have made more.
$SOL $89 might still be otw though. We need another lower high.
$SOL $BTC $ETH

1
1
5
126

Apr 26
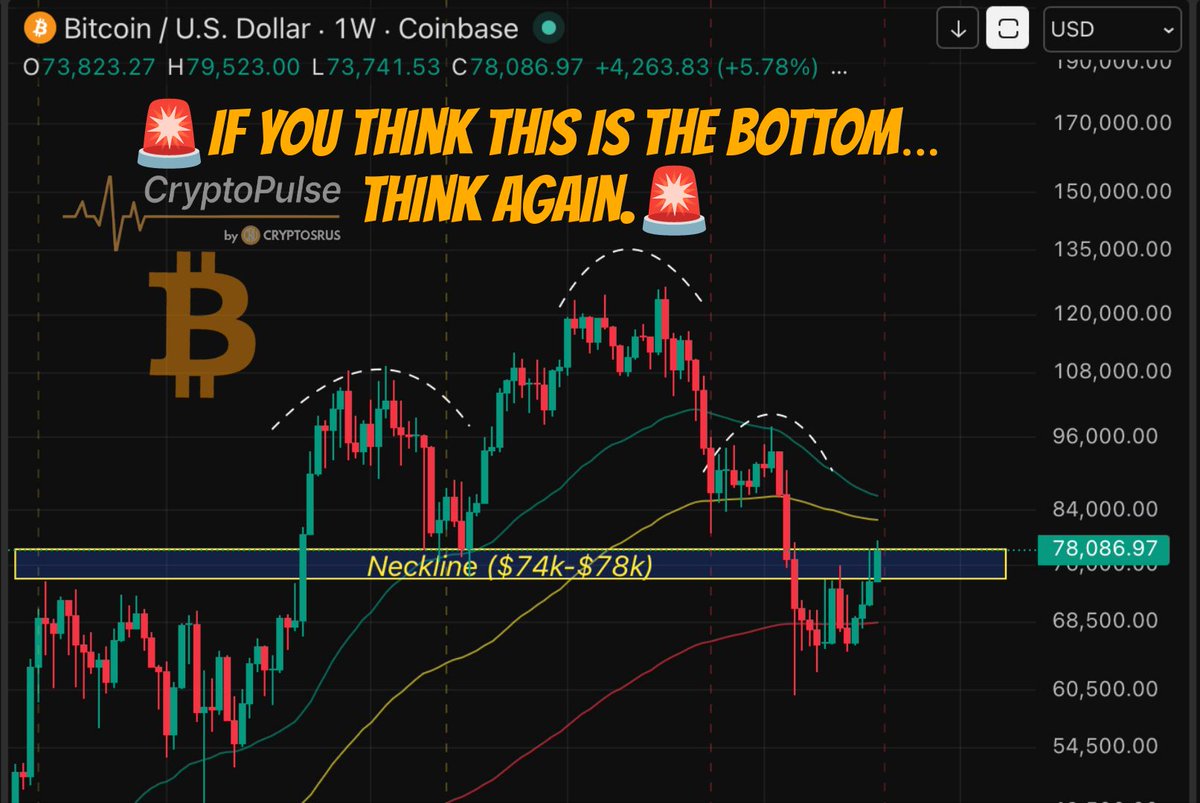
This is where traders get destroyed.
On the weekly, a clear Head & Shoulders already broke down and now it’s retesting.
Retests move up before dropping—but retail thinks it’s the bottom.
BTC is stuck between the 100 and 200 Moving Average, coming from above—classic redistribution before distribution.
RSI is still below 50.
Yet you’re euphoric at $79K. Why?
#BTC #Bitcoin #Crypto #CryptoTrading #TechnicalAnalysis #Bearish #MarketStructure #RSI #MovingAverage #CryptoMarket #TradingView #PriceAction #SmartMoney #CryptoSignals #TraderLife #BearMarket #LowerHigh #LowerLow #CryptoCommunity #RiskManagement
2
1
4
751
Apr 26
Same structure, different year. 2022 or now, it doesn’t matter. As long as BTC keeps printing lower highs and lower lows, the trend is still down.
Yes, 30–40% rallies happen in bear markets. That’s normal.
But people see $79K and lose their minds.
Zoom out. No new bullish structure, no real reversal.
#BTC #Bitcoin #Crypto #CryptoMarket #CryptoTrading #BearMarket #MarketStructure #PriceAction #LowerHigh #LowerLow #TradingPsychology #RiskManagement #CryptoAnalysis #BTCUSDT #SmartMoney $BTC

1
4
698
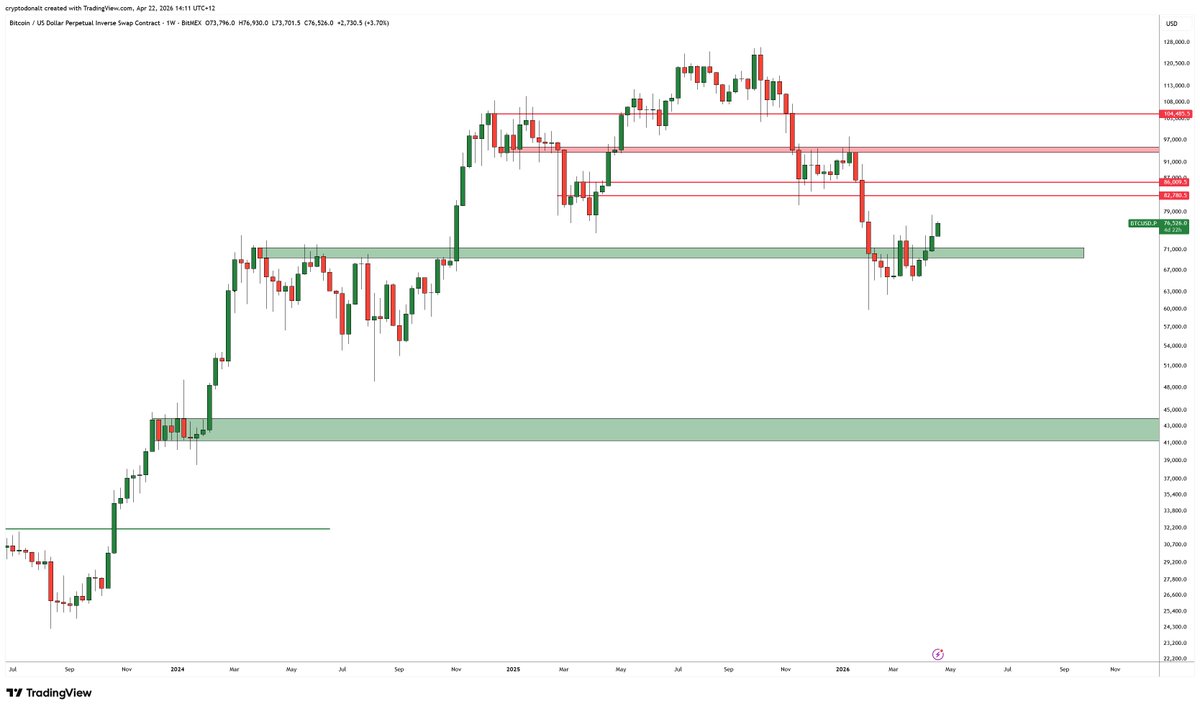
Apr 22
You can disagree as much as you want, textbook LowerHighs and LowerLows say otherwise.
Price doesn't care about our emotions/biases/narratives, I was just replying with a fact and that is any rally that doesn't flip 94/95k area to weekly support is just a new LowerHigh.
1
2
54
Apr 22
GM Don,
I can explain:
Since we topped, on weekly we printed a clear structure of LowerHighs and LowerLows.
Yes, this move has juice in it (rallies happen in a bearmarket as corrections happen in a bullmarket), especially above 76k daily close.
But we don't have yet a flip in the weekly structure as we don't know if we will print the First weekly High (which will be only above 94/95k area) or if this rally will fail anywhere under the previously mentioned area and print the next HTF LowerHigh.
So yes, being bearish here doesn't make sense, since this move has legs it seems, so I'm patiently waiting to see how we react from 80-85k area.
Because if we don't have continuation above it, I will short those rejections since that's the EV move do to in a downtrend.
Happy to debate 🫡
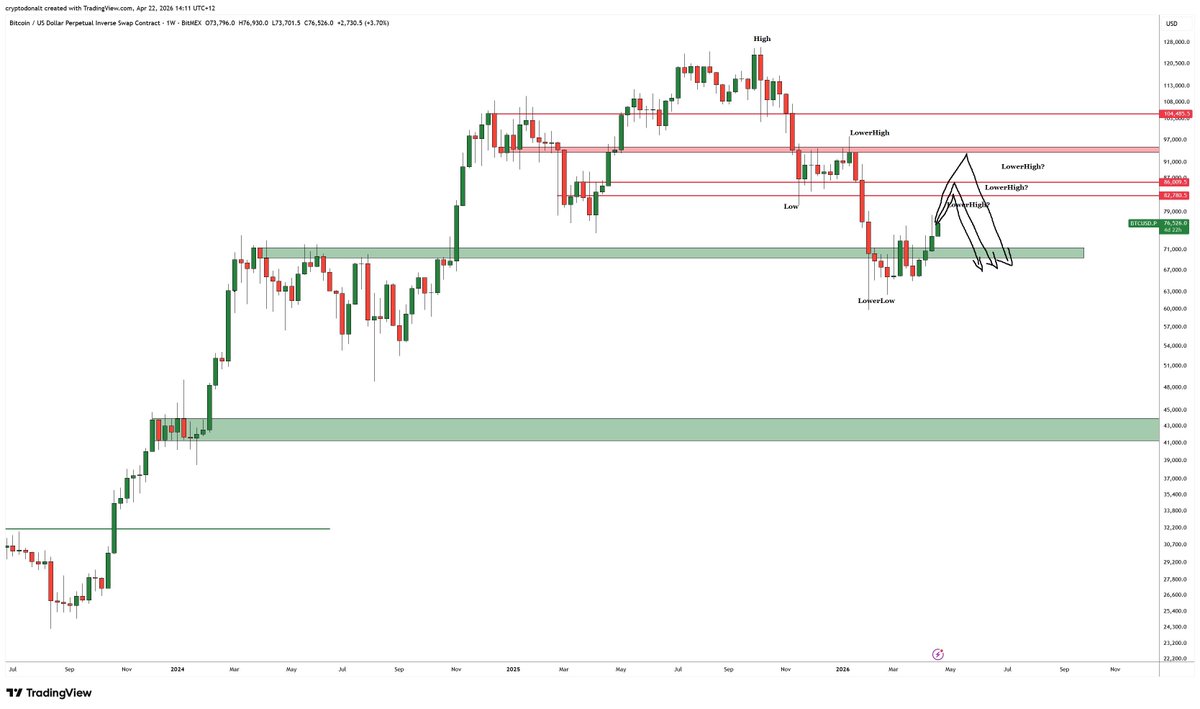

$BTC
I don't see why so many are bearish here based on technicals
You can easily justify being bearish because of geopolitics
But chart wise, really doesn't look bad
I remain cautiously optimistic about BTC price
7
6
85
29,791
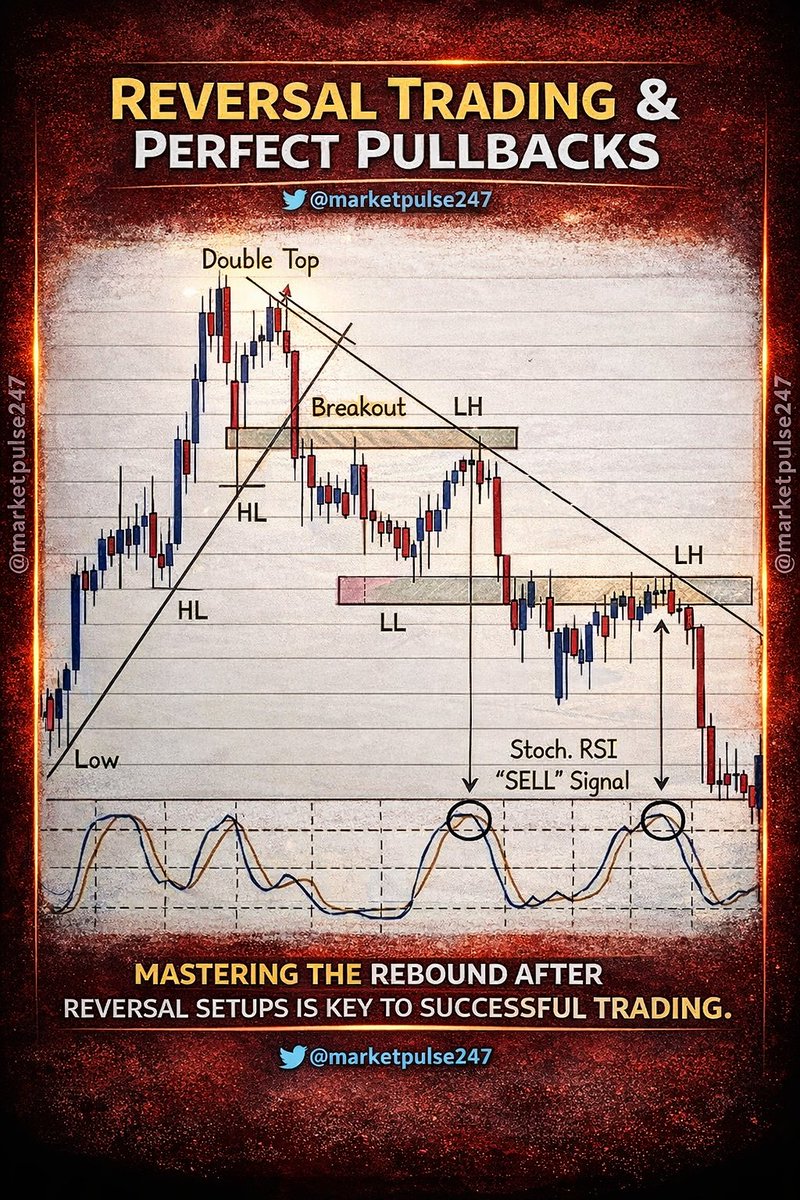
REVERSAL TRADING AND PERFECT PULLBACK STRATEGY EXPLAINED
The market does not move in a straight line. It trends, pauses, reverses, and then continues again. The real skill in trading is not just catching trends but understanding when a trend is about to reverse and how to enter at the right pullback. This is where reversal trading combined with perfect pullbacks becomes a powerful strategy for consistent profits.
1 The journey starts with identifying a strong uptrend. The chart clearly shows higher highs and higher lows, which confirms bullish strength. Many traders get comfortable here and keep buying, but smart traders stay alert. Trends do not last forever, and signs of exhaustion always appear before a reversal.
2 One of the most reliable reversal signals is the double top pattern. This forms when price tests the same resistance level twice but fails to break higher. The second rejection is a warning sign that buyers are losing strength. This is where experienced traders start preparing for a potential trend change instead of blindly buying.
3 After the double top, the price breaks below support. This is known as the breakout, but in this case, it is a breakdown signaling the start of a downtrend. However, entering immediately after the breakdown can be risky because markets often retest the breakout zone.
4 This is where the concept of pullback becomes important. After the breakdown, price often comes back to retest the previous support which now acts as resistance. This area is marked clearly in the chart. Many traders miss this opportunity because they chase the initial move, but professionals wait patiently for this retest.
5 The formation of a lower high confirms that the trend has changed. Earlier the market was making higher highs, but now it fails to reach previous highs. This shift from higher highs to lower highs is a clear indication of bearish control. This is one of the most important confirmations in reversal trading.
6 As the trend continues downward, the market starts forming lower lows. This creates a clear structure of a downtrend. Traders who understand this structure can ride the trend instead of fighting it. The key is to align with the market, not against it.
7 The Stochastic RSI indicator adds another layer of confirmation. When the price pulls back and the indicator shows an overbought condition, it signals a potential sell opportunity. In the chart, the sell signals are clearly marked where the indicator peaks and starts turning downward.
8 Combining price action with indicators increases the probability of success. Price action tells you what is happening, and indicators help confirm it. When both align, the trade becomes stronger and more reliable.
9 Risk management is what separates successful traders from the rest. Even the best setups can fail. Always place a stop loss above the recent lower high when taking a sell trade. This protects your capital and keeps you in the game for the long term.
10 Patience is the real edge in this strategy. Many traders lose money because they rush into trades. Waiting for the perfect pullback, confirmation of lower high, and indicator signal requires discipline, but it significantly improves accuracy.
11 Consistency comes from repeating the same process again and again. Identify the trend, wait for reversal signals, confirm the structure change, and enter on pullbacks. This structured approach removes emotional decision making and builds confidence over time.
12 The beauty of this strategy is its simplicity. You do not need complex indicators or complicated systems. Just understanding market structure, support and resistance, and timing your entry correctly can transform your trading.
CONCLUSION
Reversal trading with perfect pullbacks is not about predicting the market but about reacting to what the market is showing. When you combine chart patterns like double top with structure shifts like lower highs and confirmations from indicators like Stochastic RSI, you create a high probability trading setup. The real power lies in patience, discipline, and execution. Master this approach and you will stop chasing the market and start trading with confidence and clarity.
x.com/Marketpulse247/status/…
#trading #stockmarket #priceaction #reversaltrading #pullbacktrading #technicalanalysis #chartanalysis #tradingstrategy #intradaytrading #swingtrading #stocktrading #marketstructure #lowerhigh #higherlow #doubletop #breakout #breakdown #supportandresistance #stochasticrsi #tradingtips #learntrading #traderlife #marketanalysis #financialmarkets #stockmarketindia #nifty50 #banknifty #equitymarket #tradingcommunity #investing #wealthcreation #moneygrowth #marketinsights #tradingmindset #riskmanagement #patterntrading #markettrends #chartpatterns #tradingjourney #stockanalysis #tradingknowledge #technicaltrading #daytrading #scalping #marketpsychology #smarttrading #pricepatterns #marketlearning #tradingrules

REVERSAL TRADING AND PERFECT PULLBACK STRATEGY EXPLAINED
The market does not move in a straight line. It trends, pauses, reverses, and then continues again. The real skill in trading is not just catching trends but understanding when a trend is about to reverse and how to enter at the right pullback. This is where reversal trading combined with perfect pullbacks becomes a powerful strategy for consistent profits.
1 The journey starts with identifying a strong uptrend. The chart clearly shows higher highs and higher lows, which confirms bullish strength. Many traders get comfortable here and keep buying, but smart traders stay alert. Trends do not last forever, and signs of exhaustion always appear before a reversal.
2 One of the most reliable reversal signals is the double top pattern. This forms when price tests the same resistance level twice but fails to break higher. The second rejection is a warning sign that buyers are losing strength. This is where experienced traders start preparing for a potential trend change instead of blindly buying.
3 After the double top, the price breaks below support. This is known as the breakout, but in this case, it is a breakdown signaling the start of a downtrend. However, entering immediately after the breakdown can be risky because markets often retest the breakout zone.
4 This is where the concept of pullback becomes important. After the breakdown, price often comes back to retest the previous support which now acts as resistance. This area is marked clearly in the chart. Many traders miss this opportunity because they chase the initial move, but professionals wait patiently for this retest.
5 The formation of a lower high confirms that the trend has changed. Earlier the market was making higher highs, but now it fails to reach previous highs. This shift from higher highs to lower highs is a clear indication of bearish control. This is one of the most important confirmations in reversal trading.
6 As the trend continues downward, the market starts forming lower lows. This creates a clear structure of a downtrend. Traders who understand this structure can ride the trend instead of fighting it. The key is to align with the market, not against it.
7 The Stochastic RSI indicator adds another layer of confirmation. When the price pulls back and the indicator shows an overbought condition, it signals a potential sell opportunity. In the chart, the sell signals are clearly marked where the indicator peaks and starts turning downward.
8 Combining price action with indicators increases the probability of success. Price action tells you what is happening, and indicators help confirm it. When both align, the trade becomes stronger and more reliable.
9 Risk management is what separates successful traders from the rest. Even the best setups can fail. Always place a stop loss above the recent lower high when taking a sell trade. This protects your capital and keeps you in the game for the long term.
10 Patience is the real edge in this strategy. Many traders lose money because they rush into trades. Waiting for the perfect pullback, confirmation of lower high, and indicator signal requires discipline, but it significantly improves accuracy.
11 Consistency comes from repeating the same process again and again. Identify the trend, wait for reversal signals, confirm the structure change, and enter on pullbacks. This structured approach removes emotional decision making and builds confidence over time.
12 The beauty of this strategy is its simplicity. You do not need complex indicators or complicated systems. Just understanding market structure, support and resistance, and timing your entry correctly can transform your trading.
CONCLUSION
Reversal trading with perfect pullbacks is not about predicting the market but about reacting to what the market is showing. When you combine chart patterns like double top with structure shifts like lower highs and confirmations from indicators like Stochastic RSI, you create a high probability trading setup. The real power lies in patience, discipline, and execution. Master this approach and you will stop chasing the market and start trading with confidence and clarity.
#trading #stockmarket #priceaction #reversaltrading #pullbacktrading #technicalanalysis #chartanalysis #tradingstrategy #intradaytrading #swingtrading #stocktrading #marketstructure #lowerhigh #higherlow #doubletop #breakout #breakdown #supportandresistance #stochasticrsi #tradingtips #learntrading #traderlife #marketanalysis #financialmarkets #stockmarketindia #nifty50 #banknifty #equitymarket #tradingcommunity #investing #wealthcreation #moneygrowth #marketinsights #tradingmindset #riskmanagement #patterntrading #markettrends #chartpatterns #tradingjourney #stockanalysis #tradingknowledge #technicaltrading #daytrading #scalping #marketpsychology #smarttrading #pricepatterns #marketlearning #tradingrules
3
4
160

Apr 9
2
164
Apr 9
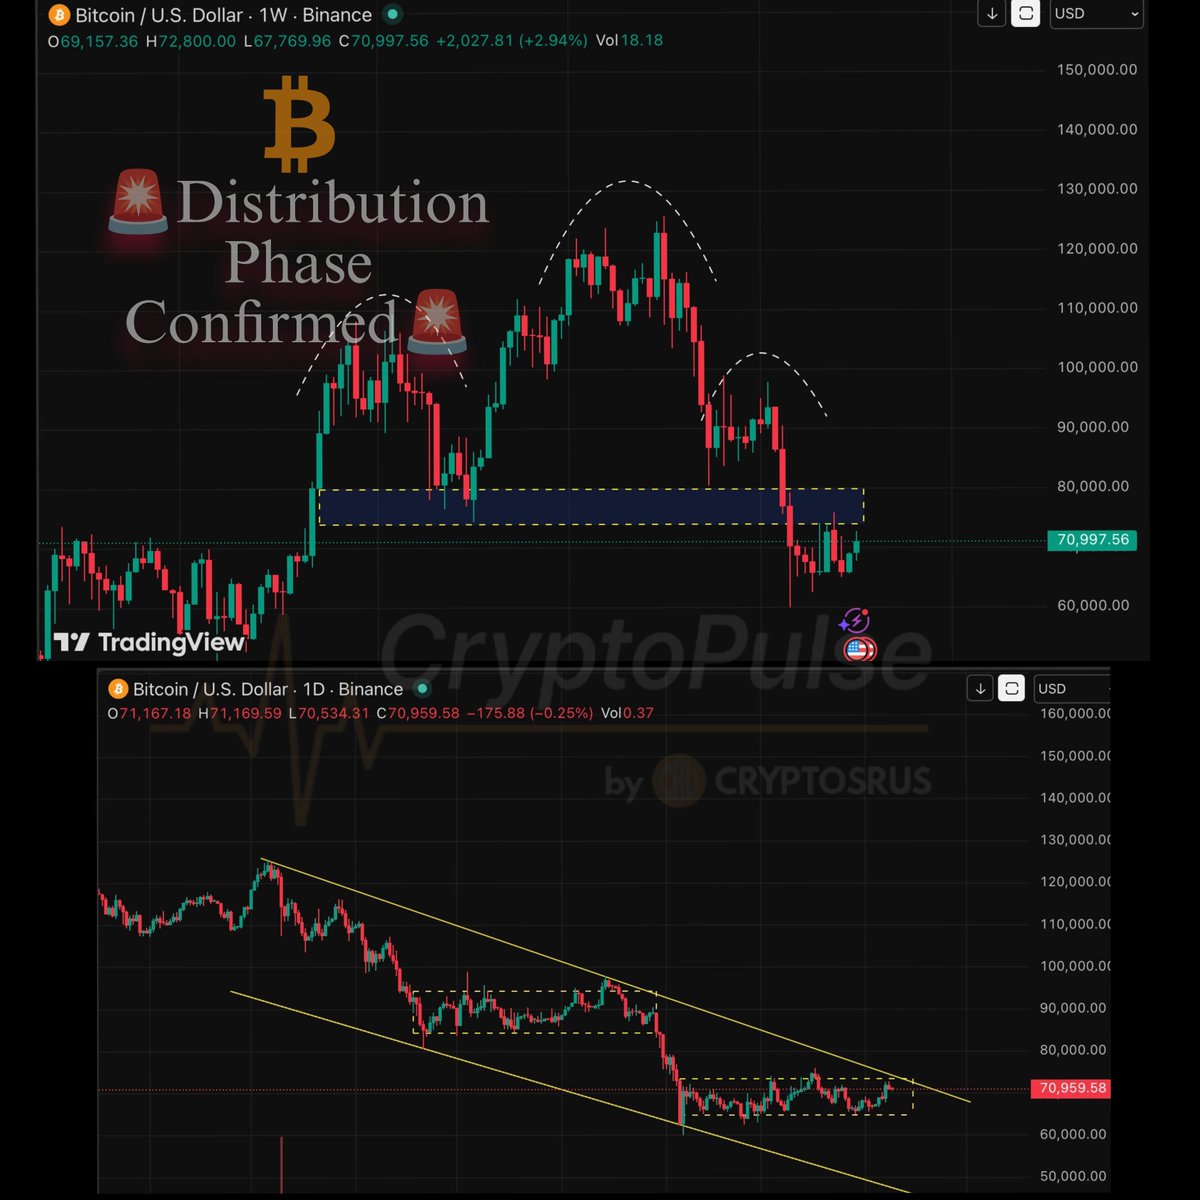
$BTC isn’t done dropping — you’re early, not smart.
Weekly shows a clear Head & Shoulders → trend shifting bearish.
Daily confirms it: lower highs, lower lows.
This isn’t the bottom.
Price likely goes lower. Wait for a new bullish structure before you start to accumulating again.
#Bitcoin #BTC #Crypto #CryptoTrading #CryptoMarket #TechnicalAnalysis #Bearish #TradingView #PriceAction #SmartMoney #MarketStructure #LowerHigh #LowerLow #HeadAndShoulders #CryptoSignals
1
3
596

Apr 8
After H12 sweep close is your entry on the market structure shift on the 1H? Yes
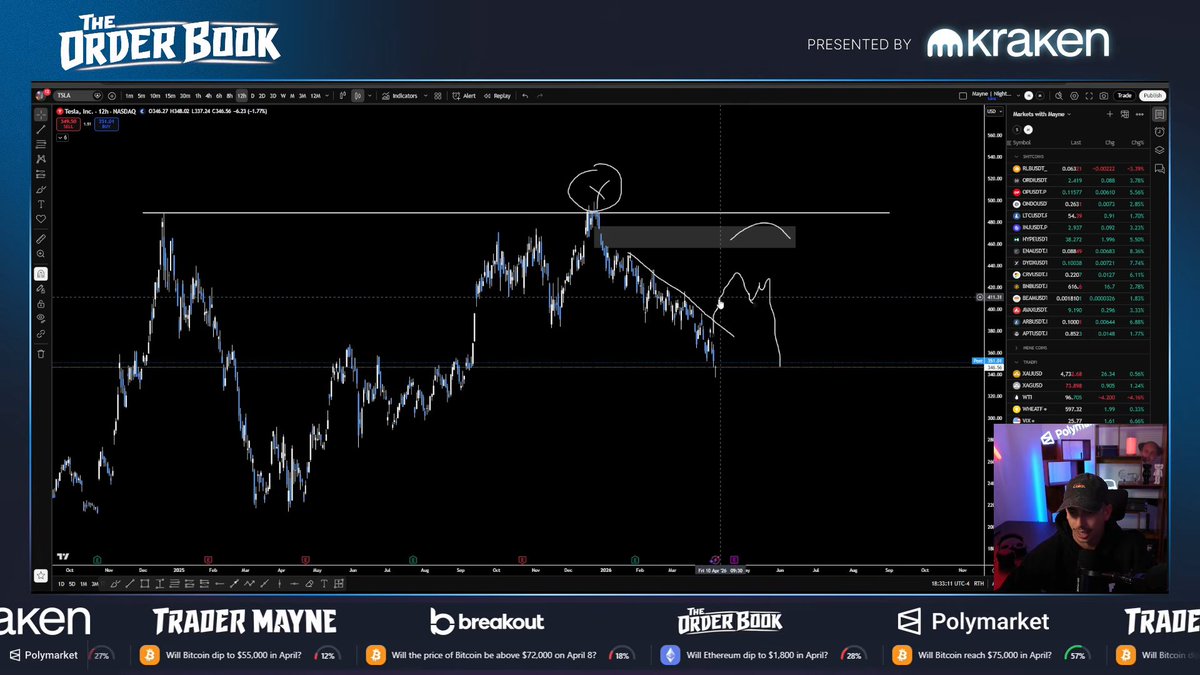
TSLA we talked about shorting the rally, looking for a lowerhigh, still waiting for it
Remember, anytime i criticize these gurus on twitter saying they are retarded... i am one of those retards as well
1
2
56