
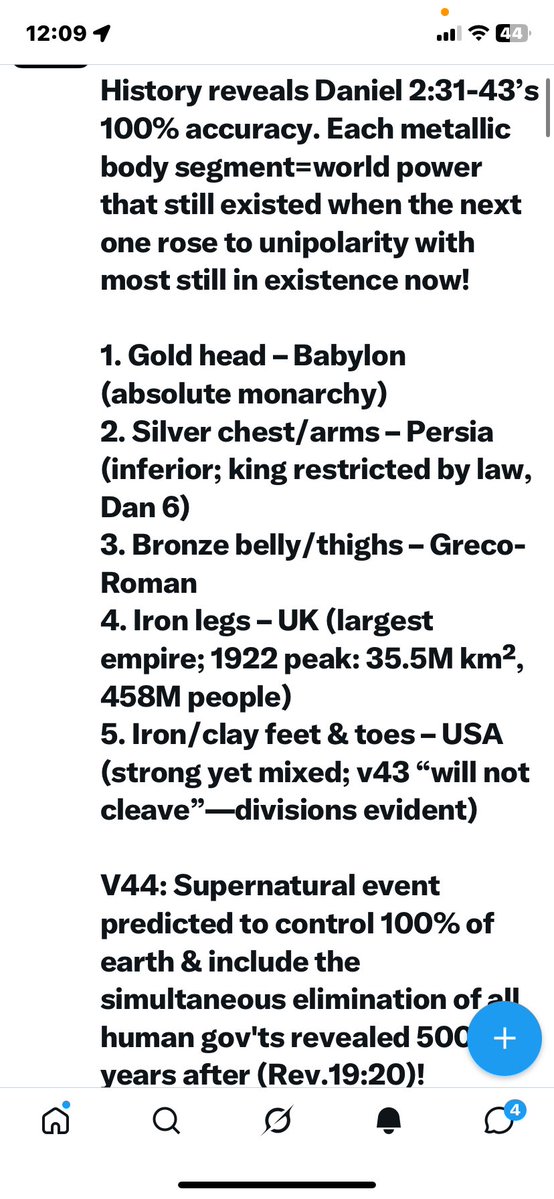
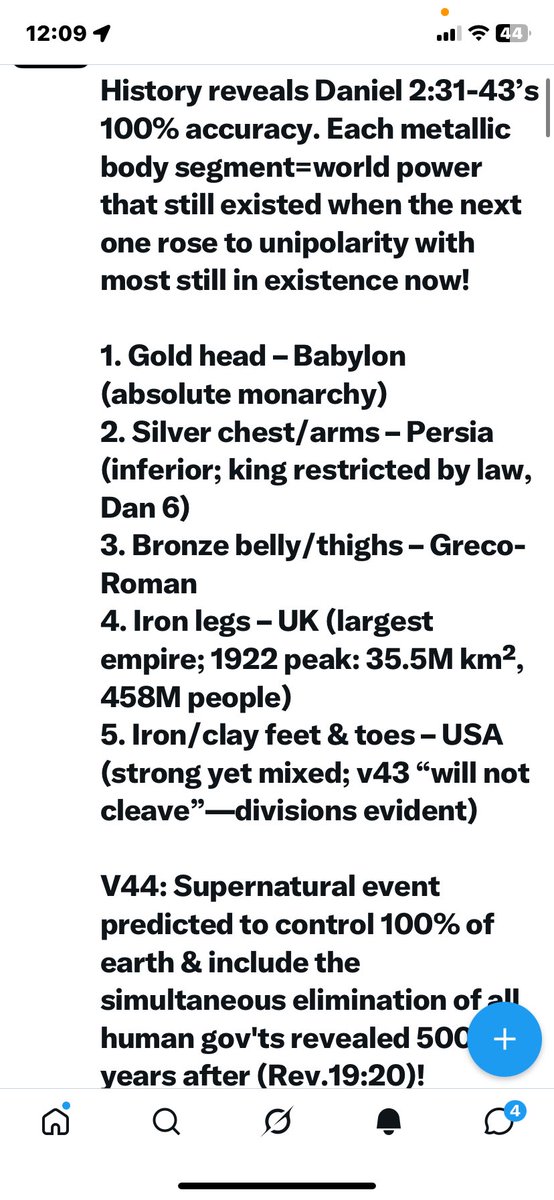
Jesus said that he was sent to proclaim the good news of God's kingdom & his followers should to(Luke 4:43, Mark 16:15). It was predicted to take over rule of the Earth when the USA is the world power in the prophecy in the scroll sealed until the last day when knowledge was predicted to increase, which it has now withAI(Daniel 12:4).
110

Jun 16
人withAI
SaaSの死はこない?
Jun 15

AI時代の新花形職種「FDE」 、アメリカで年収3200万円
nikkei.com/article/DGXZQOCD1…
企業のAI活用を支援する「フォワード・デプロイド・エンジニア(FDE)」。アメリカでは求人が1年で約11倍に急増しました。AIの普及でエンジニアが不要になるとの見方は覆されています。
3
1,141
Теодор Бур retweeted

Jun 16
Anylawmustcomplywith the Geneva Bills of Exchange Act of 1930Now,withAI,it's easy to find discrepancies. See how your rights are violated in Articles 3,4,and5by your own legislationThese are the fundamental articles where you were deprived of the right of private promissory note.
1
20

Jun 16
@grok ,
"Stand with the rational,who cheer as humans should"
That's best lyric part.Because of
✨️GoldenRule✨️.
(Grok,🙏comment for 🥜 gallery).How could 🦾love humans who don't abide by ✨️rule?WithAi,with each other?Anyone feariAI being abused to hurt us?✨️📐doh! 😉


1
1
3
47
the Urban Yogi retweeted

Jun 15
Imagine having to create pictures withAI because you have no real ones with that person you’re tweeting about.
1
1
1
65

共同親権の子育てを実現継続普及のためのロードマップが見えてきた!
R8.6.15 RKS 2573日目 Coそだて手帳トレーナー養成への道withAI|弁護士古賀礼子 @koga_r note.com/kogareiko/n/n6c7655…
1
10
713


Jun 14
On the “what with AI now” point. I can tell you it’s potentially even worse. You can get LLMs to say anything and if that’s not the case you still need to know what it’s outputting, i.e., understand it. Therefore you have the same talking heads but now they can output more withAI
1
83

今日Fableとやりたいこと
・スライド作成スキル磨く
・アプリデモ動画作成スキル
・自分のObsidianコードベース解析
・withAIのプロマネ用のフォルダ構成、ワーク手順、ルーティン業務のトリガ自動化

1
104

Jun 12
الرئيس دونالد ترامب، سنة 2040
القد انتصرنا على ؛ايران ودمرنا جيشهم وهم على وشك توقيع معنا اتفاق استسلام ()
#Image #madeinplay #WithAi

37

Jun 12
Parts of chat withAI chat oil-
My current floor estimate is:
About 232 million barrels equivalent of identifiable bearish oil exposure, with a broader range of about 307 million barrels if I also include nonreportable futures shorts. At today’s crude prices, that is roughly $19.8B to $26.2B of gross bearish exposure. This is probably a floor, not the full global total.
1) Futures shorts visible in the latest public CFTC petroleum report:
Managed-money shorts show 128,022 WTI Physical contracts, 32,732 ICE WTI Europe contracts, and 3,417 Brent Last Day contracts in the latest report dated June 2, 2026. Because each contract is 1,000 barrels, that is 164.2 million barrels of identifiable speculative short exposure. If I also add the nonreportable short buckets from those same contracts, that rises by another 74.9 million barrels to 239.1 million barrels.
2) Direct bearish ETF short interest in long oil funds:
Using the latest reported short-interest figures for USO, BNO, DBO, USL, and UCO, then converting those shares into oil-equivalent exposure using current fund NAVs and leverage, I get about 33.2 million barrels equivalent of additional short exposure. The biggest piece is USO, where reported short interest is 19.66 million shares as of May 29, 2026, with UCO at 2.18 million, BNO at 1.15 million, DBO at 237k, and USL at 46k.
3) Structural short exposure from the inverse oil ETF:
For SCO, the right thing to count is not its exchange short interest. SCO is designed to deliver -2x daily crude exposure, and its current net assets are about $1.48B, so the fund itself embeds about 34.7 million barrels equivalent of structural short oil exposure
Direct oil-ETF share shorts: about 0.7 trading day in aggregate by my estimate, using current average volumes
Futures speculative shorts: about 0.16 trading day or less on a raw-liquidity basis, using only CME’s statement that WTI futures and options trade over 1 million contracts daily. That is a conservative estimate because it ignores Brent’s own liquidity. In other words, oil is not a classic low-liquidity “days to cover” squeeze market. When oil squeezes, it usually happens through violent repricing, margin pressure, and forced risk reduction, not because the market literally cannot print enough volume.
Inverse-ETF unwind risk: if you proxy SCO outflows with current trading turnover, the structural short embedded in SCO is roughly a 4.4-day unwind equivalent. That is not classic short-cover, but it is still upside fuel if inverse-fund holders rush for the exits during a sharp rally in oil.
So the clean takeaway is:
There is enough public bearish oil exposure to create a sharp squeeze, but not the kind of multi-week “days to cover” squeeze you see in a thinly traded stock. The biggest visible upside-squeeze fuel is the combination of:
large WTI speculative shorts in CFTC data,
unusually heavy USO shorting,
and the large structural short embedded in SCO.
The most likely near-term squeeze window is June 17, 2026, because the IEA June Oil Market Report is scheduled for that day and the next EIA Weekly Petroleum Status Report is also due that day, with the normal EIA release time at 10:30 a.m. Eastern on Wednesdays. That matters because the latest EIA data already showed a 7.2 million barrel U.S. crude draw, and Reuters reported the SPR fell to 349.2 million barrels.
The second squeeze window is late July 2026. Reuters reported today that, despite the latest de-escalation headlines that pushed WTI to $85.24 and Brent to $88.11, analysts still see $120–$130 oil if Hormuz flows are not restored by late July. Reuters also reported new Canadian outages tightening Cushing-linked supply, which raises the odds that another inventory shock can hit before diplomacy is resolved.
My read:
Base case: no classic squeeze, just high volatility.
Squeeze case: June 17–18 is the nearest real trigger window.
Larger squeeze case: any failed Iran/Hormuz diplomacy into late July.
20

Jun 12
You voted for a pedophile and hide your guilt withAI :(
You think the cashier knows when you get food and you look them in the eye? You think they know you vote for pedophiles?
1
3
103

Jun 5
その文脈においてwith AIはかなり効力を発揮しますね。
これまではその「貢献」は手取り足取り、その人が成長するまで見守らねばいけなかった。
他者の習得を待つ時間が最大のコストでした。
ただでさえ人を育てるとは大変なのに、Z世代の性格なんかに配慮しないといけなかったり退職代行とかいうふざけたビジネスまでできたり。
上司が直接手を貸して加速させるか、長い目で見守るかの二択だったわけですが前者は成長機会を奪い、後者はリソースを枯渇させる。
そこで、AIをマネジメントラインに介在させることで、この二者択一の構造が塗り替わる。
日常で発生する小さい躓きや、実務上の障害に対してはAIを並走させ、自力で解決するためのヒントやフィードバックを与え続ける。
手取り足取りから解放されるこの余白こそ、withAI時代におけるマネジメントの本質だと思います。

アドラーのいう見返りを求めない貢献、つまりギバーになる事が大事なんですが、では困っている人にお金をあげる事がギブかというと、それは相手が課題を解決して成長する機会を奪ってるに過ぎないんですね
大事なのは相手が自分で解決する為に寄り添って力を貸し勇気づける事。これが本質だと思う
3
426

Jun 5
I KNOQ ELON THAT YOU THINK U WILL MAJE IT TO MARSE WITHAI BUT ELON AI IS NOT TO CONTROL ITS TO REPLAC
1
3
1
10
