The CFO asks: Why is cash tight yet the finance dashboard looks clean?
Revenue is up; Margins seem fine, and yet cash is still a problem.
That’s when dashboards get blamed.
But dashboards explain what’s happening.
They don’t show how the business actually runs.
Cash flow issues often live outside the charts:
Misaligned payment terms
Operational costs trailing growth
Receivables aging while revenue looks healthy
Have you seen dashboards blamed for problems they weren’t meant to solve?
#DataAnalytics #FinanceLeadership #CashFlow #BusinessReality #AnalyticsLife #DecisionMaking

2
38

You haven’t lived until you’ve traced one error for 2 hours and it was a missing comma.
#dataanalytics #analyticslife #datalife #analystlife #dataproblems #debugging #sqllife #exceltips #datatwitter #techlife
2
39

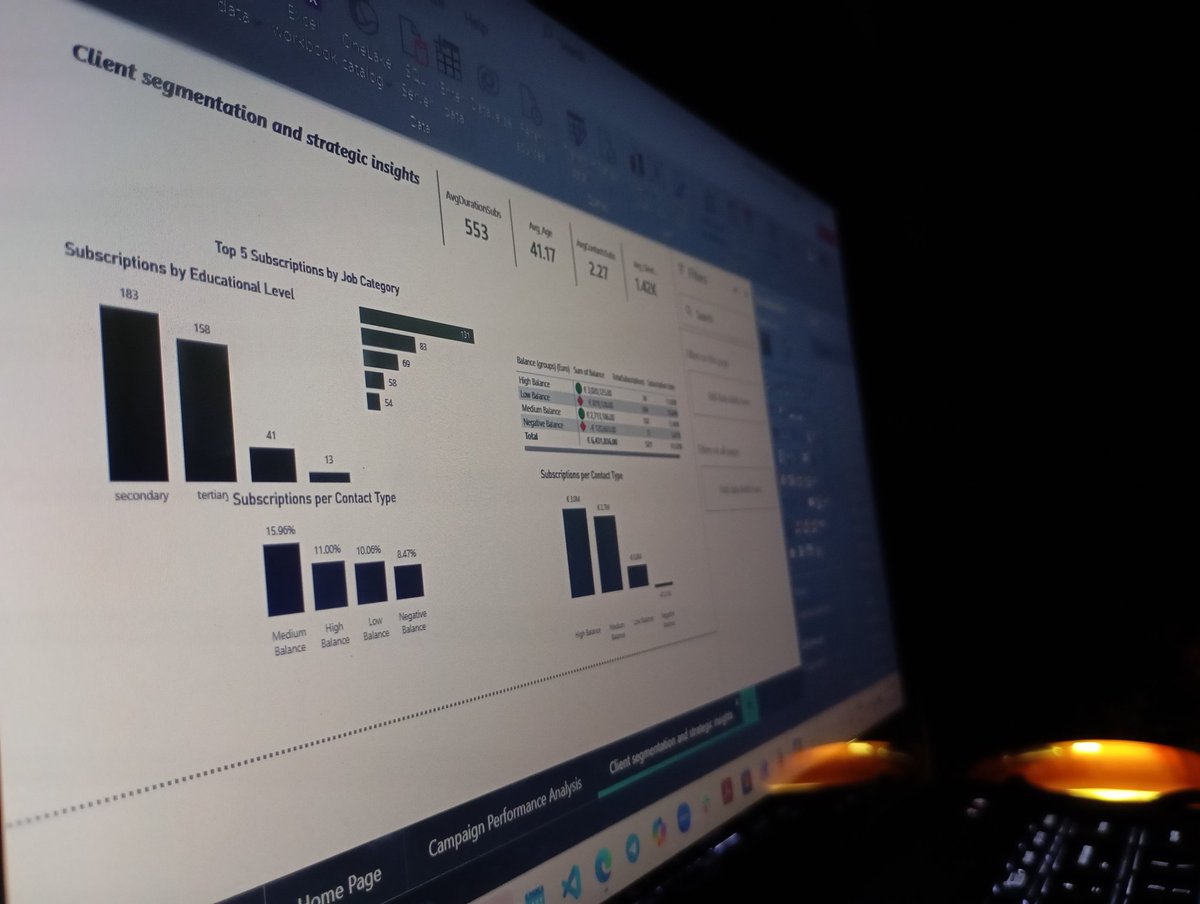
11:38 PM on a Saturday 😶
Rebuilding a Bank Marketing dashboard I built almost 2 years ago… 😊😑
We go again tomorrow.💪
Bedtime....
#DataAnalytics #DataAnalyst #DashboardDesign #PowerBI #AnalyticsLife
3
2
23
471

Curiosity is your superpower.
Ask.
Question.
Dig.
Data doesn’t lie — it waits.
For you to see what everyone else misses. ⚡
#DataMindset #AnalyticsLife
5
315
💡 Data tells stories — if you know how to read it.
Every chart, every number, every trend is a clue waiting to unlock smarter decisions. 📊✨
Stop guessing. Start analyzing.
#DataAnalysis #Insights #DecisionMaking #AnalyticsLife
1
3
66

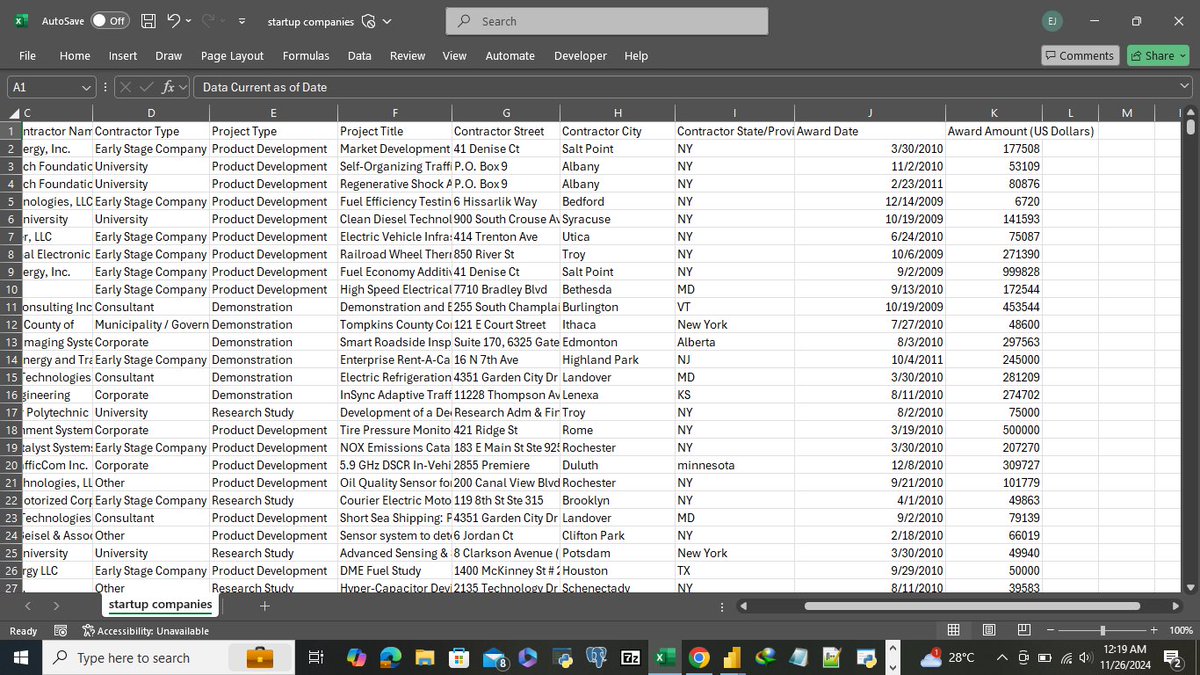
18 Dec 2025
Ever wonder what 𝗱𝗮𝘁𝗮 𝗮𝗻𝗮𝗹𝘆𝘀𝘁𝘀 actually do all day?
Behind every smart move, data is doing the work. 📊
ANALYTICS TRAINING IN BANGALORE
✔️ skillfloor.com/analytics-tra…
#DataAnalyst #DataAnalytics #LifeOfADataAnalyst #DataCareers #AnalyticsLife #Skillfloor
3
19

22 Nov 2025
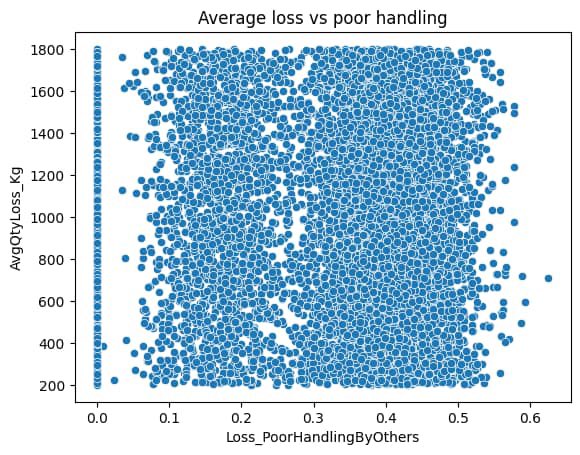
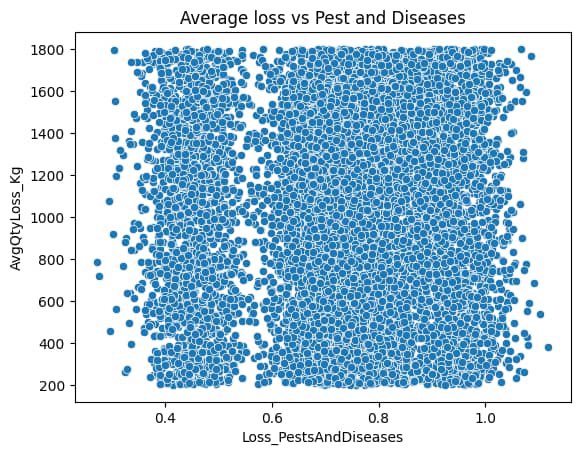
EDA with Pandas is a rollercoaster, smooth one minute, chaotic the next.
Still, nothing beats the satisfaction of uncovering patterns in messy data.
This is why analytics feels like magic.
#DataAnalytics #Pandas #Python #EDA #DataScience #AnalyticsLife #CodeLife
2
67

9 Oct 2025
Data cleaning is honestly the hardest part of data analysis. It teaches patience, You’ll pause your music, stare at the screen, and question your life choices😅📊
#AnalyticsLife #DataAnalysis
#datafam
2
3
53

11 Sep 2025
Just another day diving into the world of data! 📊 Loving the challenges and insights it brings. What keeps you motivated in analytics? #DataAnalyst #AnalyticsLife #DataInsights #SQL
2
61

13 Jun 2025
Had a group challenge @Webfalainitiat1 movies dataset using Pandas in Python
#DataScience #PythonProject #MoviesData #PandasPython #DataAnalysis #WomenInTech #PythonForDataScience #TechTok #LearningPython #DataAnalytics #DataVisualization #MiniProject #AnalyticsLife
2
4
279

30 May 2025
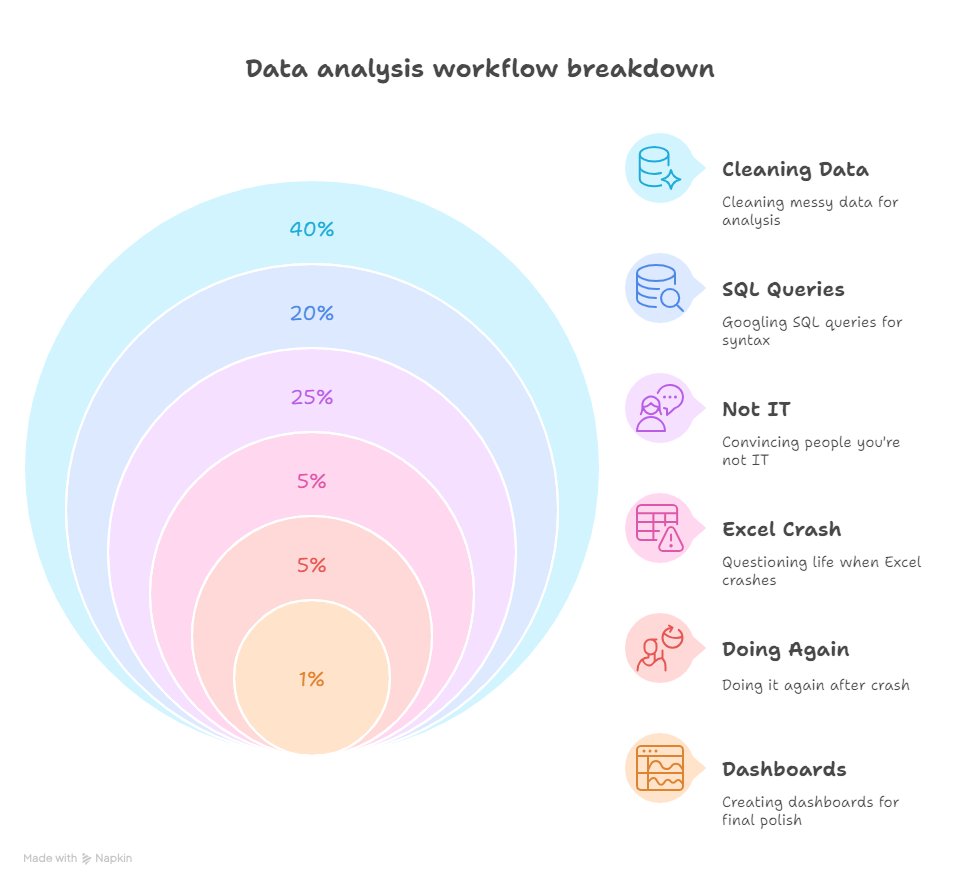
The real work is sometimes not dashboards.
It’s:
Figuring out what data even means
Explaining “no, I can’t just filter that”
Cleaning rows for hours just to make one table join
Let’s normalize showing the messy middle of data work.
#DataTwitter #PowerQuery #AnalyticsLife
3
49

21 May 2025
Being a data analyst isn’t always flashy - it’s cleaning data, fixing SQL, and tweaking visuals.
But consistency? That’s where the real growth happens.
Every day counts.
#DataAnalyst #Consistency #AnalyticsLife #PowerBI #SQL
1
11
216

19 May 2025
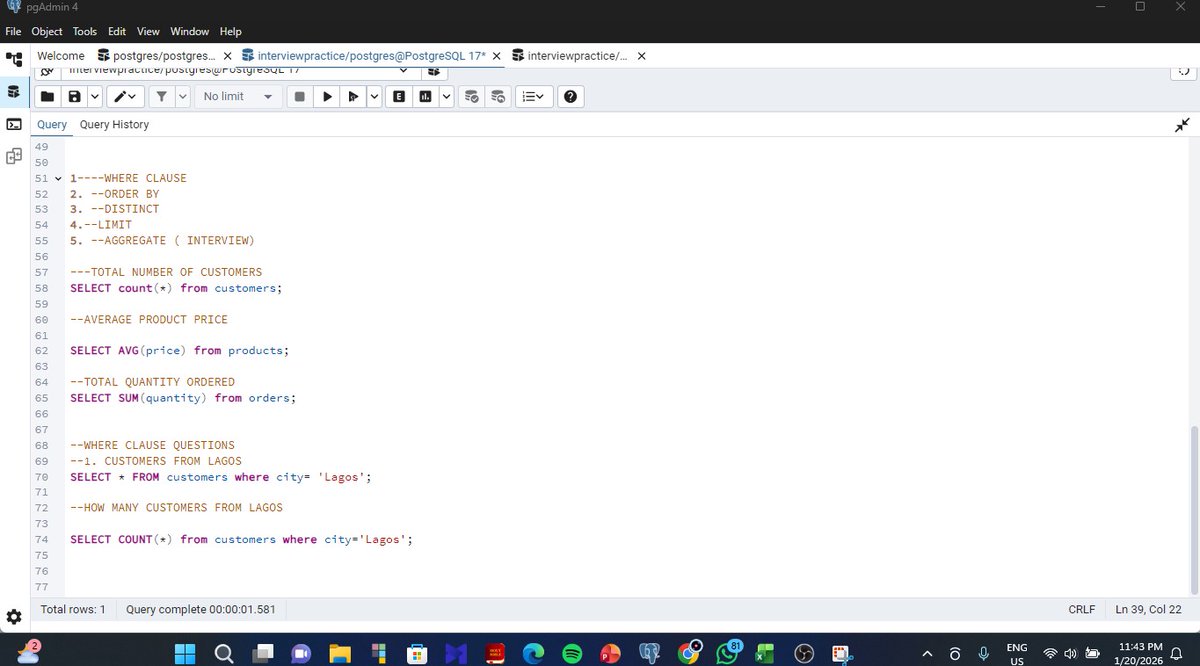
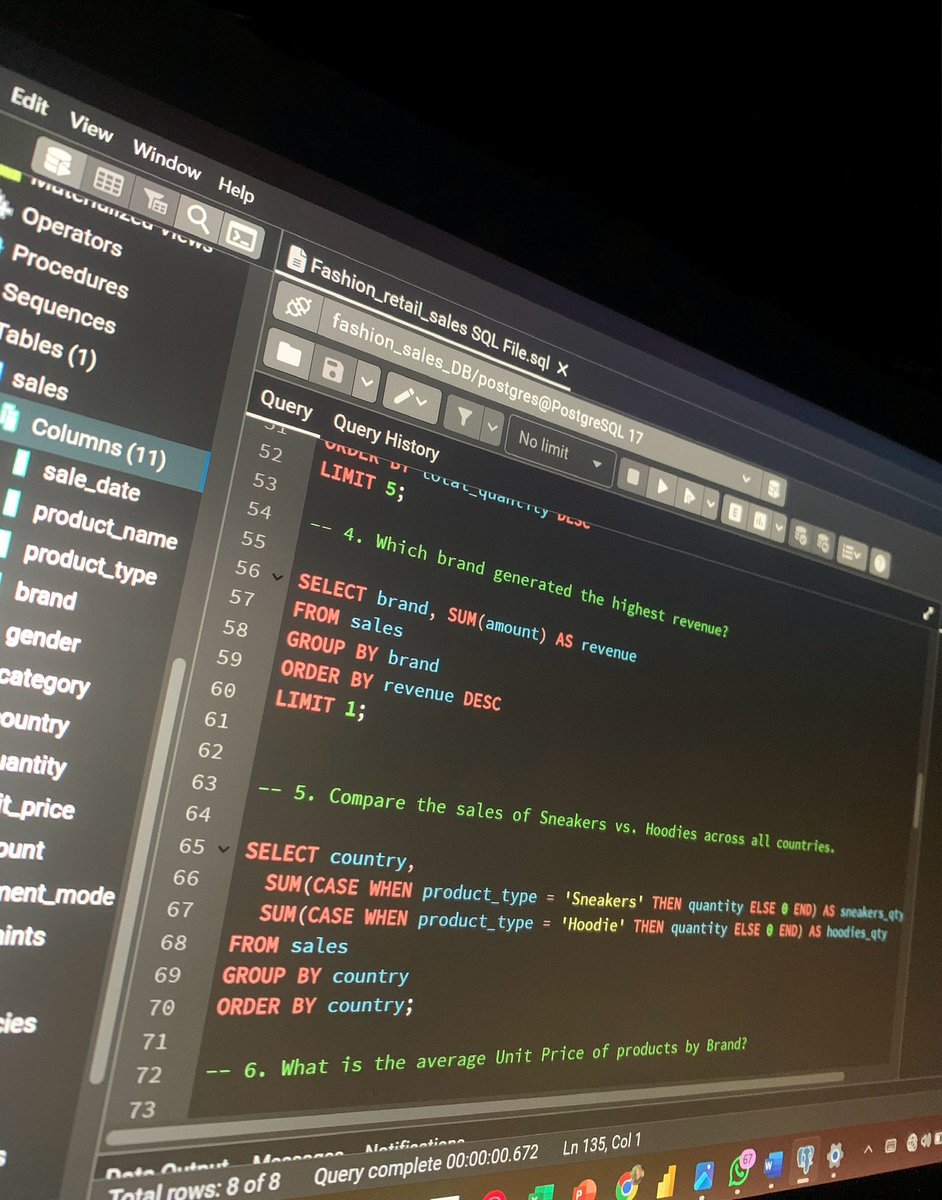
What Working in Data Analytics Actually Looks Like
#DataAnalytics
#DataScience
#AnalyticsLife
#DataCleaning
#SQLQueries
#DashboardDesign
1
2
61

14 Mar 2025
Unlock Wisdom with InsightMania.com 🧠🌟 Great for data, analytics, or knowledge hubs. #InsightManiaForSale #DomainForSale #DataInsights #AnalyticsPower #KnowledgeBase #DataDriven #AnalyticsLife #InsightHub #SmartKnowledge
2
91

3 Jan 2025
Every expert was once a beginner. Keep learning, stay curious, and trust the process. You’ve got this. 💪
#DataCommunity #AnalyticsLife #TechCommunity #CodeNewbie #LearnDataScience #CodingForBeginners #DataScienceJourney #PythonForBeginners #DataNerd #TechNewbie

1
2
94

10 Dec 2024
A Day in the Life of a Data Analyst
#DayInTheLife #DataAnalyst #LifeOfAnAnalyst #DataDriven #SkillUpAcademy #DataStorytelling #CareerInAnalytics #TechCareers #LearnDataAnalytics #SQL #PythonForData #DataVisualization #AnalyticsLife
3
14

26 Nov 2024
I'm definitely not the only data analyst who analyzes the dataset in my head before even cleaning it.
#DataAnalytics
#analyticsLife
#dataanalystLife
2
64

20 Sep 2024
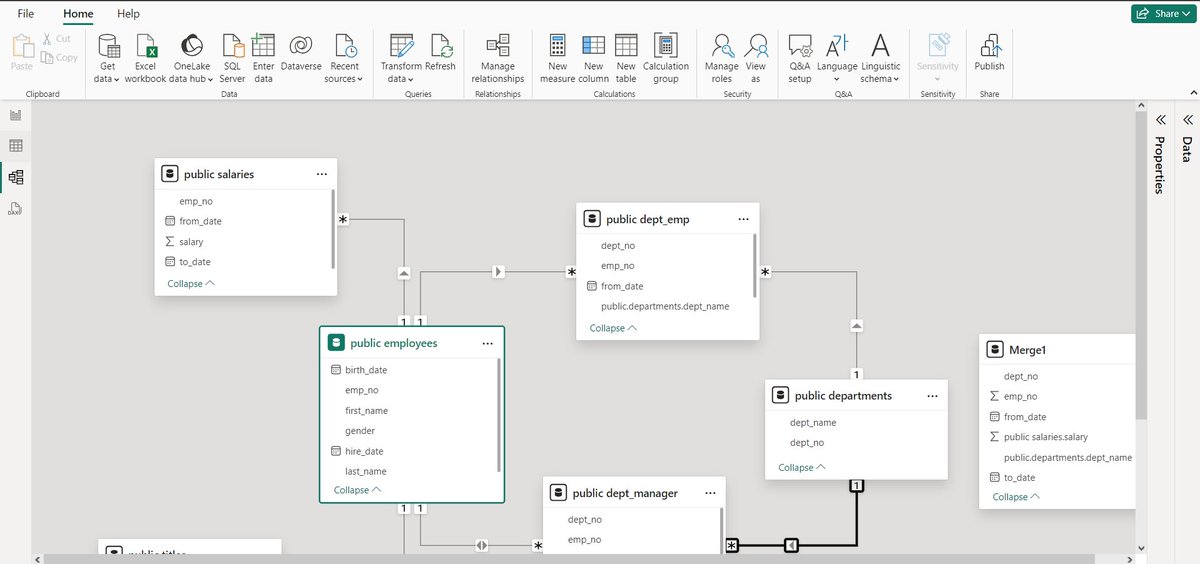
Today, in our Power BI Series, Let's discuss about various kinds of views that are available to you.
As a data analyst, you should be aware about them to use them effectively to perform operations on data, understand relationship among tables and to generate effective visualizations.
So, We have 3 different views available in Power BI and these are:
1) Report View
2)Table View
3) Model View
Now, Let's discuss each one of them.
1) Report View: So, as the name suggests, this view allows you to create reports and in simple terms, here you can create visuals, apply filters and can create measures as well. You can select among various visuals including bar chart, column chart, funnel chart, treemap, cards and a lot more. Also, now you will se a Microsoft Copilot icon which will allow you to use benefits of co-pilot in your Power BI desktop to create reports and dashboards.
2) Table View: It allows you to access all your tables that are available in your database (if you connect via DBMS such as MySQL or PostgreSQL). Here, you can create new columns, measures and much more. You can also use DAX formulas here to create new columns and measures. The main difference between Table View and Power Query is that, Table views shows you the data that is currently present in your model while in Power Query, you need to apply the changes selecting the option "Close and Apply" or "Apply", then the model gets updated.
3) Model View: This view shows you the relationship among different tables and with which relationship they are connected (one-one, one-many and more). Here, you can see which column is used as a link between two tables, you can alter the relationship between them and more. Also, as a data analyst, you should be cautious to modify the relationship, specially "Cross Filter direction" as it can create a lot of errors if they are not used correctly.
#PowerBI #PowerBIViews #ReportView #TableView #ModelView #BusinessIntelligence #DataVisualization #DataModeling #DAX #DataTransformation #DataOperations #DatabaseManagement #PowerQuery #DataRelationships #TechSolutions #BIExpert #DataAnalysis #DigitalTransformation #AnalyticsLife #DataAnalystTips #TechUS #TechUK #TechEurope #BusinessDecisions #PowerBIDesktop #DataIntegration #DataEfficiency #BigData #USBusiness #UKBusiness #EuropeTech
10
697