
Jun 11
If you've struggled with adding conditional formatting to large datasets in enterprise WPF applications, ComponentOne's WPF Rules Manager is the solution you've been looking for.
Try it out to simplify your code and improve your application's performance. Here's how: sbee.link/9ykjhedg8u
#DotNet #WPF #DataGrids #ConditionalFormatting #Runtime #RulesManager #UI #DeveloperTools #SoftwareDevelopers

24

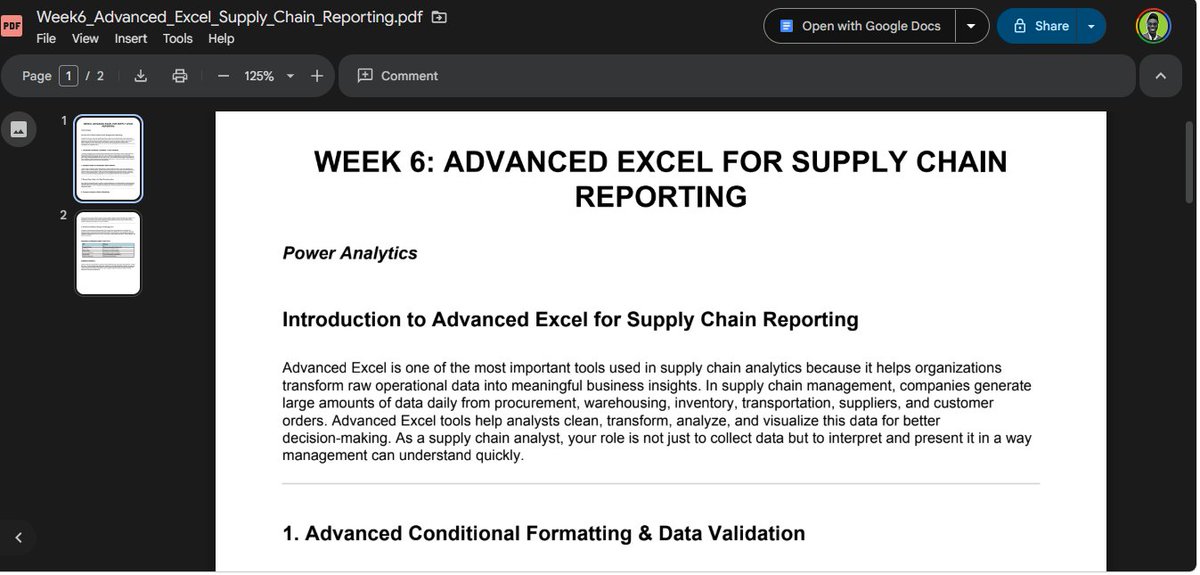
Week 6 – Advanced Excel for Supply Chain Reporting ✅
Today, I took my students through the first half of Week 6, focusing on foundational tools that transform messy operational data into professional supply chain reports.
What we covered:
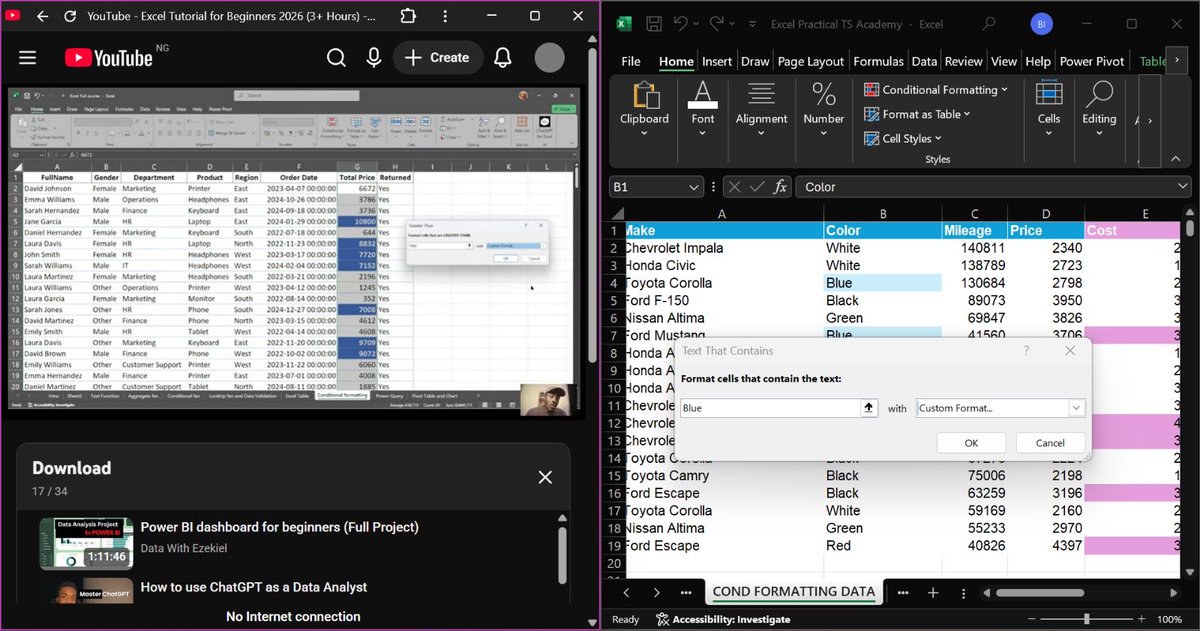
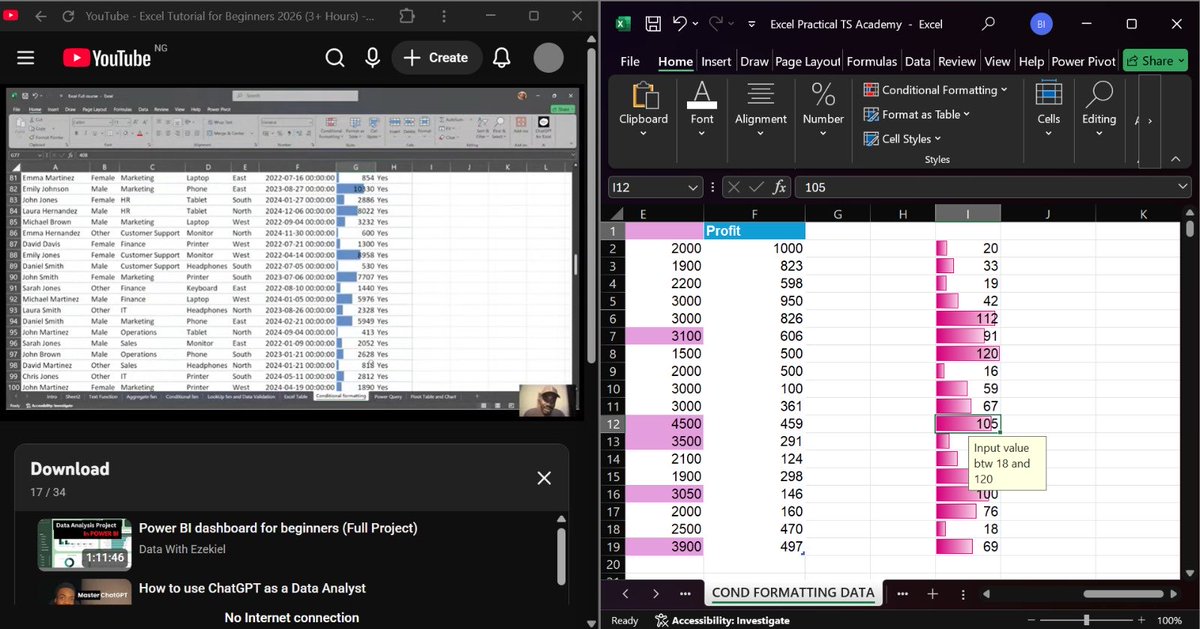
🔹 Advanced Conditional Formatting
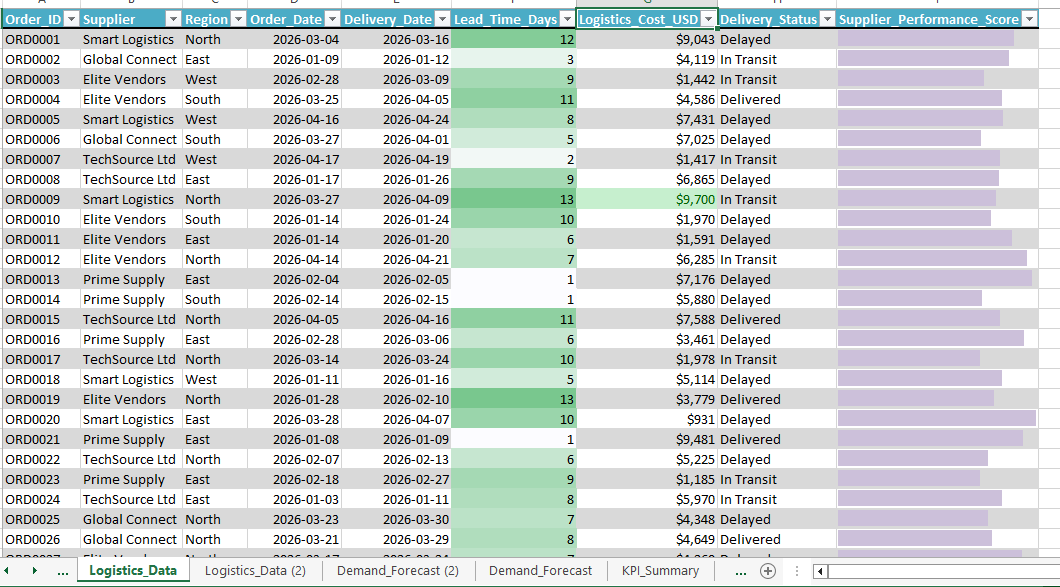
– Applied to logistics data: delayed shipments (red), delivered (blue), in-transit (yellow)
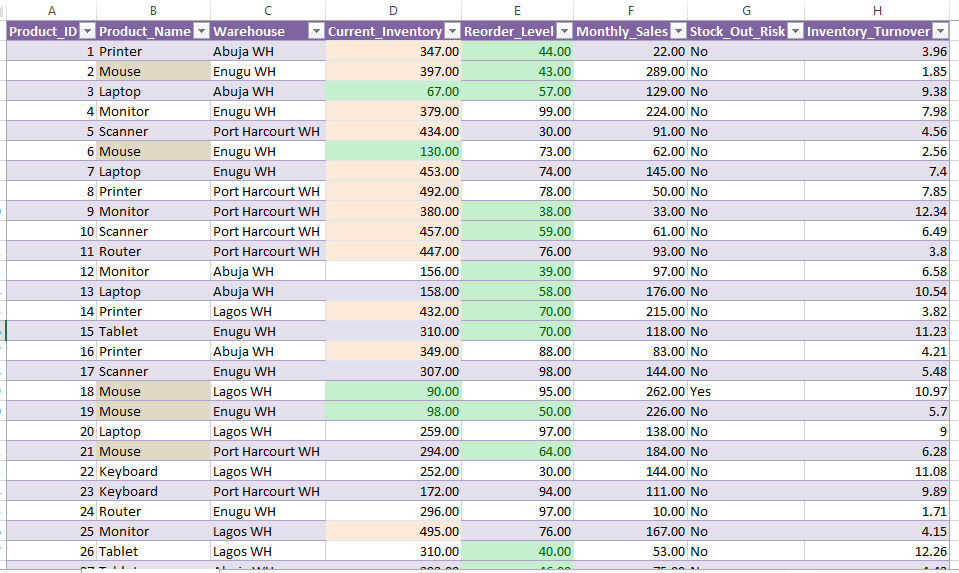
– Set up stock-out risk alerts on inventory sheet based on reorder levels
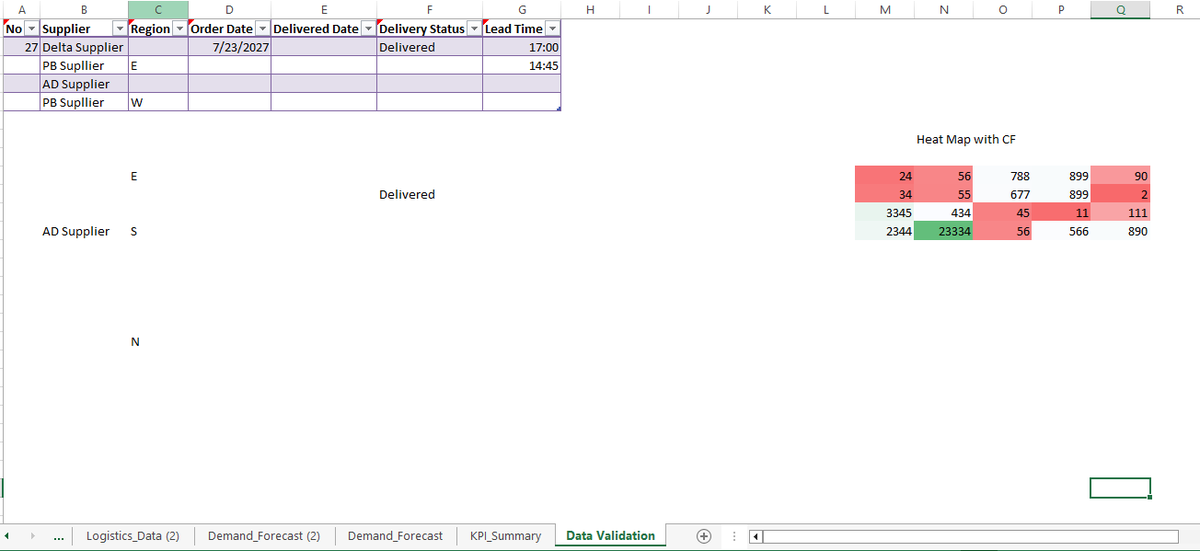
🔹 Data Validation
– Created dropdown menus for Supplier and Region filtering
– Ensured data integrity for cleaner analysis
🔹 Dynamic Charts
– Built charts that update automatically as data changes
– Used for visualizing lead time trends and logistics costs by supplier
🔹 Power Query for Data Transformation (where we stopped today)
Real data used in class:
· Logistics data (26 orders: lead time, cost, delivery status, supplier)
· Inventory data (26 SKUs: current inventory, reorder level, stock-out risk)
Student takeaway:
Power Query alone saves hours of manual Excel work. One refresh = clean, analysis-ready data.
📅 Continuing Friday – Advanced Power Query, Scenario Analysis, What-if Modelling & Professional Report Design
#SupplyChainAnalytics #AdvancedExcel #PowerQuery #ConditionalFormatting #DataValidation #DynamicCharts #ExcelBootcamp #ProofOfWork
11
4,170

Apr 30
10-second Excel tip that'll save you hours. 🤯
Download my FREE Excel Shortcut Guide 👉🏼 shorturl.at/xGY8R
#excel #exceltips #conditionalformatting #attendancetracker #tutorial
9
63
9,877

Apr 30
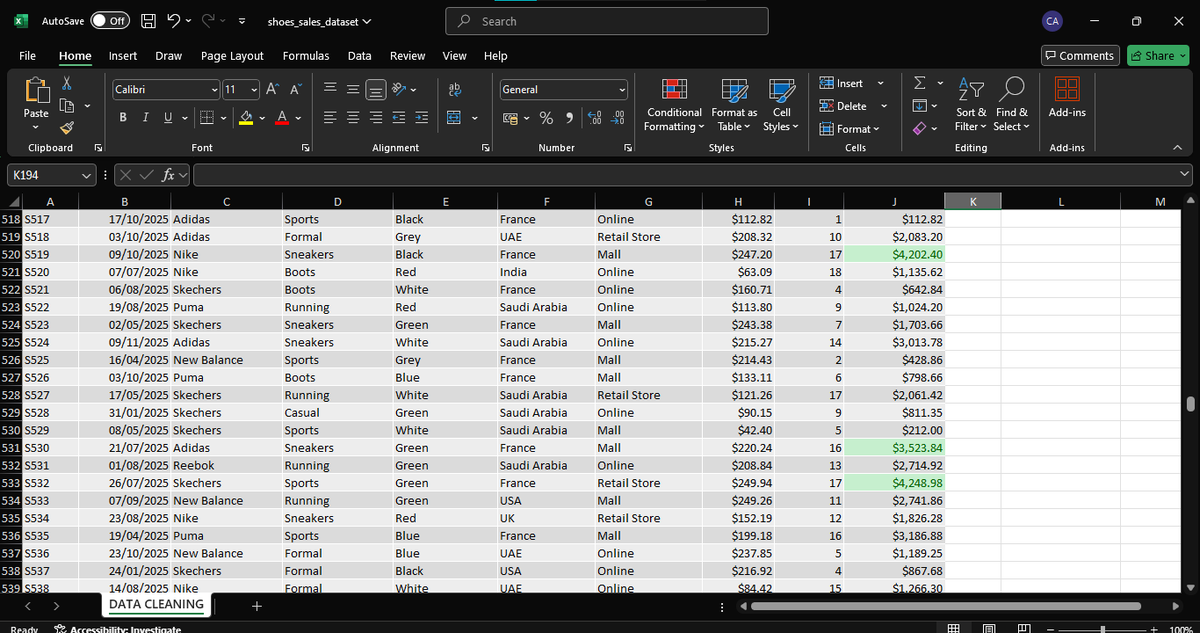
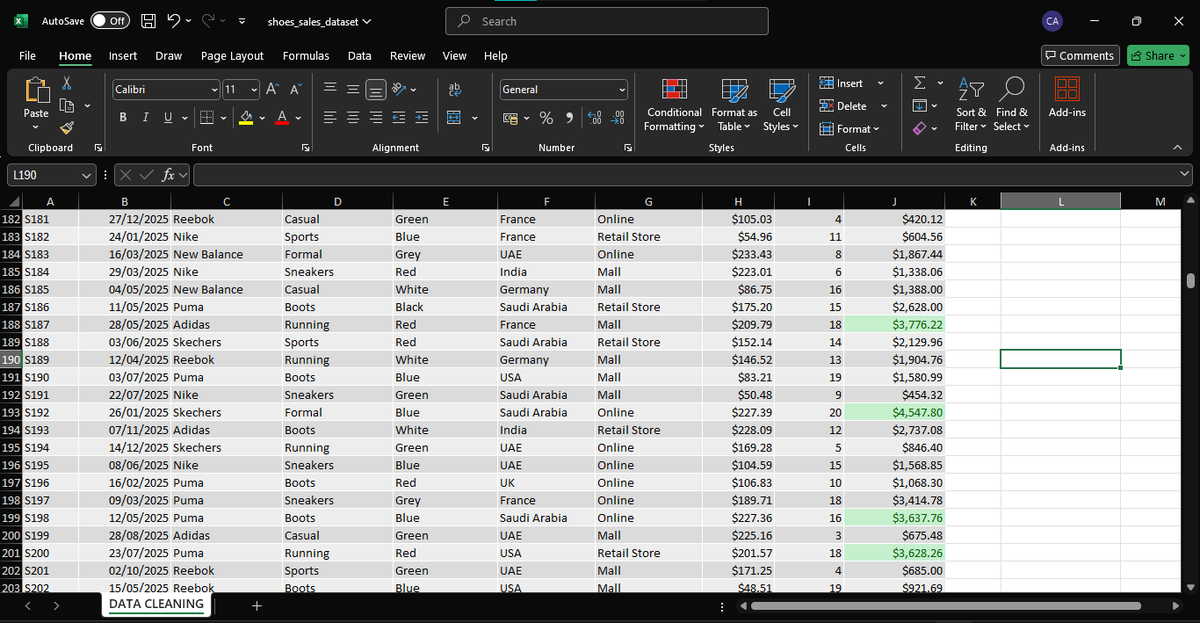
Day 4✅ of the #HTTDatachallange continued with real analyitics using Conditional Formatting to highlight top sales from $3,500 & Flag values above target. Stay with me🚀
C/o @hertechtrail
#ConditionalFormatting
#DataAnalysis
1
5
48

Apr 29
Smart Attendance Sheet in #Excel
Type P or A in Excel
✔ Auto count totals
✔ Highlight Present & Absent with colors
✔ Clean attendance tracker instantly
Join Now My Data Academy
excelsirji.com
#ExcelTips #Attendance #ConditionalFormatting #Productivity #Automation
16
60
1,562

Mar 11
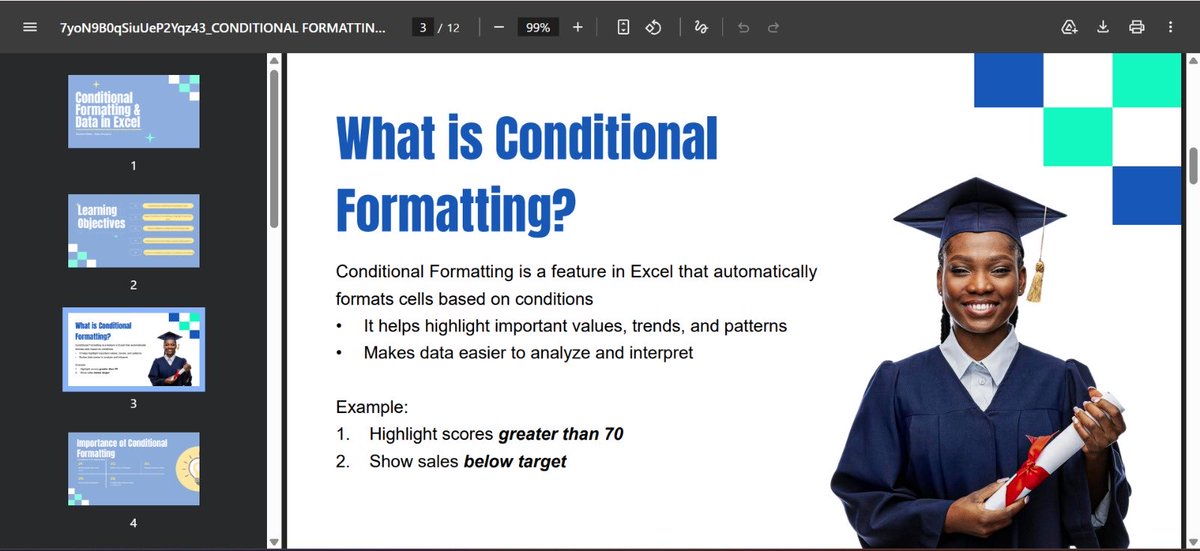
Slides provided by our tutor @ezekiel_aleke just in time for class today 🌚… Countdown to 18:00pm 🙃
@TechSphereAcad
#day24 #conditionalformatting #DataAnalytics #30DaysOfTech #LearningWithTS #justagirlwholikesdata💕
3
76
Mar 10
Studying Conditional Formatting ahead of tomorrow with @ezekiel_aleke YouTube video. It isn’t difficult plus I really like the pretty colors 😊@TechSphereAcad
#day23 #conditionalformatting #30DaysOfTech #LearningWithTS #justagirlwholikesdata💕
6
10
15
1,777

Feb 27
Day 9 of Data Analysis
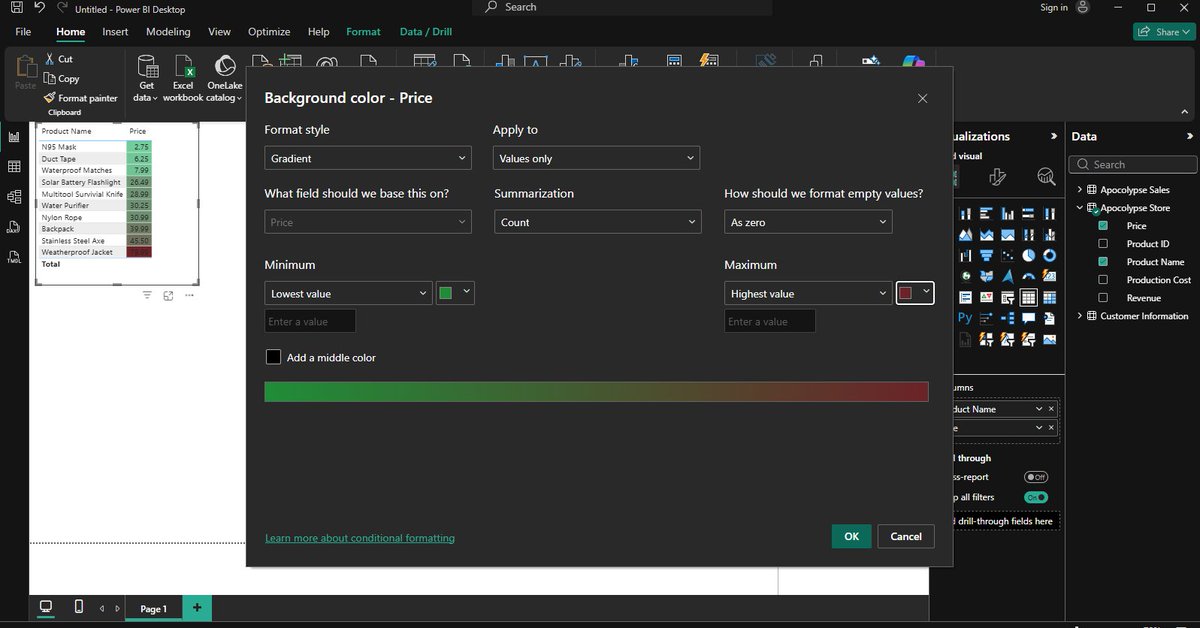
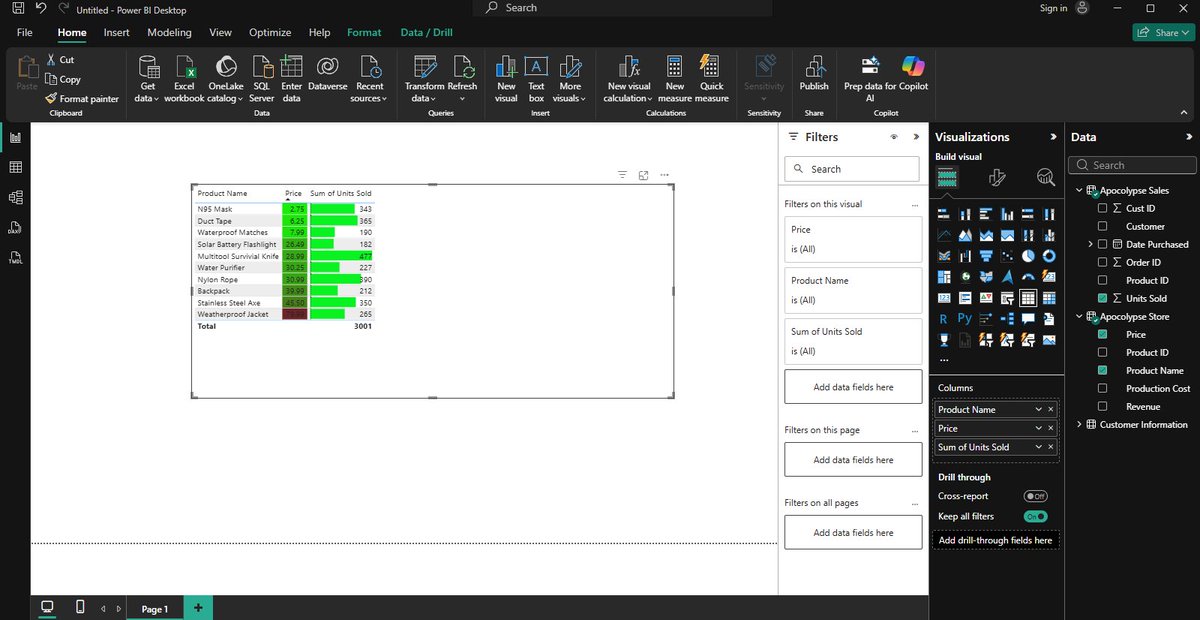
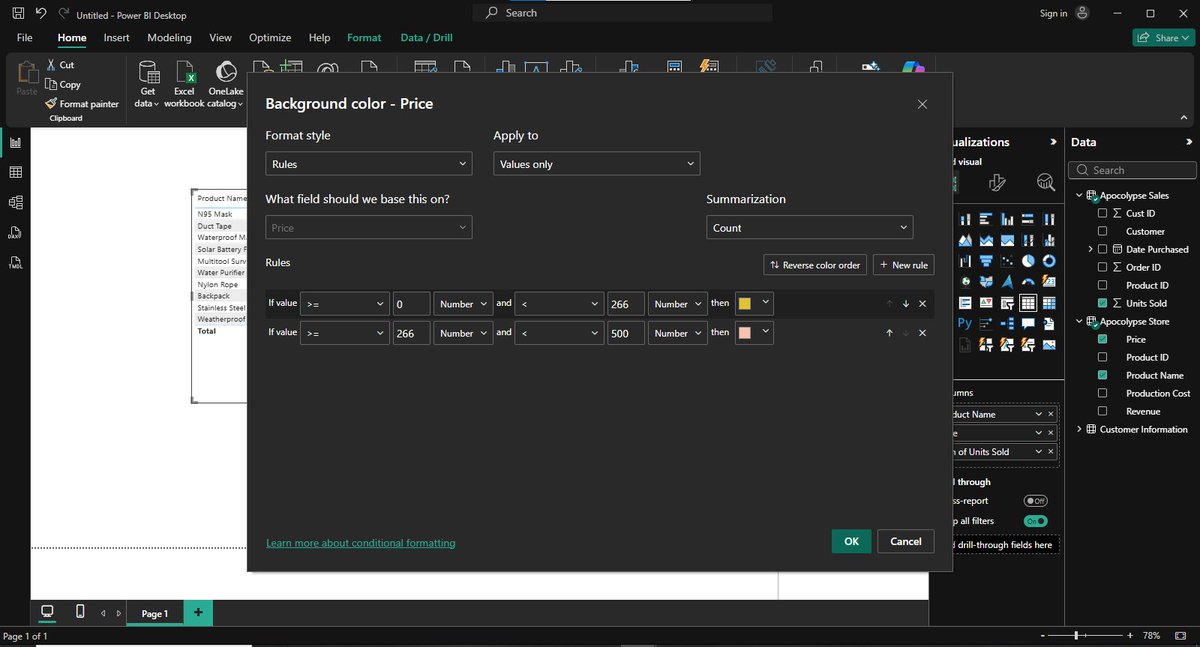
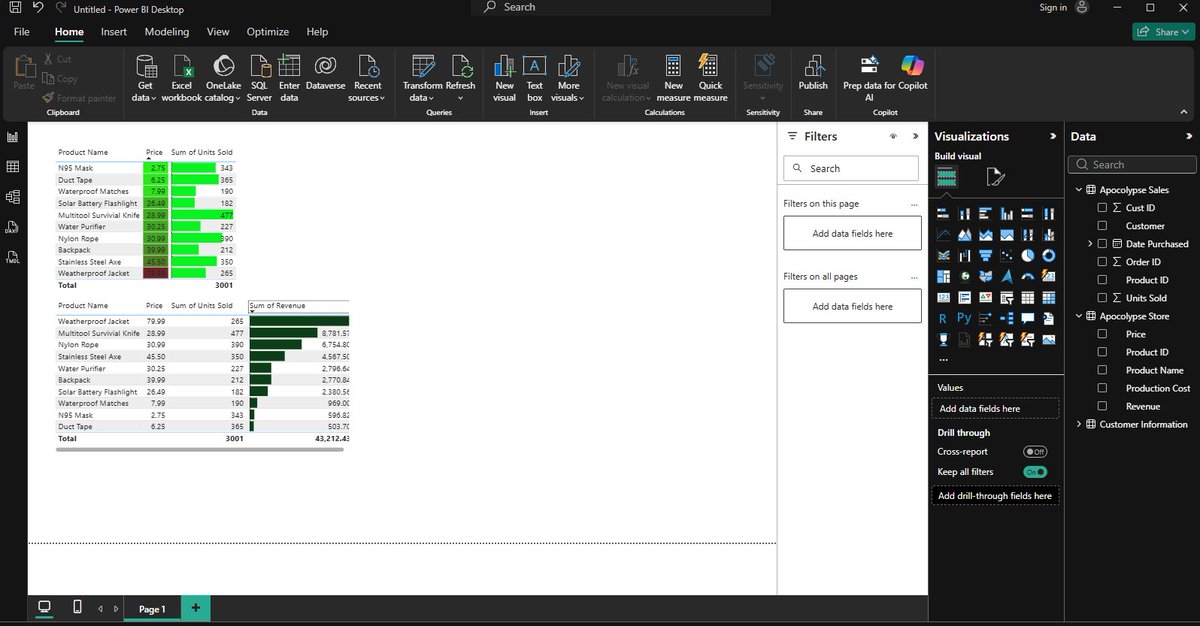
Today's focus: Conditional formatting in Power BI. Conditionalformatting is changing the appearance of values based on conditions. Instead of just using numbers you use color,data bars, icons.
#DataAnalysis
3
86

✨ Dynamic Icons in Azure Maps in Power BI
New in Power BI!
Step 1: Prepare the Data
Create a table with Latitude and Longitude fields.
Step 2: Build the Azure Map
Insert an Azure Maps visual in Power BI.
Choose a marker type.
Built-in and custom icons are available starting with the January 2026 update!
Step 3: Apply Conditional Formatting NEW!
Use conditional formatting for marker rotation (0–360 scale) and apply conditional formatting for marker color.
Very cool
#powerbi #azuremap #conditionalformatting

1
3
10
570
Jan 11
Stop reading numbers.
Use Icon Sets custom rules in Excel to instantly spot high, medium & low values 🟢🟡🔴
Change the data → Icons update automatically.
Join My Data Academy excelsirji.com
#ExcelTips #ConditionalFormatting #ExcelHacks #DataAnalysis #MicrosoftExcel
1
52
213
5,293

22 Dec 2025
التنسيق الشرطي الفرز الصحيح يغيّر طريقة قراءة البيانات.
ألوان و Icons توضّح التوجّه بسرعة،
ومع الفرز متعدد المستويات الصورة تصير أوضح فورًا.
#تحليل_البيانات #Excel #DataAnalytics #ConditionalFormatting
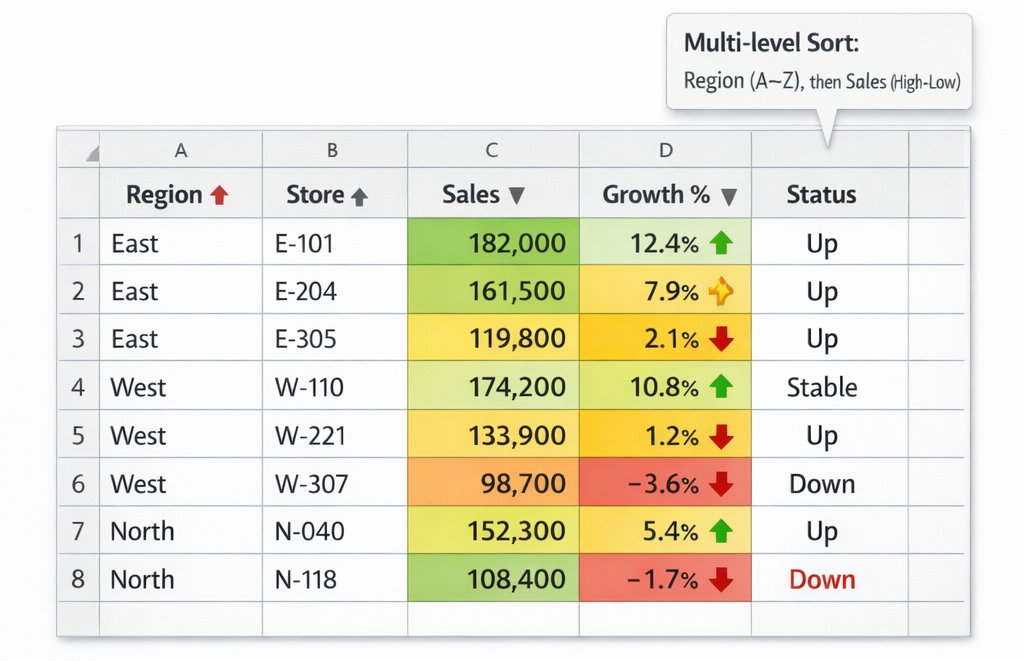
ALT صورة جدول البيانات
6
653
29 Oct 2025
Stop wasting time comparing #Excel tables manually!
Use Conditional Formatting → Not Equal To to highlight differences instantly
Quick, clear & time-saving
Join My Data Academy Excelsirji.com for more hacks!
#ExcelTips #ConditionalFormatting #Spreadsheet #Productivity
1
8
218

28 Oct 2025
Make your data easier to read using #Conditionalformatting
Don't forget to Register for our #exceltraining program
at only Ugx5,000... You can as well sponsor a participant
#queenscodinginitiative #theinitiativecast #Digitalskills #girlsintech #exceltip
youtube.com/shorts/en8Ldz4ze…

1
3
32
16 Sep 2025
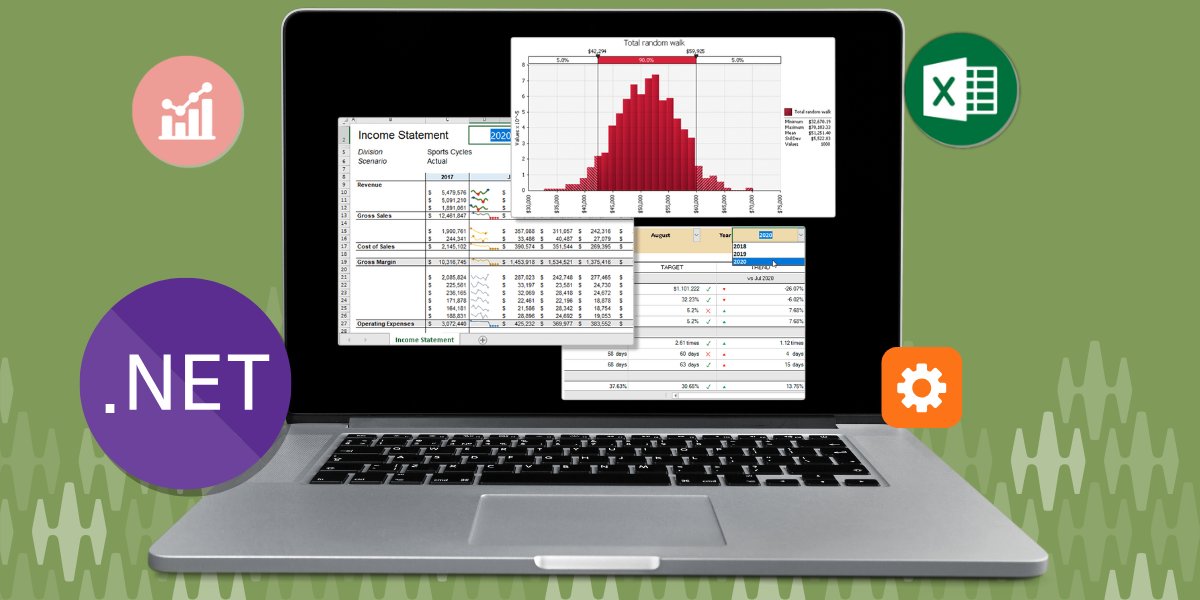
Users expect more than basic grids—they want familiar spreadsheet reporting in apps. With Spread .NET, a .NET spreadsheet component, you can deliver pivot tables, formulas, data binding, and export-ready layouts that feel familiar and powerful.
Build financial reports, dashboards, and trackers with intuitive UI, conditional formatting, and print-ready views. See how Spread .NET brings advanced spreadsheet reporting to your enterprise app: bit.ly/4nb8kLJ
#dotnet #spreadsheets #microsoftexcel #reporting #pivottables #formulas #databinding #dashboards #conditionalformatting #developers #coding
2
48

11 Sep 2025
This week, we’ll explore WebDataRocks formatting features!
Find out how to customize numbers and use conditional formatting to make your reports more insightful.
#WebDataRocks #DataViz #NumberFormatting #ConditionalFormatting
5
50
15 Aug 2025
🚦 Add a RAG (Red-Amber-Green) status to your Excel sheet in 2 steps!
#ExcelTips #Excel #DataViz #DataVisualization #SpreadsheetHacks #ExcelFormula #ExcelFormulas #ConditionalFormatting #DataDriven #ProductivityTips #ExcelDashboard #DataAnalytics #ExcelTraining #SpreadsheetTips
9
46
2,245

25 Jun 2025
Let your data speak for itself! Conditional Formatting is a game-changer for building reports. For more free, in-depth Excel training, subscribe to my YouTube channel (Link in Bio)! #ExcelTips #ConditionalFormatting #DataAnalysis #Productivity
1
75

13 Jun 2025
Master Conditional Formatting in Excel
lnkd.in/dfNd6i9X
Unlock the true power of your data with this comprehensive CrispExcel webinar, now available as a recorded video! In this session, we dive deep into Conditional Formatting, one of Excel's most visual and impactful tools.
Whether you're tired of sifting through rows of numbers or want to highlight critical insights instantly, this webinar is for you. Learn how to transform your raw data into dynamic, easy-to-understand visual dashboards.
In this webinar, you'll discover how to:
*Highlight key trends: Quickly spot highs, lows, duplicates, and unique values.
*Visualize data: Use data bars, colour scales, and icon sets to bring your spreadsheets to life.
*Apply rules effectively: Master various rule types, including 'Greater Than', 'Less Than', 'Top/Bottom', and custom formulas.
*Manage and edit rules: Keep your formatting organized and efficient.
Identify outliers: Use conditional formatting to instantly pinpoint data anomalies.
*Create dynamic dashboards: Build interactive reports that update automatically.
Perfect for anyone looking to enhance their Excel skills and present data more effectively. Stop just looking at data, start seeing it!
#CrispExcel #ExcelTutorial #ConditionalFormatting #ExcelTips
1
3
614

2 Jun 2025
Learn to Use Conditional Formatting in Excel to highlight trends, spot errors, and make your data Pop!
Stand a chance to take your DA skills to the next level with us📊
#ExcelTips #ConditionalFormatting
1/2...
1
3
18
1,413

20 May 2025
Highlight Negative Numbers in Excel Without Changing Values | Easy Conditional Formatting Tip
#ExcelTips #ConditionalFormatting #HighlightNegativeNumbers #ExcelTutorial #ExcelTricks #DataVisualization #ExcelForBeginners
#rpandeytutorials #viral #shorts #Trending #freeuse
1
2
400