
CONTINUATION PATTERNS THAT SMART TRADERS USE FOR BIG PROFITS
1. Why Continuation Patterns Matter In Trading
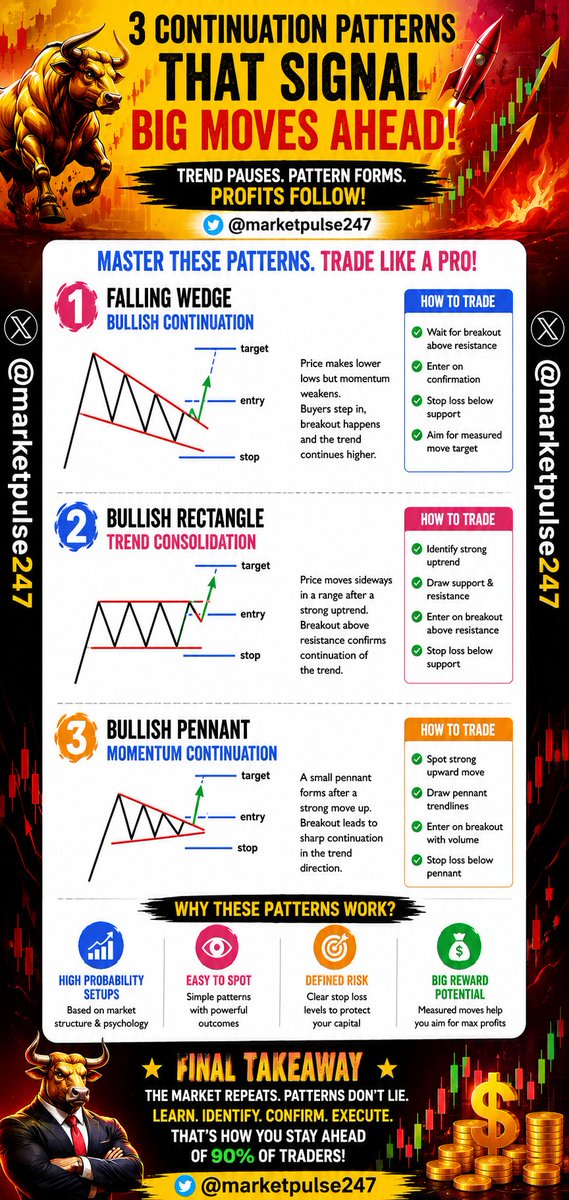
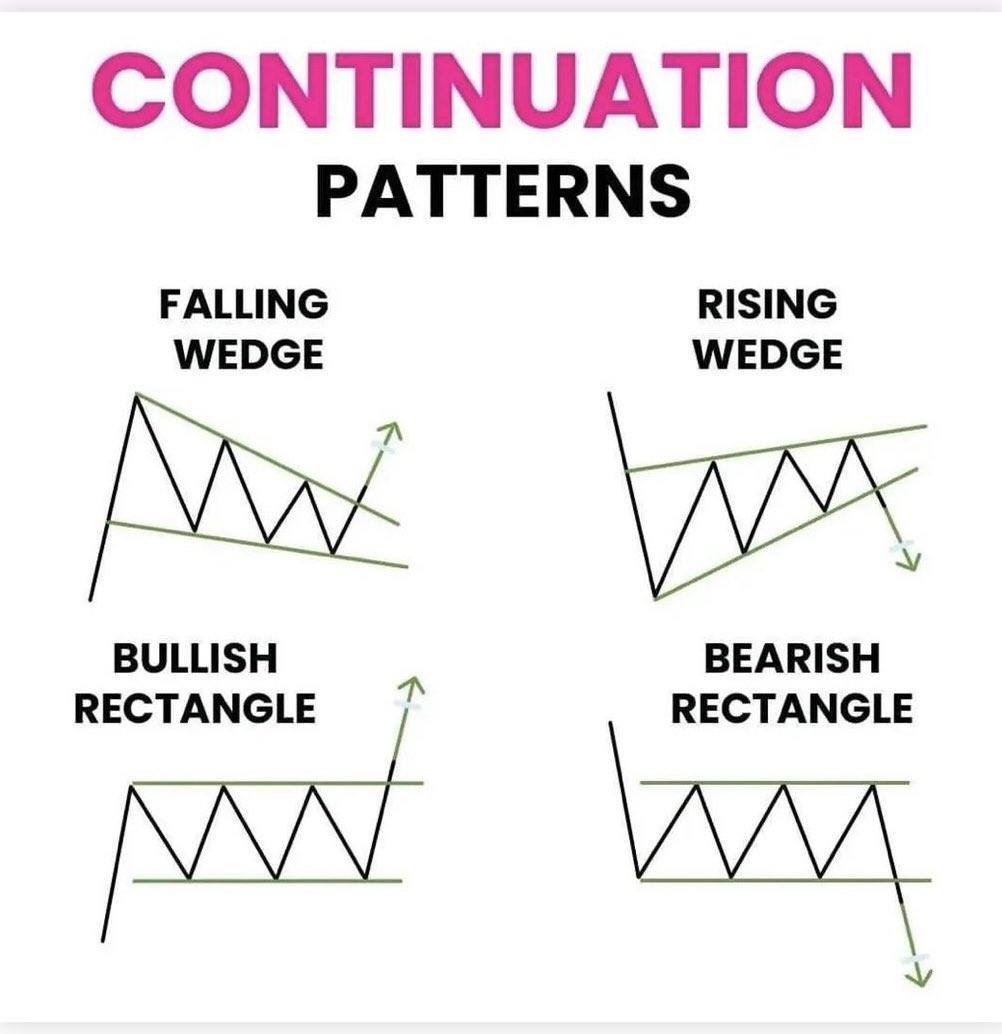
Continuation patterns are some of the most powerful tools traders use to identify trend continuation opportunities with better timing and lower risk. Many beginners think markets move randomly, but experienced traders know trends usually pause before continuing in the same direction. This temporary pause creates continuation patterns like the Falling Wedge, Bullish Rectangle, and Bullish Pennant shown in the image. These patterns help traders understand when buyers are regaining strength after a short period of consolidation. Smart traders wait for breakout confirmation before entering trades because patience increases the probability of success. Continuation patterns are important because they provide clear entry points, stop loss levels, and profit targets. They also help traders avoid emotional decisions by following structured setups instead of random guessing. The market rewards traders who recognize repeating price behavior. Learning continuation patterns improves confidence, timing, and discipline while helping traders trade with the trend instead of fighting against market momentum.
2. The Falling Wedge Can Signal Explosive Moves
The Falling Wedge pattern is one of the most underestimated bullish continuation setups in trading. At first glance, the pattern looks bearish because price moves downward inside narrowing trend lines. However, smart traders understand that weakening downward momentum often signals an upcoming bullish breakout. The image clearly shows how price compresses tighter before eventually breaking upward toward the target area. This pattern reflects a battle between buyers and sellers where sellers slowly lose strength over time. Professional traders wait for breakout confirmation before entering because false breakouts are common in emotional markets. A strong breakout with increasing volume often confirms that buyers are taking control again. The Falling Wedge works best when it appears during an existing uptrend because it signals temporary weakness rather than a full reversal. Traders who understand this pattern can identify high probability setups before major moves happen. Patience and confirmation remain the keys to trading wedges successfully.
3. Bullish Rectangles Reveal Strong Market Confidence
The Bullish Rectangle pattern forms when price moves sideways after a strong upward move. This pattern represents temporary consolidation where buyers and sellers reach short term balance before the trend continues higher. The image shows price bouncing between support and resistance levels repeatedly before eventually breaking upward toward the target zone. Many beginners become impatient during consolidation because price appears boring and directionless. Experienced traders see something completely different. They understand that strong trends often pause before continuing. Bullish Rectangles reveal confidence because buyers continue defending support despite temporary selling pressure. Smart traders wait for price to break above resistance before entering trades because breakout confirmation increases the probability of continuation. This pattern provides clear risk management because stop losses can be placed below the support zone. Traders who master Bullish Rectangles learn how to stay patient while preparing for explosive breakout opportunities instead of reacting emotionally to short term market noise.
4. Bullish Pennants Often Lead To Fast Breakouts
The Bullish Pennant is one of the most exciting continuation patterns because it often leads to sharp and aggressive breakout moves. This pattern forms after a strong upward price movement followed by a small triangular consolidation. The image clearly demonstrates how price compresses tightly before buyers regain control and push the market higher again. Pennants reflect temporary market hesitation rather than weakness. Buyers pause briefly to absorb selling pressure before continuing the trend. Professional traders love this setup because it offers strong reward potential with relatively small risk. The tighter the consolidation becomes, the more explosive the breakout can eventually be. However, discipline is essential because entering too early can lead to unnecessary losses during fake breakouts. Successful traders wait for confirmation, proper volume, and strong price action before committing to trades. The Bullish Pennant teaches traders an important lesson. Patience during consolidation often leads to powerful opportunities when momentum finally returns.
Bold Conclusion
Continuation patterns are not random shapes on a chart. They represent market psychology, momentum, and the battle between buyers and sellers. Patterns like the Falling Wedge, Bullish Rectangle, and Bullish Pennant help traders identify high probability breakout opportunities with better risk management. The secret is not just recognizing the pattern, but waiting patiently for confirmation before entering the trade. Smart traders follow structure, discipline, and probability instead of emotions. Master these continuation patterns, and you will begin seeing the market with a completely different perspective.
Follow on Twitter: @marketpulse247
#Trading #StockMarket #Forex #Crypto #TechnicalAnalysis #PriceAction #ContinuationPatterns #BullishPennant #BullishRectangle #FallingWedge #TradingPsychology #DayTrading #SwingTrading #ChartPatterns #TradingEducation #TraderMindset #RiskManagement #Investing #StockTrading #CryptoTrading #ForexTrading #MarketAnalysis #TradingTips #TradingCommunity #SmartMoney #BreakoutTrading #TrendTrading #FinancialFreedom #TradingSuccess #LearnTrading #InvestmentStrategy #CandlestickPatterns #MarketStructure #TraderLife #TradingJourney #Patience #Discipline #CapitalProtection #TradingView #FinancialEducation #WealthCreation #MarketWisdom #SuccessfulTrader #InvestmentMindset #TradingDiscipline #MomentumTrading #MarketPulse247 #TraderMotivation #TechnicalTrader #PriceActionTrading
3
4
115

🔥 Powerful Chart Patterns Every Trader Must Master To Win Big In The Market 🔥
Reversal Patterns Spot Market Turning Points Before Everyone Else
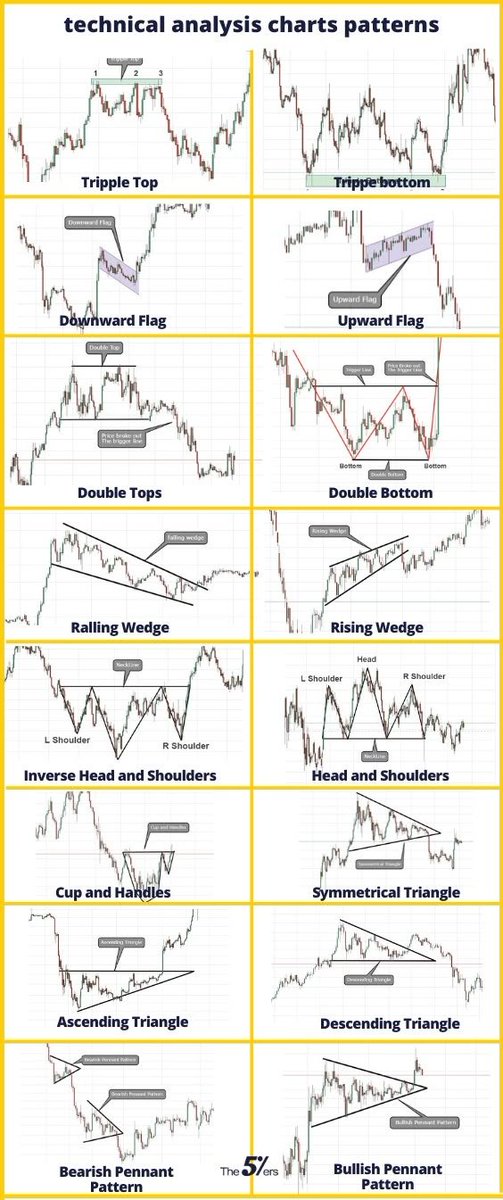
Reversal patterns are the key to identifying when a trend is about to change direction. Patterns like triple top double top and head and shoulders signal that an uptrend is losing strength and a potential downtrend may begin. On the other side triple bottom double bottom and inverse head and shoulders indicate that selling pressure is fading and buyers are ready to take control. These patterns are formed after strong trends and reflect a shift in market psychology. Smart traders use these setups to exit positions at the right time and even reverse their trades. The real power comes when these patterns appear near strong support or resistance levels because that increases their reliability. Learning to recognize reversal patterns early gives you an advantage and helps you stay ahead of the majority of traders who react too late.
Continuation Patterns Ride The Trend Like A Pro Trader
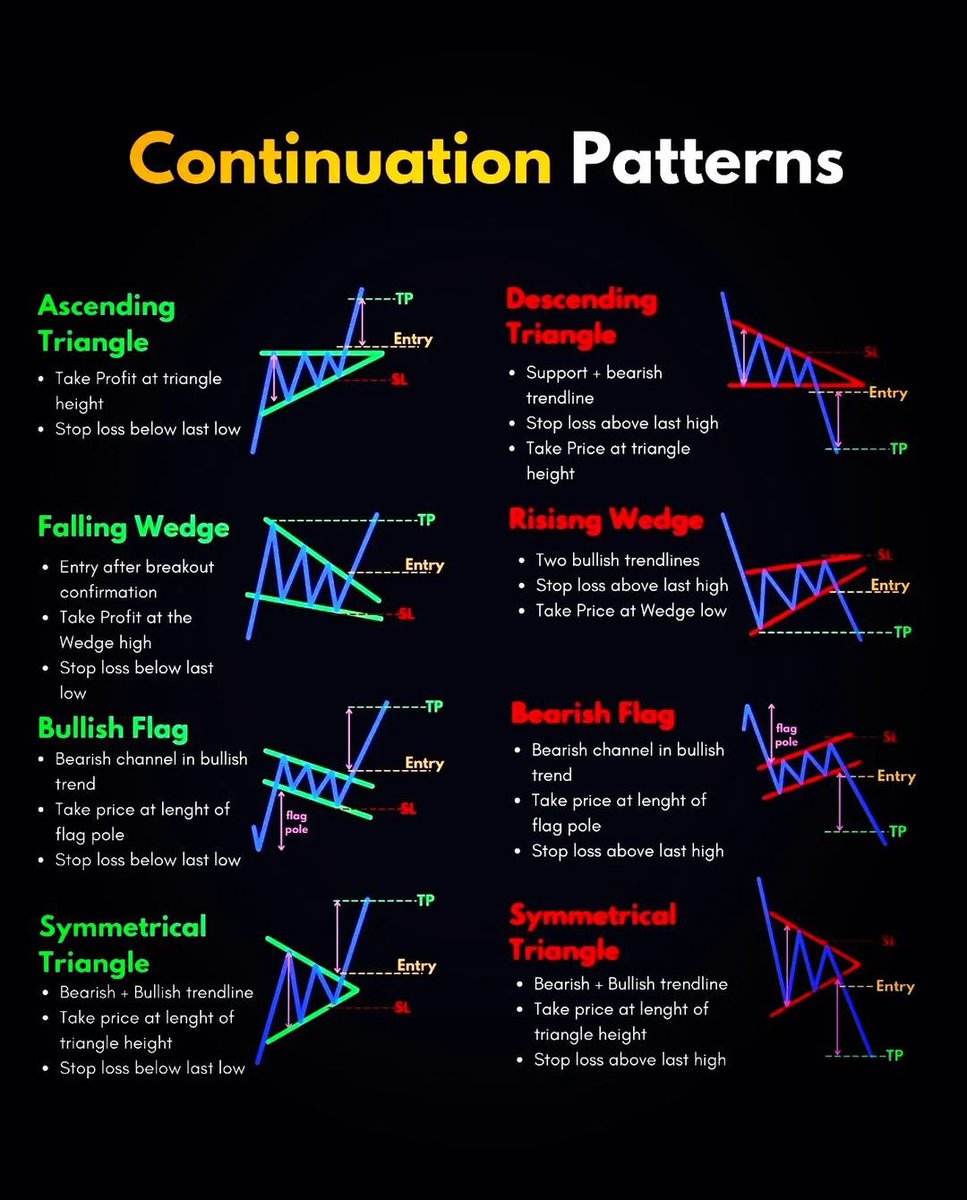
Continuation patterns help traders stay in the trend and maximize profits instead of exiting too early. Patterns like upward flag downward flag bullish pennant and bearish pennant show temporary pauses in the market before the trend continues. These patterns are formed when price consolidates after a strong move allowing the market to gather strength for the next leg. During this phase volume often decreases which indicates a lack of strong opposition. Once price breaks out of the pattern the trend resumes with momentum. Traders use these setups to enter trades in the direction of the trend with better timing and lower risk. The key is patience and waiting for confirmation before entering. Continuation patterns are extremely useful because they allow traders to ride big moves instead of missing opportunities due to fear or uncertainty.
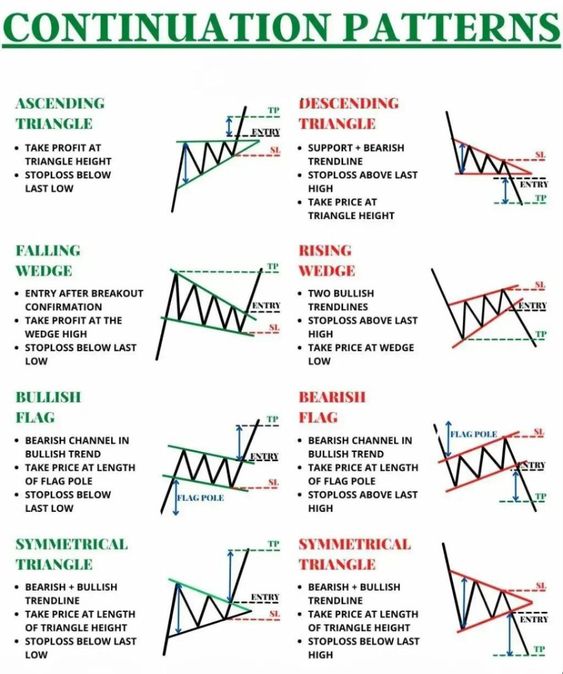
Wedge And Triangle Patterns Understand Market Compression And Breakouts
Wedge and triangle patterns represent periods of market consolidation where price gradually compresses before a breakout. Rising wedge and falling wedge can signal both continuation and reversal depending on the context. Similarly symmetrical ascending and descending triangles show how buyers and sellers are battling for control. As price moves within these patterns volatility decreases and tension builds up. Eventually price breaks out strongly in one direction creating trading opportunities. Traders watch these patterns closely because they often lead to explosive moves. The direction of the breakout is confirmed by volume and overall trend direction. Understanding these patterns helps traders prepare in advance and avoid random decisions. It also improves risk management because stop losses can be placed within the structure of the pattern making trades more controlled and strategic.
Classic Patterns Build Confidence And Consistency In Trading
Classic chart patterns like cup and handle are widely used because of their simplicity and effectiveness. This pattern shows a rounded bottom followed by a small consolidation before a breakout which signals continuation of an uptrend. It reflects accumulation followed by renewed buying interest. When combined with other patterns and concepts traders gain a complete understanding of market structure. The more patterns you recognize the more confident you become in reading charts. Consistency in trading comes from following proven setups and avoiding emotional decisions. These patterns work across different markets and timeframes making them versatile tools for traders. Practice is essential to master them and improve accuracy. Over time these patterns become second nature and help you make faster and better trading decisions.
💡 Conclusion Master Chart Patterns And Take Control Of Your Trading Journey 💡
Technical analysis patterns are powerful tools that reveal the behavior of the market and the psychology behind price movements. By mastering reversal continuation and breakout patterns traders can improve their timing and decision making. The goal is not to predict every move but to trade with higher probability and better risk management. Consistency comes from discipline patience and continuous learning. Focus on understanding how patterns form and always wait for confirmation before entering trades. With practice these patterns can transform your trading approach and help you achieve better results over time.
Follow for more insights x.com/@anandnst
#trading #stockmarket #technicalanalysis #chartpatterns #priceaction #intraday #swingtrading #nifty #banknifty #traderlife #investing #stocks #sharemarket #tradingstrategy #reversalpatterns #continuationpatterns #breakout #trendfollowing #marketanalysis #finance #wealthbuilding #financialfreedom #equity #futures #options #stockanalysis #learning #tradingeducation #money #profit #riskmanagement #discipline #successmindset #indianstockmarket #sensex #nifty50 #growth #investment #chartanalysis #tradingcommunity #marketstructure #momentum #breakouttrading #volumeanalysis #bullish #bearish #patterns #tradingtips #consistency
3
112

5 Sep 2025
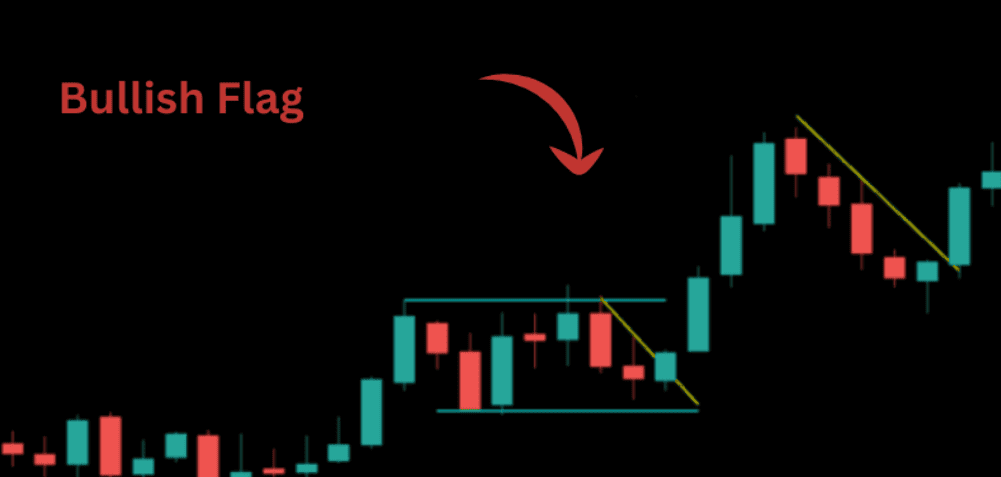
Are you trading the flag pattern but struggling with failed breakouts or inconsistent results? The flag pattern is one of the most powerful continuation chart patterns in technical analysis, but success depends on confirmation. By combining flag patterns with RSI and Moving Averages, traders can significantly improve accuracy and increase the probability of success.
In this video, Bharat Jhunjhunwala reveals a step-by-step method to enhance the flag pattern trading strategy using price action, RSI divergence, and moving averages. This approach helps filter out false breakouts, identify strong continuation setups, and maximize profits in stocks, forex, crypto, and commodities.
📌 What You’ll Learn in This Video:
✔️ Flag Pattern Trading Strategy – Bull flags, bear flags, and how to trade them step-by-step
✔️ RSI Confirmation – Using RSI for overbought/oversold filters & divergence signals
✔️ Moving Averages with Flag Pattern – EMA/SMA combinations for entry, exit & stop-loss placement
✔️ Price Action Analysis – Support, resistance & breakout zones for stronger setups
✔️ False Breakout Avoidance – How to identify traps & save your capital
✔️ Swing Trading & Intraday Application – Adapting flag patterns across multiple timeframes
✔️ Real Chart Examples – Nifty, Bank Nifty, Bitcoin, Gold, and US stocks explained
🔍 Why This Works in 2025 Markets:
→ Flag patterns remain one of the most reliable continuation setups
→ RSI filters out weak signals and improves timing
→ Moving averages provide structure for entries & exits
→ Works across stocks, forex, crypto, and commodities
→ Perfect for swing traders and day traders looking for momentum setups
If you’re tired of failed flag trades, this strategy will help you trade flags like a professional and catch explosive continuation moves with confidence.
📍 LIKE if you’ve ever been trapped in a failed breakout
📍 COMMENT your favorite flag pattern setup (bullish or bearish)
📍 SUBSCRIBE for weekly advanced trading strategies
📍 SHARE with traders who rely on chart patterns
#FlagPattern #TradingStrategy #PriceActionTrading #RSI #MovingAverages #TechnicalAnalysis #SwingTrading #DayTrading #ForexTrading #CryptoTrading #StockMarketTrading #ContinuationPatterns #BullFlag #BearFlag #TradingSetups #ProfitableTradingStrategy #MarketAnalysis #HighProbabilityTrading #PriceAction #SmartMoneyMoves #PatternTrading #StockTrading #ForexStrategy #CryptoStrategy #ChartPatterns #TradingEducation #TradingTips #BharatJhunjhunwala #TradingWithIndicators #TradingOpportunities
1
3
434
2 Sep 2025
The Head & Shoulders pattern is one of the most well-known reversal chart patterns in technical analysis. Traders often use it to spot trend reversals, but what most don’t realize is that a failed Head & Shoulders pattern can be an even more profitable setup — turning into a powerful trap pattern that leads to explosive moves.
In this masterclass, Bharat Jhunjhunwala explains not only how to identify the classic Head & Shoulders formation, but also how to recognize when the pattern is failing, and most importantly, how to capitalize on that failure to trade in the opposite direction.
📌 What You’ll Learn in This Video:
✔️ Head & Shoulders Pattern Explained – Key features and psychology behind the pattern
✔️ Inverse Head & Shoulders – The bullish reversal variation you must know
✔️ Failed H&S Traps – How to detect false breakdowns and retail traps
✔️ Trading the Failure – Turning a losing setup into a profitable opportunity
✔️ Classical Chart Pattern Analysis – How failed patterns generate stronger moves than valid ones
✔️ Price Action & RSI Confirmation – Tools to validate pattern strength or weakness
✔️ Swing Trading & Intraday Setups – How to trade H&S patterns across timeframes
✔️ Real Chart Examples – Stocks, Forex, Crypto, and Indices trades explained step-by-step
🔍 Why This Strategy Works in 2025 Markets:
→ Retail traders often get trapped by failed Head & Shoulders breakouts
→ Smart money uses these patterns to induce false moves before reversing
→ Failed chart patterns often lead to stronger continuation trends
→ Works across stocks, forex, crypto, and commodities
→ Perfect for swing trading and intraday traders looking for momentum setups
This is not just another theory lesson — it’s a practical trading blueprint that shows you how to turn failed patterns into profitable opportunities.
📍 LIKE if you’ve ever been trapped by a failed pattern
📍 COMMENT your favorite chart pattern to trade
📍 SUBSCRIBE for advanced chart pattern tutorials weekly
📍 SHARE this with traders who rely on classical chart analysis
#HeadAndShoulders #FailedPatterns #ChartPatterns #PriceActionTrading #TechnicalAnalysis #SwingTrading #DayTrading #ForexTrading #CryptoTrading #StockMarketTrading #HeadAndShouldersPattern #InverseHeadAndShoulders #ReversalPatterns #PatternTrading #SmartMoneyMoves #TradingSetups #ProfitableTradingStrategy #FailedHeadAndShoulders #PatternTrap #StockTrading #ForexStrategy #CryptoStrategy #MarketAnalysis #BharatJhunjhunwala #ContinuationPatterns #TradingWithPriceAction #HighProbabilityTrading #TradingEducation #ClassicalChartPatterns #MarketInsights
3
527

20 Aug 2025
Reversal patterns signal a possible trend flip. Continuation patterns show momentum carrying forward. Learn to spot both and you’ll know when to ride or when to flip the trend.
#CandlestickPatterns #PriceActionTrading #ReversalPatterns #ContinuationPatterns #ForexTrading #CryptoTrading #SmartTrading

8
11
16
161

30 Sep 2024
Basic #Continuation vs. #ReversalPatterns every investor should know.
Follow us for trading insights and lessons!✨
#candlestickpatterns #continuationpatterns #reversalpattern #riskmanagement #chartpatterns #technicalanalysis #fundamentalanalysi #tradersjourney #tradingstrategy

ALT Trading Insights, Chart Patterns, Stock Market, Technical Analysis, Candlestick Patterns, Fundamental Analysis, Trader Journey, Trading Strategy, Forex Life, Liquidity
2
24

20 Nov 2023
🕯️Continuation candlestick patterns are like road signs on your trading journey. They show that an ongoing trend will likely continue.
📊More about these simple and effective patterns for crypto traders. 👇
altrady.com/crypto-trading/t…
#CandlestickPatterns #ContinuationPatterns
5
8
8,017

28 Jun 2023
Looking to maximize your trading strategies?
Don't overlook the power of continuation patterns! 🔄 Whether it's flags, pennants, or wedges, these patterns provide valuable insights into the market's next move. 📊
#TradingStrategies #ContinuationPatterns #MarketInsights #art
1
2
83

25 Apr 2023
2
13
826

26 Jul 2022
Patterns :
#tradingsignals #success #trading #trader #lifestyle #stocks #stockmarket #motivation #daytrader #continuationpatterns
2


14 Nov 2021
Good Morning 🙏
#Learning
ContinuationPatterns
*Are more reliable when trend is strong
*Formed in increased volatility
*Less conviction by sellers/ buyers or Confused
*Types Triangles, Pennants, Flags & Rectangles
*Two lines play major roles; I can say 70% rest all other tools.
1
2

Masterclass with Vishal Mehta Part 5 goes live in another 10 minutes.
Don't miss this insightful session with Mr. @VishalMehta29 and learn how to identify continuation patterns in a trend.
Stay tuned!
#5paisaLive #5paisaWebinar #ContinuationPatterns #StockMarketIndia
1
13
Join Masterclass with @VishalMehta29 - Part 5 tomorrow at 4:30 PM and learn how to identify continuation patterns in a trend.
Don't miss out on this opportunity and join the webinar tomorrow.
#5paisaLive #5paisaWebinar #ContinuationPatterns #TradingStrategies #StockMarketIndia
3
8
12 Nov 2021
Good Morning 🙏
#Learning
So far we have completed
*Candlepatterns
*Trendlines
*RSI partly
*ASM
Now will move to #ContinuationPatterns
*Pennants-Converging 2 Trendlines
*Flags-used 2 parallel Trendlines
*Wedges- Converging 2 Trendlines angled either UP or Down
#FreeSeva
1
2

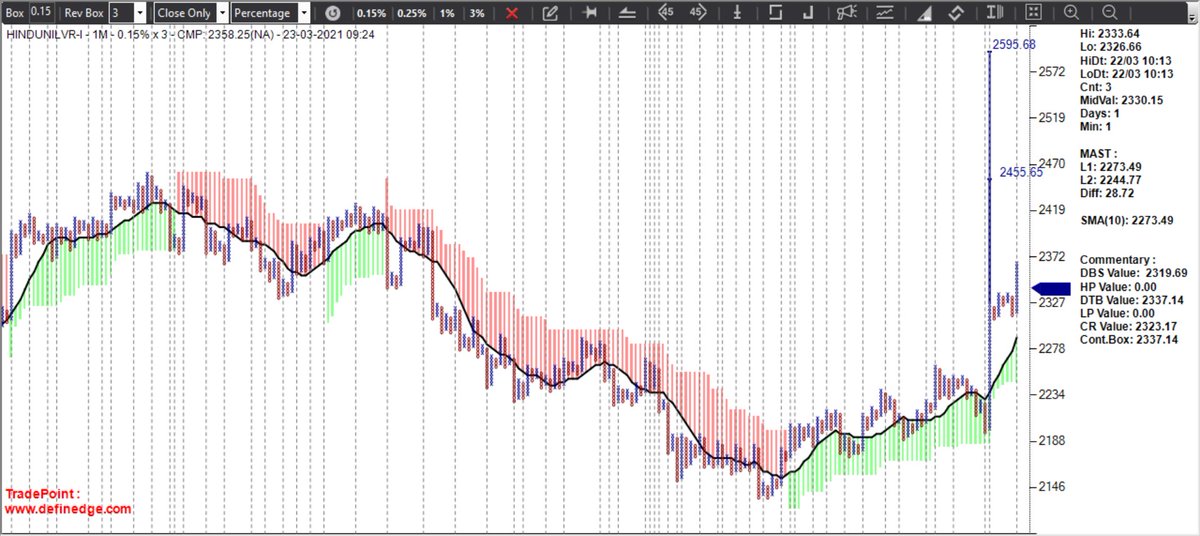
23 Mar 2021
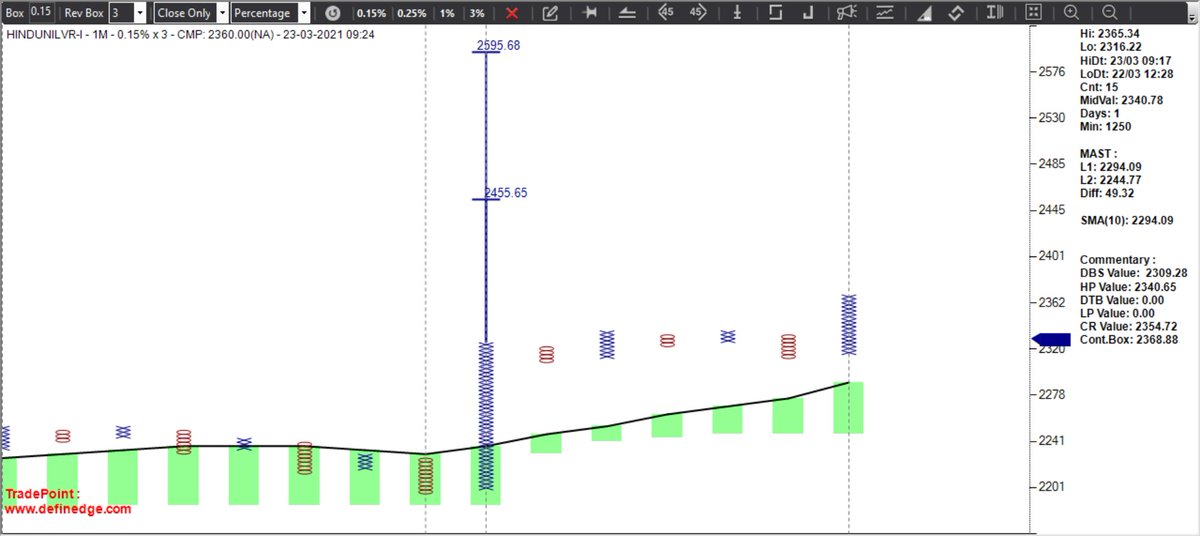
#HindUniLvr #Intraday #MultiColumnBreakout
Considering the multicolumn breakout in Intraday 0.15% (1 Minute) , the follow through buy after small pull backs can be on the watchlist.
#FollowThrough #ContinuationPatterns #Momentum #Stocks
7
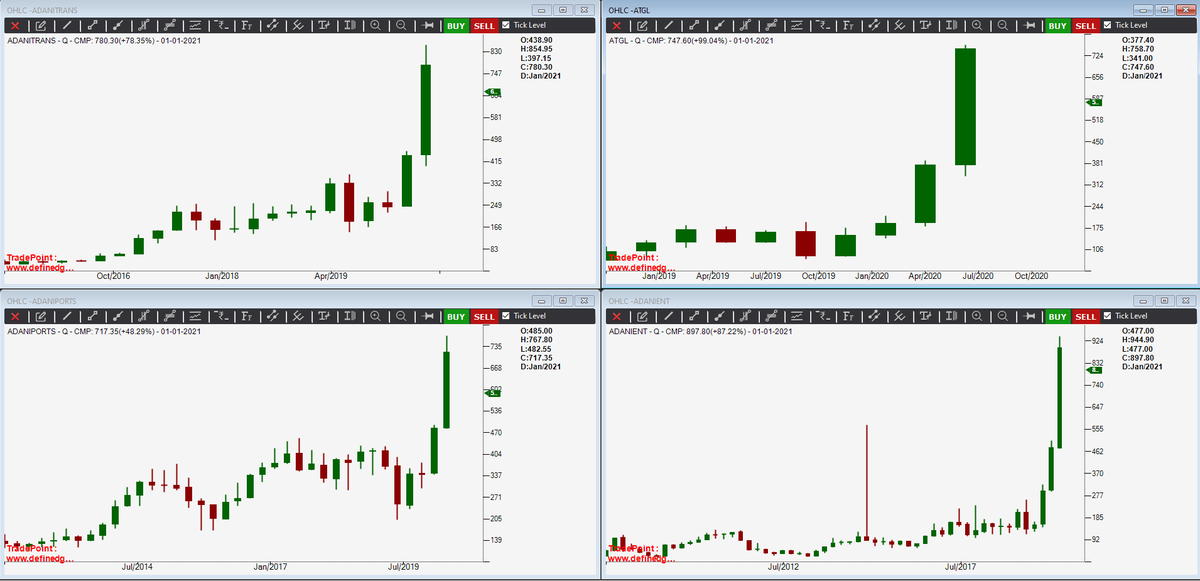
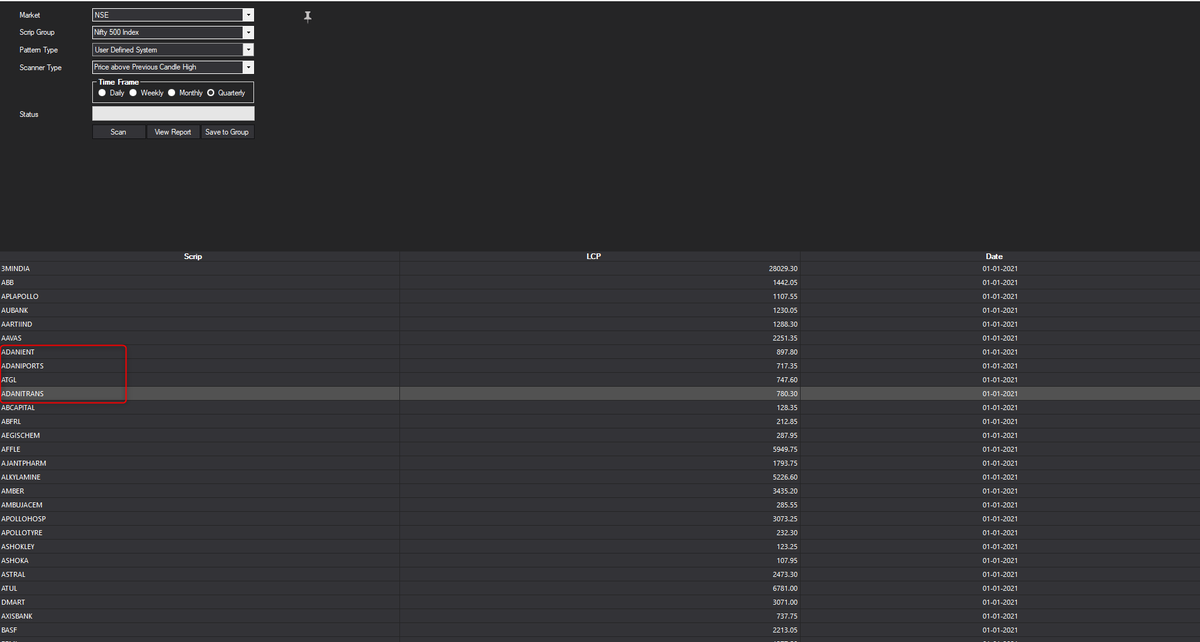
16 Mar 2021
#AurKitnaChalega
इतना की पचास दिन मैं पैसा डबल
When names keep appearing for consecutive quarters almost every day look for pullbacks & DTB's in smaller box (Momentum opportunities), one back Bullish when price is in anchor columns (#WildCard low risk)
#ContinuationPatterns
1
3
12
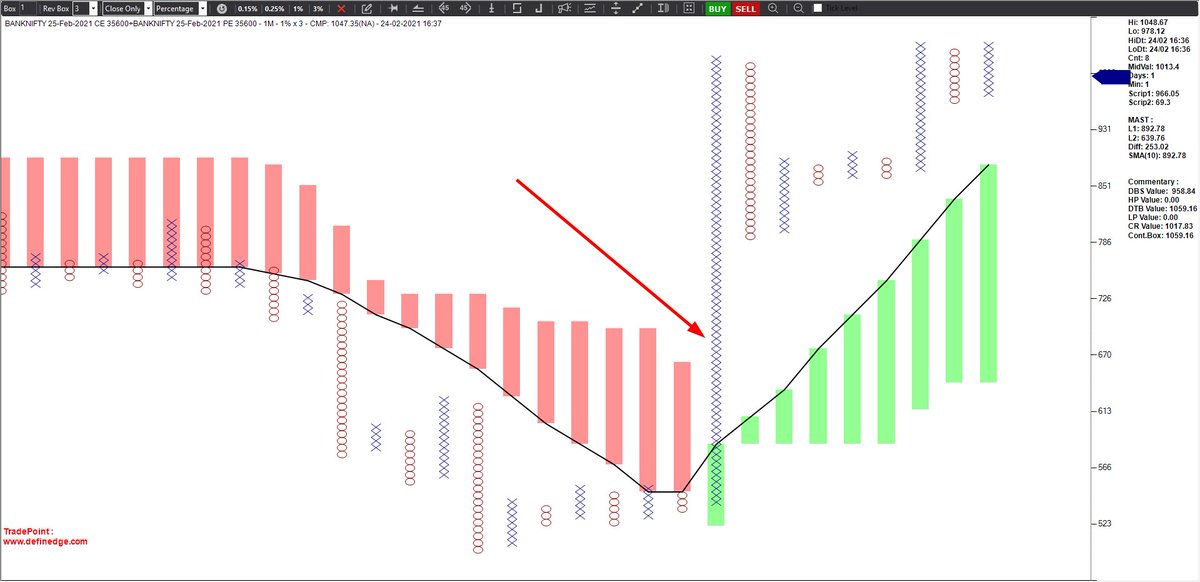
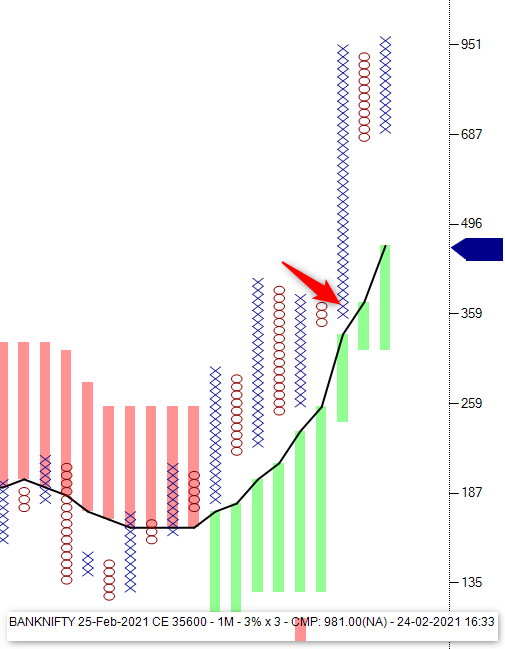
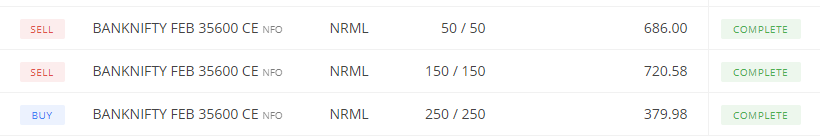
24 Feb 2021
#BankNifty #35600CE
#TriangleBullish
#FollowThrough #ContinuationPatterns
#Price above #MAST
looking at #Bullish #Turtle #Breakout on #Stradle above #MAST traded continuation pattern on #35600CE
Booked most & 2 position open with stop trailed to nearest DBS
Too Fast 😅😅
1
5
15 Feb 2021
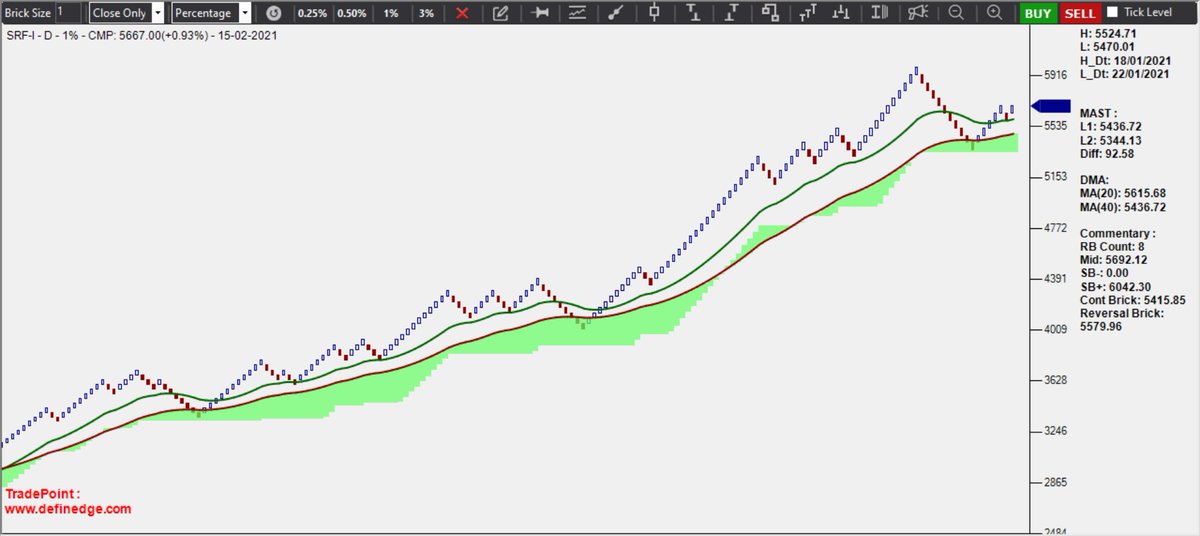
#SRF
#Renko
#OneBackBullish above #MAST & #SMA
#ContinuationPatterns
One Back Bullish is the lowest risk patterns. Stop for brick reversal entry is swing bearish breakout level.
#ObjectivePattern

1
1
11
15 Feb 2021
#Havells All correction (Supply) has been absorbed by Demand.
New probable DTB above MAST is new opportunity to long with L2 as stop / trailing stop. #SwingTrade #Positional #ContinuationPatterns

11