
Great decisions start with great reporting.
Effective data reporting helps businesses uncover trends, measure performance, and identify opportunities faster.
Read more to know how better reporting leads to better outcomes: expressanalytics.com/blog/da…
#DataReporting #Analytics
ALT The Complete Guide to Understanding Data Reporting
2
6

Jun 14
Tell me about her using Data terms:
I will start..
She was my VLOOKUP. Always found what i needed, in any table, any sheet. Then one day - value not found 🤣🤣
#dataanalytics #datascience #datajokes #datavisualization #datareporting #dataengineering
3

May 20
Coming Next Week: Published Reporting – Modernized & Flexible Reporting Tailored to Your Business
Reporting should adapt to your business, not the other way around. Next week, dPlat’s enhanced Published Reporting delivers customizable, automated reporting workflows with flexible formatting, smarter delivery options, and improved operational visibility.
What’s new:
📊 Custom Report Configuration to tailor metrics, layouts, and outputs for client, operational, compliance, and performance reporting needs
🗂️ Flexible Data Presentation with configurable groupings and multi-table reporting for clearer insights and easier analysis
📩 Multi-Channel Report Delivery through the platform, email, or secure SFTP connections to fit existing business processes
⏱️Automated Report Scheduling with configurable frequencies that reduce manual effort and ensure timely delivery of critical insights
Impact: greater flexibility, improved data accessibility, and higher operational efficiency through automated, business-ready reporting workflows.
#DebtNext #dPlat #PublishedReporting #WorkflowAutomation #BusinessIntelligence #OperationalEfficiency #DataReporting #Automation #Innovation

3
4
26

Build a Cross-Tab Report from scratch in Oracle APEX using MaxPrintV2 Report Builder. Bind your data, customize your layouts, and generate professional PDFs in seconds.
Streamline your reporting today at maxprint.io!
#MaxPrint #OracleAPEX #LowCode #DataReporting
1
2
80

12 Nov 2025
📊 Veri Analizi Raporlamak: Sadece Sonuçları, Süreci de Anlatmak
Veri analizi raporları yalnızca elde edilen test sonuçlarını içermekle kalmamalı; aynı zamanda araştırmanın amacını, kullanılan veri setini ve analiz sürecini sistematik bir biçimde açıklamalıdır.
🔹 Araştırma Amacı:
Her analiz, belirli bir araştırma sorusuna yanıt aramak için yapılır. Bu amaç, raporun ilk bölümlerinde açık biçimde ifade edilmelidir.
→ Okuyucu, yapılan analizlerin hangi problemi çözmeye veya hangi varsayımı sınamaya yönelik olduğunu bilmelidir.
🔹 Veri Setinin Tanıtımı:
Kullanılan veri seti, değişkenlerin yapısı, örneklem büyüklüğü, veri toplama yöntemi ve ölçüm biçimleri açıkça tanımlanmalıdır.
→ Analiz sonuçlarının geçerliliği, kullanılan verinin niteliğiyle doğrudan ilişkilidir.
🔹 Analiz Sürecinin Açıklanması:
Veri temizleme, aykırı değer kontrolü, eksik gözlem yönetimi, varsayım testleri gibi süreçler şeffaf biçimde belirtilmelidir.
→ Yalnızca sonuca değil, sonuca giden yola da yer verilmelidir.
🔹 Sonuçların Sunumu:
Elde edilen analiz sonuçları, uygun tablo ve grafiklerle desteklenmeli; tablo başlıkları, değişken adları ve açıklamalar okuyucuya net bilgi sunmalıdır.
→ Rapor, yalnızca teknik bilgi değil, yorumlanabilir bulgu üretmelidir.
🔹 Yorum ve Değerlendirme:
Her bulgunun istatistiksel anlamı kadar, araştırma bağlamındaki önemi de vurgulanmalıdır.
→ “p < 0.05 bulundu” ifadesi tek başına yeterli değildir; bu değerin çalışmanın amacına nasıl hizmet ettiğini açıklamak gerekir.
🎯 Sonuç olarak:
Nitelikli bir veri analizi raporu, yalnızca tablolar ve istatistiksel testlerden değil;
•açık bir araştırma amacından,
•tanımlanmış bir veri setinden,
•şeffaf bir analiz sürecinden
ve
•anlamlı bir yorumlama yaklaşımından oluşur.
💡 Çünkü istatistikte asıl değer, veriden anlam üretme sürecinin doğru, anlaşılır ve bilimsel biçimde aktarılmasındadır.
#VeriAnalizi #Raporlama #İstatistik #BilimselAraştırma #SPSS #R #Excel #DataScience #İstatistikAnalizler #DataReporting
4
59
5,478

28 Oct 2025
Stop drowning in spreadsheets! ⏳ Manual reporting from Amazon, Shopify, and other platforms wastes precious hours. With Ada.im, just ask: "Generate daily sales report across all channels" — and instantly get a stunning dashboard. 📊 #DataReporting #Ecommerce #BI #DataAgent
1
5
294

27 Jul 2025
If you have experience in one of the roles above, please consider signing up via our volunteer form on our website: electiontruthalliance.org/jo…
Thank you!
#Volunteer #Democracy #Recruitment #Nonprofit #VRM #GIS #GeoSpatialMapping #DataReporting #DataReports #Paralegal
1
8
403

11 Jul 2025
Boost Productivity & Avoid Errors: Secrets for Your Team's Success!
#ProductivityTips #TalentRetention #DataReporting #ErrorPrevention #Teamwork #ProjectManagement #BusinessTips #Efficiency #DataAnalysis #Leadership
2
1
3
613

22 Jun 2025
Day 22 of 30 – Data Insights with Abdullateef
Great analysis is only half the job. How you report it drives action. A clear, focused report turns data into decisions. Always ask: does my audience know what to do next?
#DataReporting #DataAnalytics #30DaysOfData
3
27

13 May 2025
Total.js OpenReports - Data that tells a story. Reports that speak clearly. totaljs.com/openreports/ #totaljs #openreports #totaljsopenreports #datareporting #datavisualization #smartreports #reportbuilder #businesstools #nomoreexcel #devfriendly
2
49

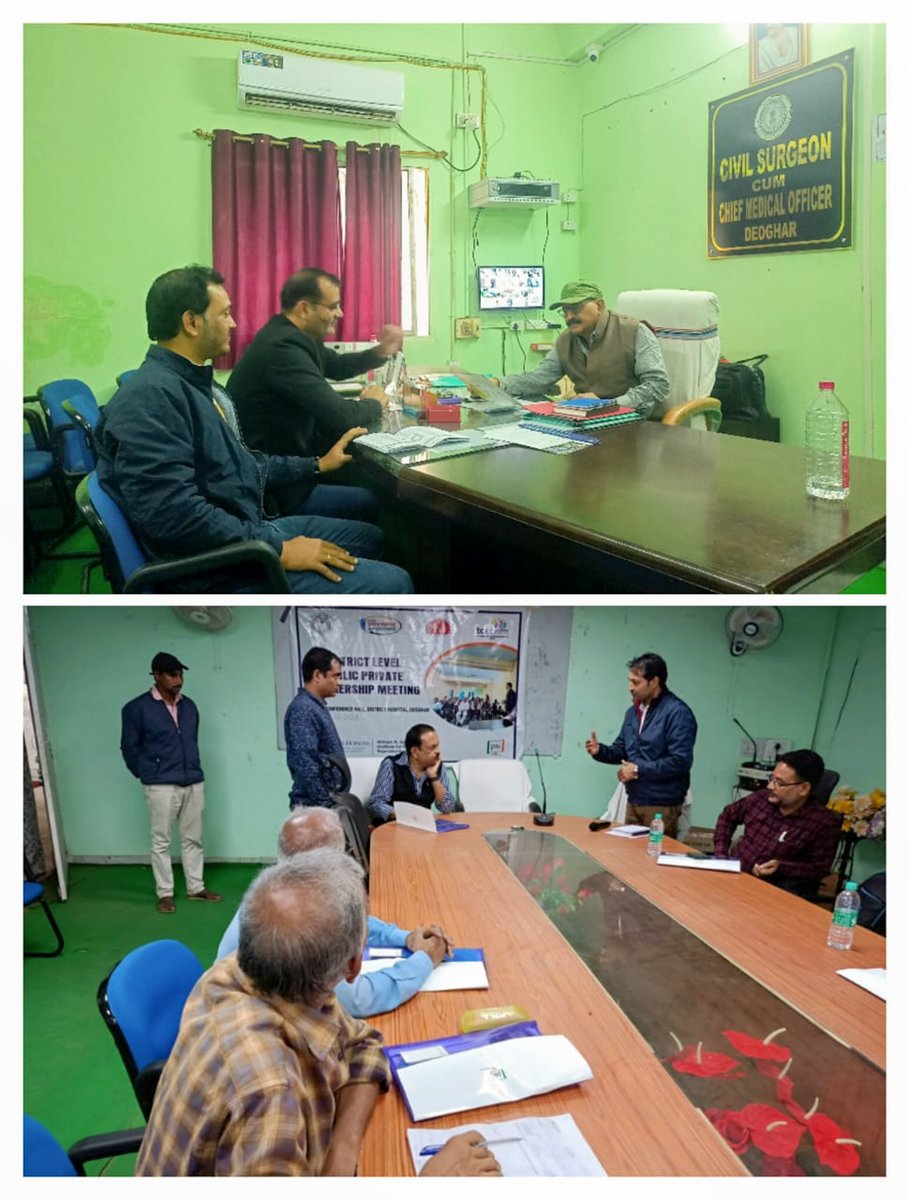
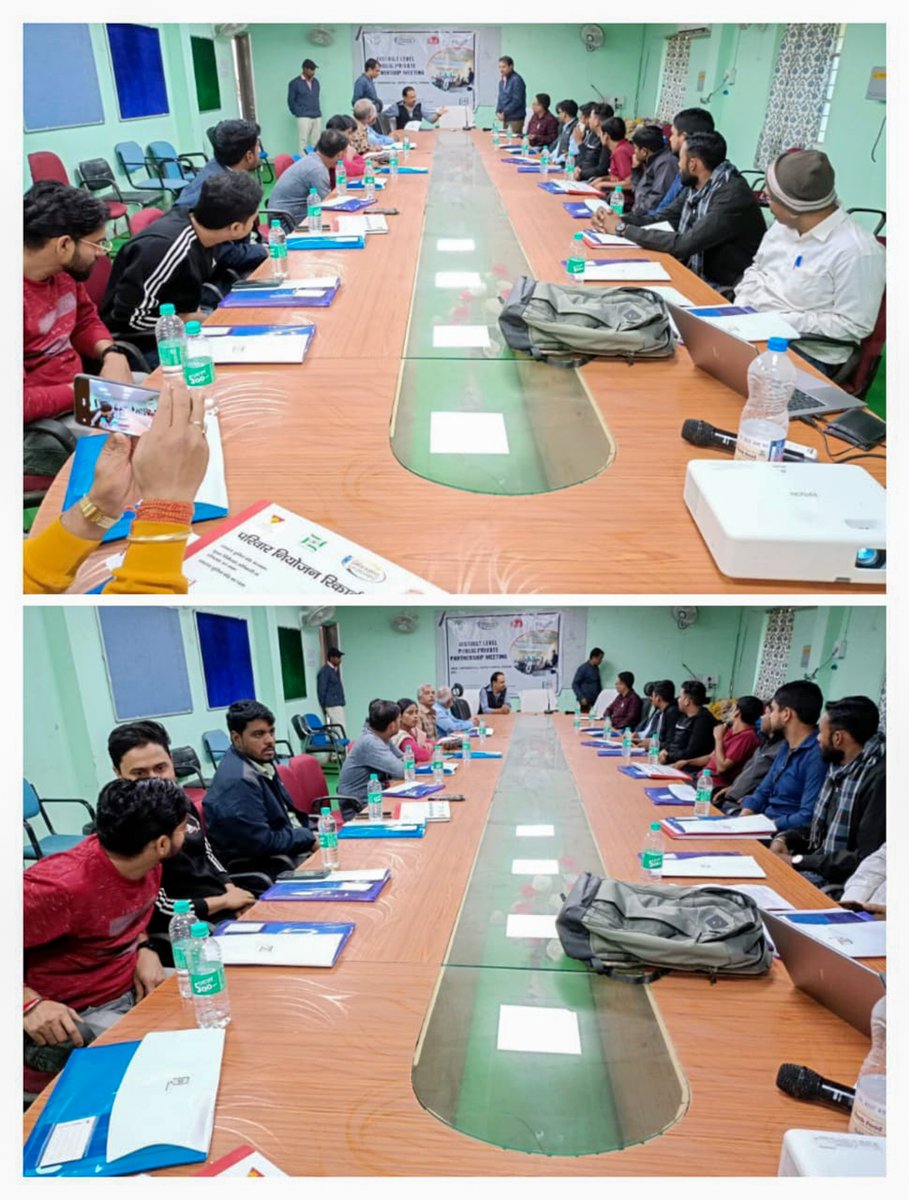
Chaired by the CS, #Deoghar, and led by the district government, TCI India supported the district level #PublicPrivate partnership meeting which was participated by key government officials and representatives from 21 high-volume private facilities. The overall objective of this meeting was to strengthen #DataReporting in the #HMIS.
@tciurbanhealth @GatesJHU @BMGFIndia @usaid_india @BayerIndia @EliLillyandCo @HCL_Foundation @CII4nr @CIFFchild @learning4impact @fprhknowledge @PSIIndia #PSIIndia #EliLillyIndia #Healthcare

6
43
164

16 Dec 2024
SEO is not always easy to quantify.
This common SEO reporting mistake is the proof.
Nikki reveals the biggest mistakes she sees when SEOs compile, prepare, and interpret organic performance in SEO reports.
#seo #seotips #dataanalysis #seoreport #datareporting
2
220

2 Dec 2024
Big tables can be overwhelming! Here's how to report them clearly:
1️⃣Start with overall estimates.
2️⃣Focus on key subgroup differences.
3️⃣Share insights, not every number.
4️⃣Break large tables into smaller ones.
5️⃣Double-check consistency.
#Chisquares #DataReporting #BigTables

1
3
18

22 Nov 2024
#Datareporting is key for providing actionable insights & supporting strategic decisions. Marina Kobzeva, Armin Ghassemi Rudd & Scott Fincher emphasize #KNIME's #Reporting extension as a tool for creating #customizable and #automated reports.
📌 #READ → medium.com/low-code-for-adva…
1
2
4
106

17 Nov 2024
Ensuring Data Trustability: Overcoming Reporting Challenges
#DataTrustability #ReportingChallenges #DataManagement #TrinitySolutions #DataIntegrity #BusinessIntelligence #DataReporting #Analytics #TrustInData #DataChallenges
3
29

12 Nov 2024
Sign up for a 10 minute demo and we will help you run your first report:
Schedule Appointment Now: meetings.hubspot.com/blaine3…
#Demo #DataReporting #ScheduleAppointment #BusinessSolutions #ScheduleNow #FirstReport #Background Screening
2
2
8

5 Nov 2024
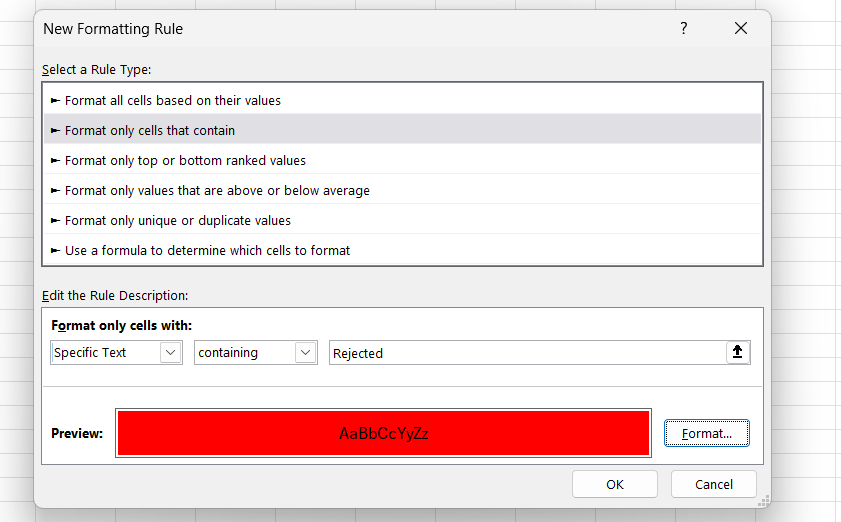
So, Excel is one of the most used tools in data analytics.
As a data analyst, you will use Excel for a lot of tasks such as data cleaning, summarization, reporting, and dashboard generation.
Let's discuss that in this thread.
#DataAnalysis #ExcelTips #ExcelForData #DataAnalytics #ConditionalFormatting #DataCleaning #DataVisualization #Excel2024 #DataReporting #AnalyticsCommunity #DataSkills #DataAnalyst #DataJobsUSA #AnalyticsCareersUSA #ExcelUSA #DataAnalystUK #ExcelUK #AnalyticsUK #DataEurope #ExcelEurope #AnalyticsEurope #GlobalDataJobs #ExcelWorldwide #DataScienceGlobal #InternationalDataAnalysis
1
1
2
63

7 Oct 2024
📊 Elevate your reporting with Powerdrill!
Our AI generates detailed, graphic-rich data reports straight from your Excel files.
Dive into insights effortlessly!
powerdrill.ai/
#DataReporting #PowerdrillAI
2
61

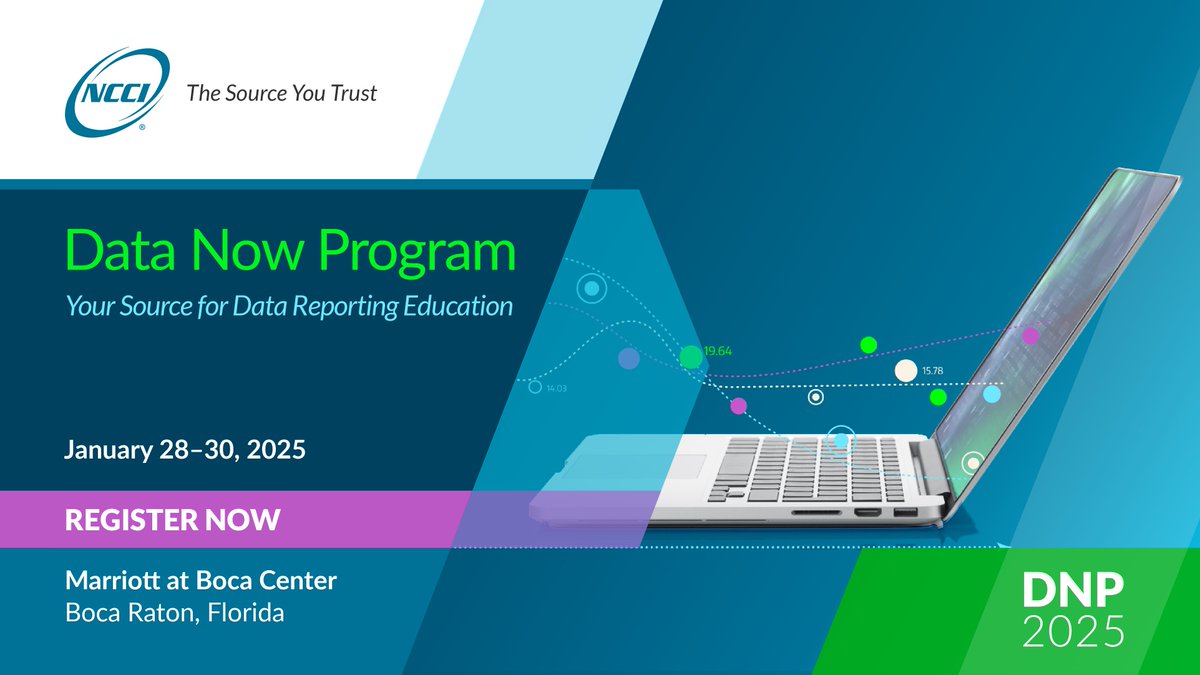
Register now for NCCI’s Data Now Program (DNP)—Your Source for Data Reporting Education. DNP 2025 offers a range of detailed instructional and hands-on classes tailored to enhance your data reporting skills for NCCI. Learn more @ ncci.com/DNP. #ncciDNP #workerscomp #datareporting
2
79

1 Oct 2024
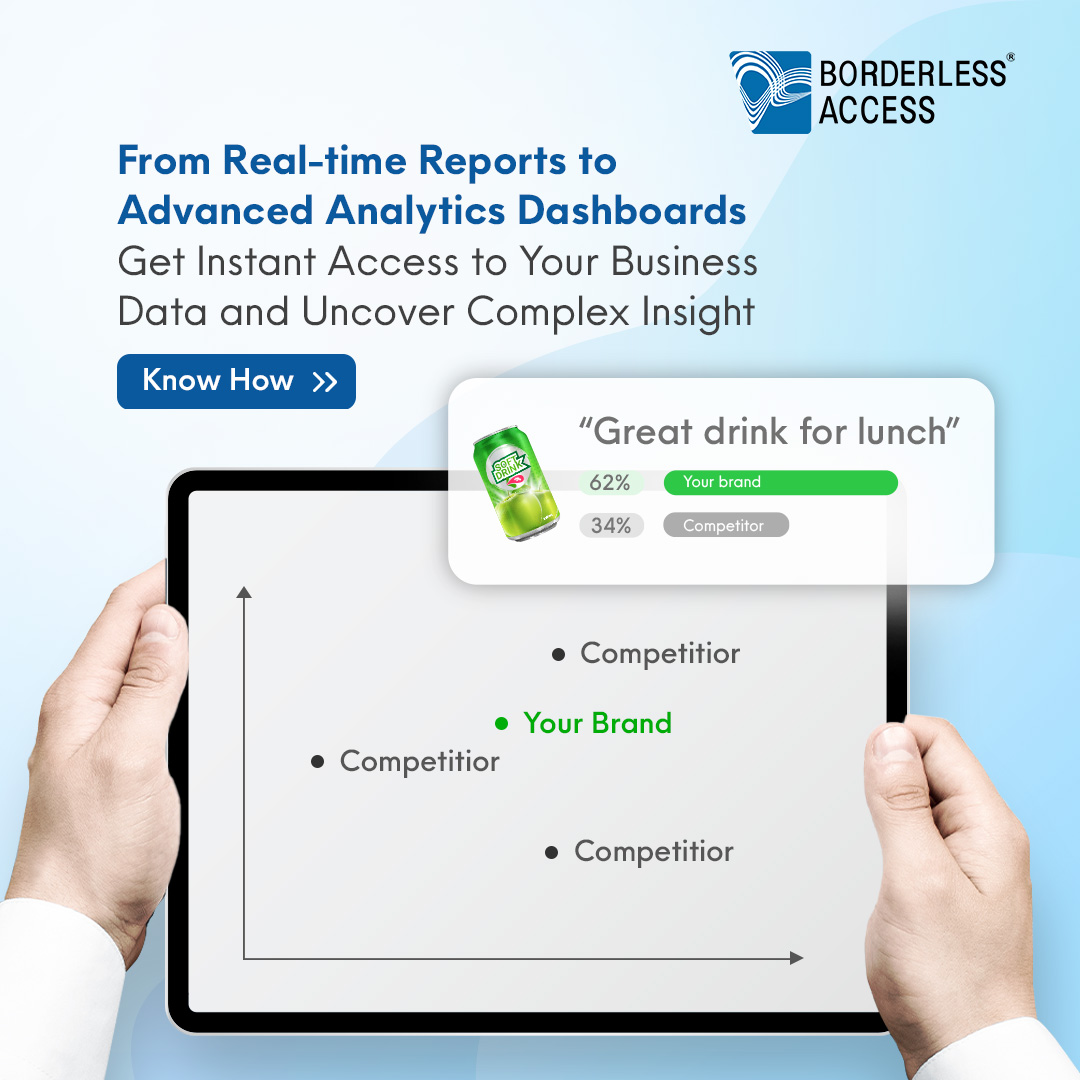
You can now drive your business decisions with visuals that captivate and inform. Our custom data visualization dashboards transform complex information into engaging visuals that unlock strategic insights and drive business growth.
Learn More: bit.ly/3TA85h5
#datareporting #dataanalytics #realtimeinsights #livedashboards #datavisualization #borderlessaccess
1
58