
Jan 8
@hertechtrail
@WofaiEyong @PeaceAielumoh @AsogwaChinenye @OgbonnaUchenna @SundayAnah @JoshuaAti #hertechtrailacademy #HTTDataChallenge
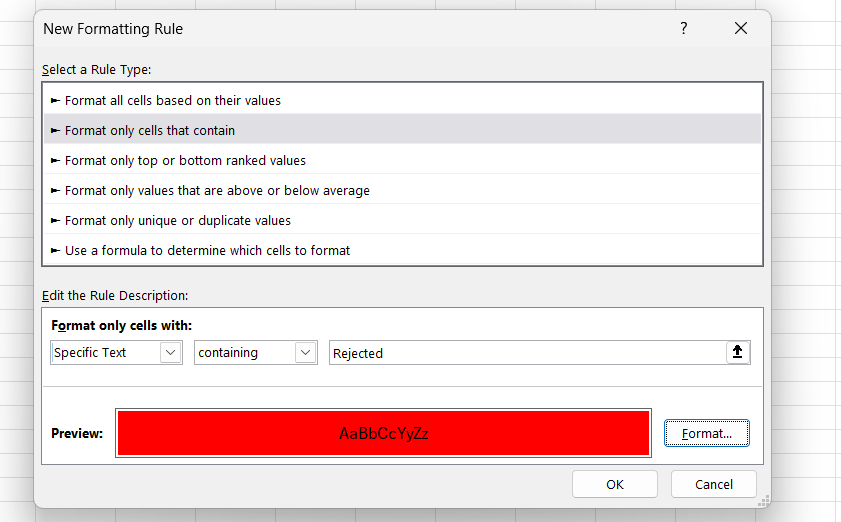
#ConditionalFormatting #DataHighlighting #ExcelForData #DataAnalysis
11

#datafam
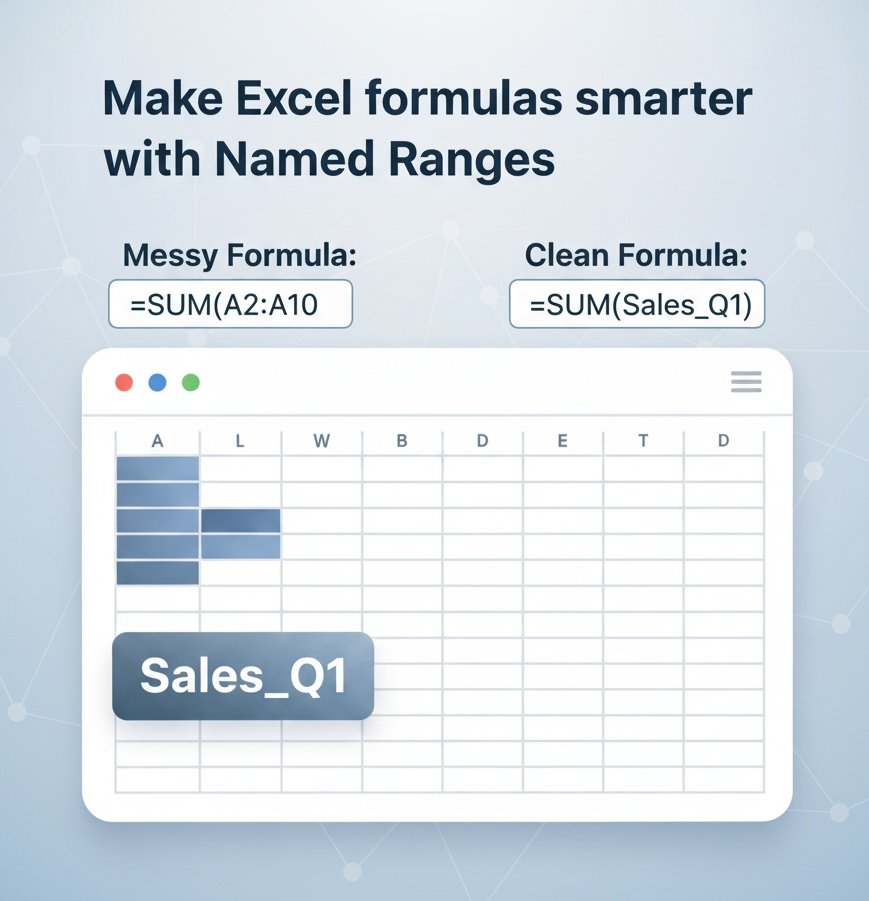
Stop overcomplicating your Excel sheets.
If you find yourself repeating the same calculation, try using Named Ranges.
It makes formulas cleaner and easier to understand.
#excel #ExcelTips #DataAnalytics #TechProfessionals #ExcelForData #DataSkills #AnalyticsMadeEasy
3
101

30 Jul 2025
Quality research needs quality tools. See what drives our analytics forward.
#ExcelForData #SPSSExperts #QualitativeAnalysis #DataSolutions #VerityMetrics

16


12 Jul 2025
📅 Day 14 of #100DaysOfDataAnalysis
Explored Netflix content ratings and show types using Excel 📊
Open to feedback & thoughts!
#DataCommunity #ExcelForData #DataViz
12 Jul 2025

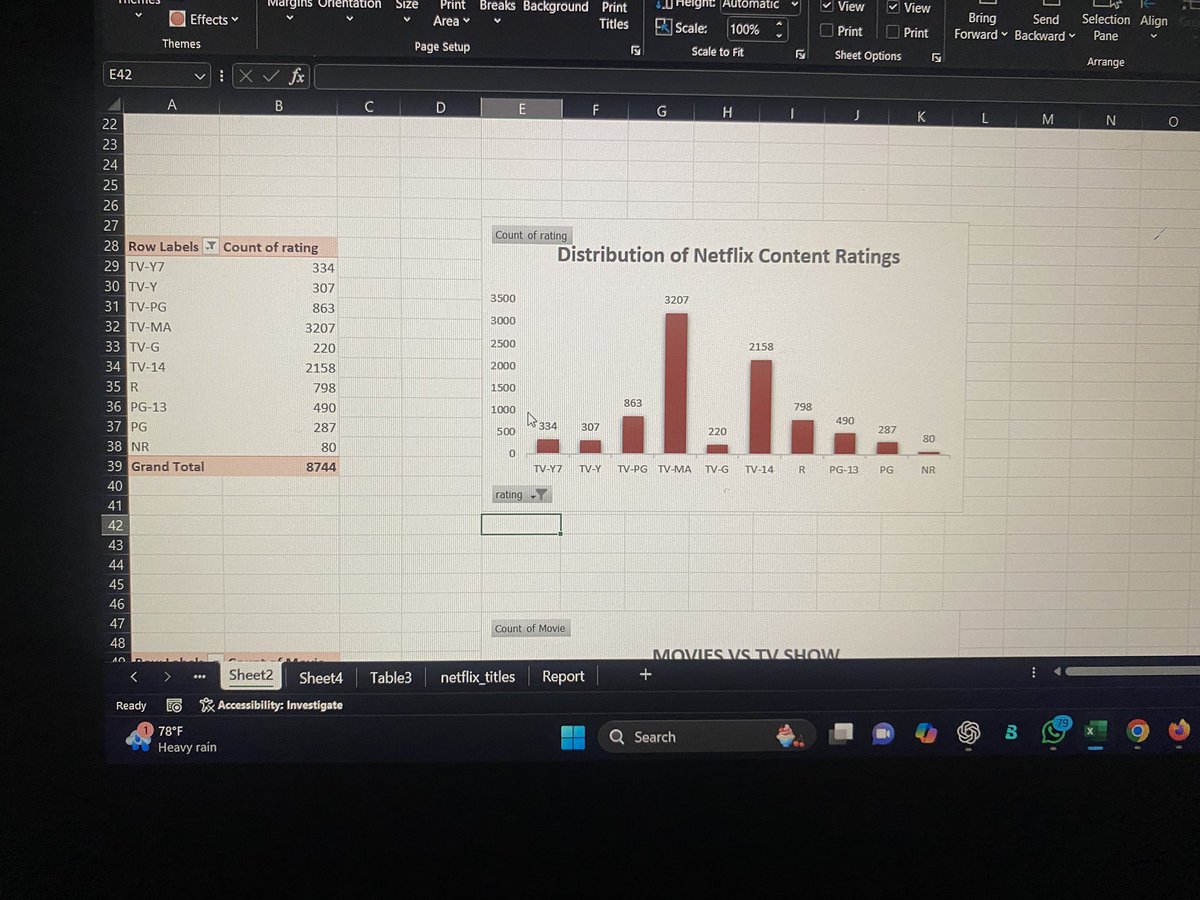
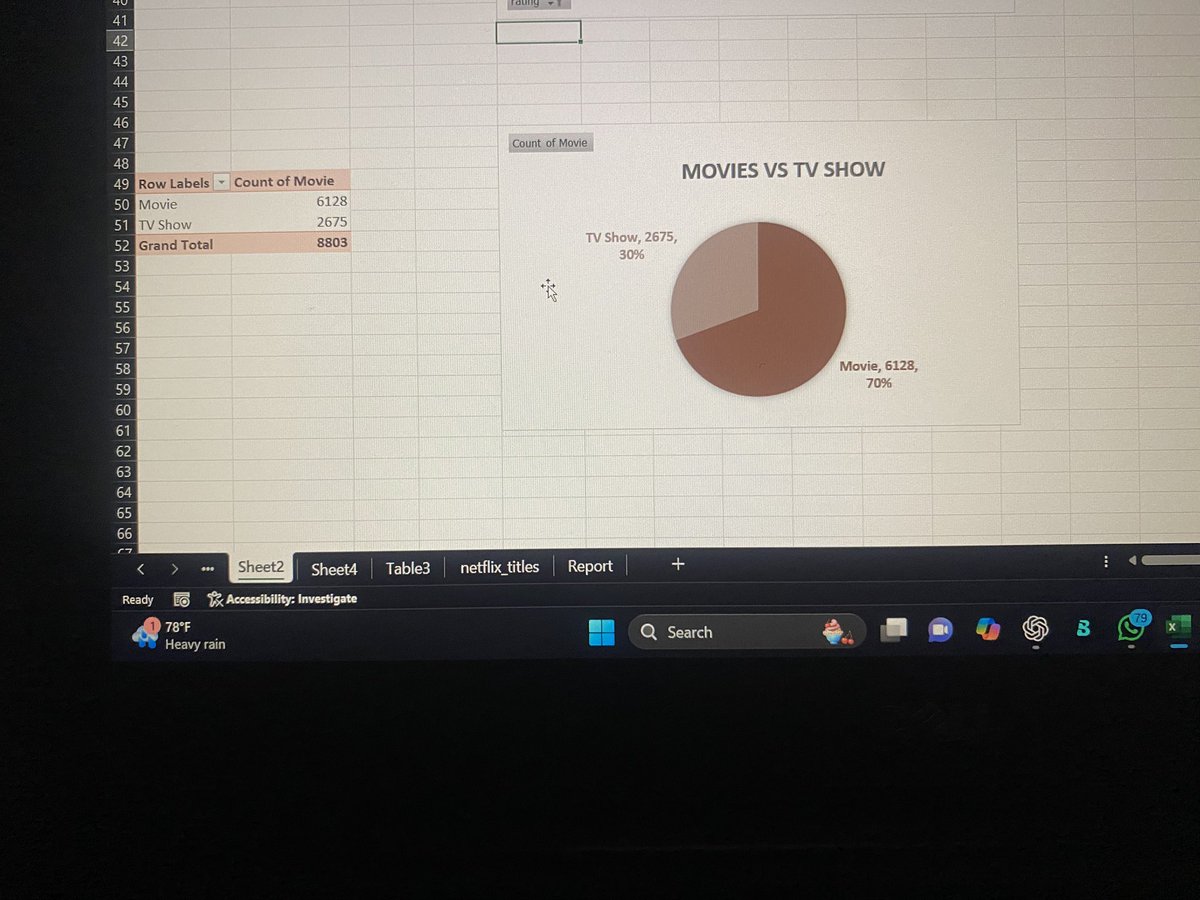
📊 Day 14 of #100DaysOfDataAnalysis
Wrapped up my Netflix dataset with two final visuals:
🔢 Most common content ratings (like TV-MA, PG, etc.)
🎬 Overall breakdown of Movies vs TV Shows
From data cleaning to dynamic charts.
#ExcelChallenge #NetflixData #DataVisualization
1
4
269

7 Jul 2025
📈 Trend analysis made easy! Excel’s charts and graphs help you visualize your data, spot trends, and make data-driven decisions. 💡 #ExcelForData #Analytics #DataVisualization Start now! ➡️ bit.ly/LearnExcelFast
5

4 Jul 2025
Join our Data Analysis with Excel course starting 8th July and learn how to clean,analyze,and visualize data like a pro! Ideal for anyone looking to boost their data skills.Register here Start your journey: predictiveanalyticslab.ai/ex…
#ExcelForData #DataVisualization #ExcelTraining

18
10 Jun 2025
Struggling to make sense of your data? Enroll in our Excel course and learn how to clean, analyze, and visualize data with easy-to-follow tutorials and hands-on practice. Start your journey here: predictiveanalyticslab.ai/ex…
#ExcelForData #DataVisualization #ExcelTraining #LearnData

24

5 Jun 2025
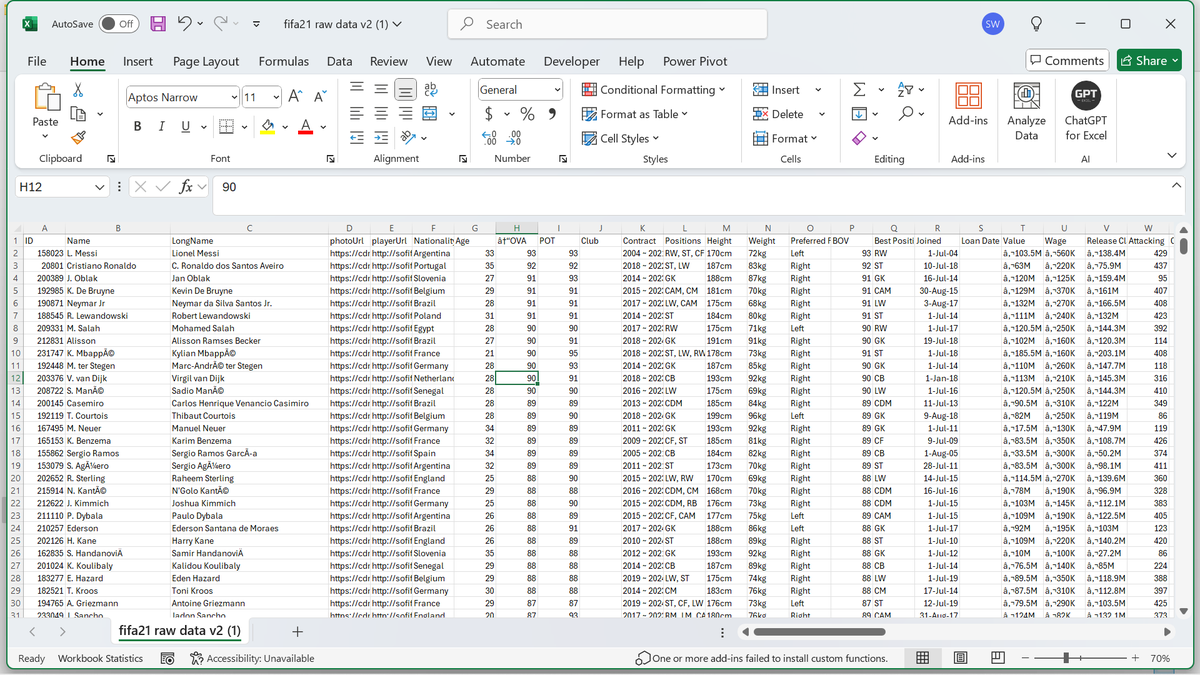
Data cleaning might not be glamorous, but it’s the reason your analysis makes sense.
This FIFA project I turned chaos into clarity using Power Query in Excel.
Check it out below 👇
#CleanDataBetterDecisions #DataCleaning #ExcelForData
5 Jun 2025

Before charts, models, or dashboards, there’s one quiet hero behind every great data project: > data cleaning.
I worked on a FIFA dataset with 18,979 rows & 77 cols full of mixed units, special characters, & missing values. How I tackled it 👇
#DataCleaning #FIFAData #Excel
1
46

1 Jun 2025
Master the Must-Have Skills for a Data Analytics Career!
instagram.com/p/DKXFwohyCWe/…
Join Senseacademy of Technology and turn your passion for data into real-world impact.
#DataAnalytics #Senseacademy #LearnPython #PowerBI #SQLSkills #ExcelForData #senseacademyoftechnology

3
19

11 Feb 2025
📈 Trend analysis made easy! Excel’s charts and graphs help you visualize your data, spot trends, and make data-driven decisions. 💡 #ExcelForData #Analytics #DataVisualization Start now! ➡️ bit.ly/LearnExcelFast
4
11 Feb 2025
📈 Trend analysis made easy! Excel’s charts and graphs help you visualize your data, spot trends, and make data-driven decisions. 💡 #ExcelForData #Analytics #DataVisualization Start now! ➡️ bit.ly/LearnExcelFast

6

5 Nov 2024
When you are working as a data analyst and want to summarize a dataset, a Pivot table is the best option that you have in Excel.
It is simple yet so powerful and being a data analyst, it is your best friend for data summarization.
Let's discuss that in this thread.
#DataAnalysis #ExcelTips #PivotTables #DataSummarization #ExcelForData #Excel2024 #DataSkills #DataAnalytics #DataReporting #ExcelBasics #DataVisualization #DataAnalystLife #DataJobsUSA #ExcelUSA #AnalyticsCareersUSA #DataAnalystUK #ExcelUK #AnalyticsUK #DataAnalystEurope #ExcelEurope #AnalyticsEurope #GlobalDataJobs #ExcelWorldwide #DataScienceGlobal #InternationalDataAnalysis

1
1
33
5 Nov 2024
So, Excel is one of the most used tools in data analytics.
As a data analyst, you will use Excel for a lot of tasks such as data cleaning, summarization, reporting, and dashboard generation.
Let's discuss that in this thread.
#DataAnalysis #ExcelTips #ExcelForData #DataAnalytics #ConditionalFormatting #DataCleaning #DataVisualization #Excel2024 #DataReporting #AnalyticsCommunity #DataSkills #DataAnalyst #DataJobsUSA #AnalyticsCareersUSA #ExcelUSA #DataAnalystUK #ExcelUK #AnalyticsUK #DataEurope #ExcelEurope #AnalyticsEurope #GlobalDataJobs #ExcelWorldwide #DataScienceGlobal #InternationalDataAnalysis
1
1
2
63
7 Oct 2024
Often I see aspiring data analysts get nervous and overwhelmed when they get to know they need to learn a lot of tools to land a data analyst role but that is a wrong approach to think.
Each tool in data analysis solves a different purpose, you can use them for various tasks but after working for a while, you will understand that each tools perform some tasks better than the other.
Before learning a new tool, always try to understand what that tool is being used for in data analysis and what problem does it solve?
When you try to understand the logic behind learning a tool, it become easy to learn it as you have a clear picture about what it solves.
The necessary tools that you need to learn include 𝗦𝗤𝗟, 𝗘𝘅𝗰𝗲𝗹 and a 𝘃𝗶𝘀𝘂𝗮𝗹𝗶𝘇𝗮𝘁𝗶𝗼𝗻 𝘁𝗼𝗼𝗹. If you want to learn more then learn 𝗣𝘆𝘁𝗵𝗼𝗻 and data analysis libraries such as 𝗽𝗮𝗻𝗱𝗮𝘀, 𝗺𝗮𝘁𝗽𝗹𝗼𝘁𝗹𝗶𝗯, 𝘀𝗲𝗮𝗯𝗼𝗿𝗻 and more.
𝗔𝗹𝘄𝗮𝘆𝘀 𝗿𝗲𝗺𝗲𝗺𝗯𝗲𝗿 𝘁𝗵𝗮𝘁 𝗹𝗲𝗮𝗿𝗻𝗶𝗻𝗴 𝗶𝘀 𝗮 𝗻𝗲𝘃𝗲𝗿 𝗲𝗻𝗱𝗶𝗻𝗴 𝗽𝗿𝗼𝗰𝗲𝘀𝘀, 𝘆𝗼𝘂 𝗷𝘂𝘀𝘁 𝗻𝗲𝗲𝗱 𝘁𝗼 𝗴𝗲𝘁 𝗰𝗼𝗺𝗳𝗼𝗿𝘁𝗮𝗯𝗹𝗲 𝘄𝗶𝘁𝗵 𝗶𝘁.
#DataAnalysis #DataAnalystTools #LearnSQL #LearnPython #ExcelForData #VisualizationTools #DataVisualization #DataScienceTools #PythonForDataAnalysis #Pandas #Matplotlib #Seaborn #SQL #ExcelSkills #ContinuousLearning #DataAnalystJourney #AspiringDataAnalyst #DataSkills #TechLearning #DataCommunity #AnalyticsLearning #ProblemSolving #USData #UKData #EuropeData #DataAnalystsUS #DataAnalystsUK #DataAnalystsEurope #USAnalytics #UKAnalytics #EuropeAnalytics #DataScienceUS #DataScienceUK #DataScienceEurope
1
37
27 Sep 2024
📈 Trend analysis made easy! Excel’s charts and graphs help you visualize your data, spot trends, and make data-driven decisions. 💡 #ExcelForData #Analytics #DataVisualization
5

20 Jan 2024
110

12 Jan 2023
12/365
Worked on a mini project to practice the #excel concepts I learnt so far!
Still not done with it though...
#dataanalytics #dataanalysis #excelfordata
12 Jan 2023

techiessss assembleeeeee.
What are you learning / building?
Tell me what you did today or what you’re planning to do.
RT to mark attendance…
1
34
10 Jan 2023
10/365
Started learning Excel today. Was introduced to the standard Excel methods for data exploration such as calculating averages and other statistics using formulas, sorting and filtering.
#dataanalytics #dataanalysis #roadtodata #excelfordata
5
100