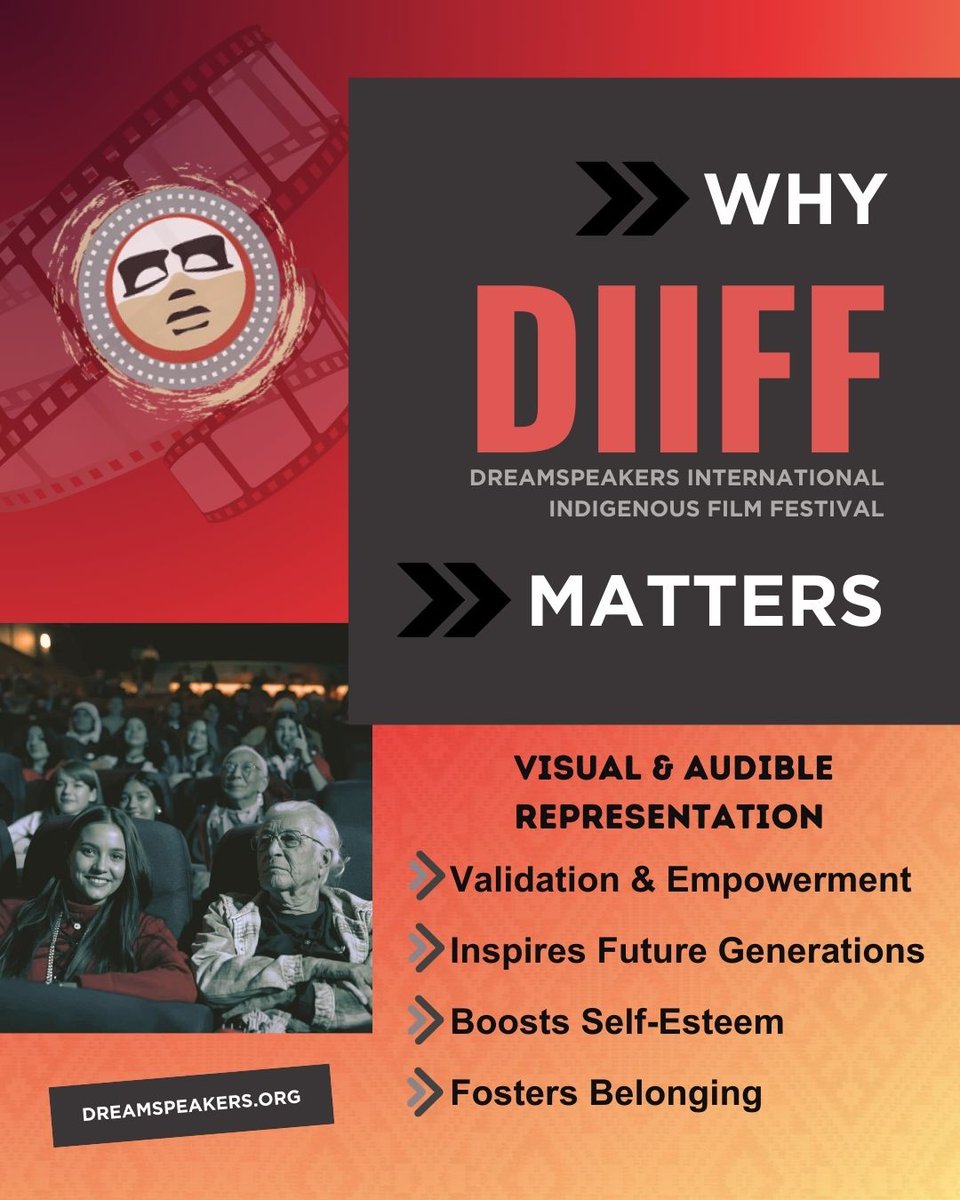
Filter
Exclude
Time range
-
Near
I can't stop doing these prompts. I love science and complex machines and GPT Image 2 is the best at it right now. Prompt: 2x2 grid, 16:9, do this for 4 famous complex machines in our history: { "@ context": " https: //schema.org/ ScientificInfographic", " @ type": "VisualRepresentation", "name": "The Multiscale Landscape of [$SUBJECT]", "artDirection": "Hyper-realistic 3D, nanoscopic macro-lighting, editorial layout", "subjectOf": { "@ type": "ComplexSystem", "name": "[$SUBJECT]", "hasPart": [ { "@ type": "MacroStructure", "description": "Semantic inference of the outermost boundary/envelope", "renderStyle": "Ultra-realistic surface photography", "uiAnnotation": "Floating tag with material/surface properties" }, { "@ type": "MesoStructure", "description": "Semantic inference of internal mechanics/capsid", "renderStyle": "Exploded CAD cutaway", "uiAnnotation": "Floating tag with structural symmetry/engineering tolerances" }, { "@ type": "MicroStructure", "description": "Semantic inference of raw code/genome/atomic lattice", "renderStyle": "Glowing abstract data vectors", "uiAnnotation": "Floating tag with mathematical/genetic sequences" } ] }, "visualConnectors": "Energetic transitions and dotted assembly pathways linking the layers", "background": "Dark studio void with atmospheric fog" }
3
10
54
1,600
Why DIIFF Matters... 1. Inspires Future Generations 2. Boosts Self-Esteem 3. Fosters a Sense of Belonging #indigenousrising #indigenousstorytelling #dreamspeakersfilmsociety #intergenerationalhealing #standtall #visualrepresentation #takeupspace
1
2
15
#Scifiart combines the aspects of (natural) #sciences and #art. It is quite an obvious #combination, as anyone who has dealt professionally with biological structures, and especially with their #visualrepresentation, knows. #Microscopic #photography, #macrophotography, or the different kinds of #electronmicroscopy, in particular, can depict organisms and #details of their #structures, resulting in a visual experience that differs very remarkably from a normal everyday visual perception, especially of non biologists. In such #visualizations one sees the world from a completely new perspective, which fully naturally also appeals to aesthetic sensibilities in an eye catching and inspiring or even motivating way. When for example biologists want to visualize scientific relationships in the form of a drawn #illustration, they are naturally even more concerned with considering aesthetic needs already from the beginning on of their work. For example, if one wants to use biological illustrations, regardless of whether they are photos, (digital) drawings or (digital) paintings, to let them speak for themselves to a large extent, in order to inspire in particular non-scientists with the #beautyofnature for example to develop more interest in nature and its protection, then the aesthetic requirement even predominates. An aesthetic and creative component is added to the presentation of scientifically relevant content by the fact that aspects such as the balance of the #imagecomposition, the #colorpalette used, or, especially in photographic representation, the #perspective shown, are able to interest and touch viewers not only in terms of content or aesthetics, but also #emotionally. © text #StefanFWirth November Berlin 2025
Seeing Science Art Everywhere: Exploring Food Chemistry. A 3D porous structure inside the raised edge of a pizza. #sciart #food #chemistry
4
150
1,062
Tiny thing I added to my sonas design is cowlicks on top of the pigtails! I have a super annoying cowlick on my bangs, so I wanted to incorporate it into my sonas design in a fun way. Visualrepresentation of how the hair looks down
4
2
12
317
29 Jun 2025
Then, we had @daniel__pascual's presentation on the rhetorical patterns emerging from the combination of #pragmaticstrategies in #researchprojectwebsites 🖥️ Afterwards, Isabel Corona reflected evolution of the #visualrepresentation of #mentalissues, from "illness" to "health".
1
2
351
Visual representations such as charts, graphs and tables make complex data more accessible and understandable. You have to choose the right type of visualization for your data and ensure it is clear and well-labelled. #visualrepresentation
1
12