
TradFi Trader (2007-18) → Web3 Veteran since 2019 | 1K Projects Farmed | Community Builder | X Growth Strategist | Building xBL⭕CK on Discord (Link soon)
Joined September 2024
- Tweets 25,017
- Following 4,778
- Followers 4,776
- Likes 19,300
3,194 Photos and videos


Pinned Tweet

May 10
I am starting a 75-day series on #DeFi.
Zero to Pro Max. One thread every single day.
If you have ever been confused about how DeFi actually works, this series is for you.
Save this. You will want to come back to it.
🧵

89
39
189
48,369
xBL⭕CK retweeted
Jun 12
☀️ Good Morning, 𝕏 & #ITIA Family!
If you're feeling demotivated today, read this:
You don't need to have everything figured out.
You don't need to be where someone else is.
You don't need to win the entire race today.
You only need to take the next step.
The mind loves to focus on how far there is left to go.
Winners focus on how far they've already come.
Progress is rarely dramatic.
Most of the time, it looks like showing up when you don't feel like it.
Trying again after a setback.
Believing in yourself before the results arrive.
Your current chapter is not your final destination.
Keep going.
One day you'll look back and realize that the days you wanted to quit were the days that built you.
Have a beautiful day, 𝕏. 🤍
ART By @IThinkItsArt

16
7
29
2,967
xBL⭕CK retweeted
23h
GM ☕✨ GN 🌙😴 EVERYONE
Some connections don’t need loud words.
They live in a quiet space between two hearts,
where even silence feels full.
Soft energy today.
Protect what feels real. 🖤✨
Art by @IThinkItsArt
#ITIA

20
2
24
716
16h
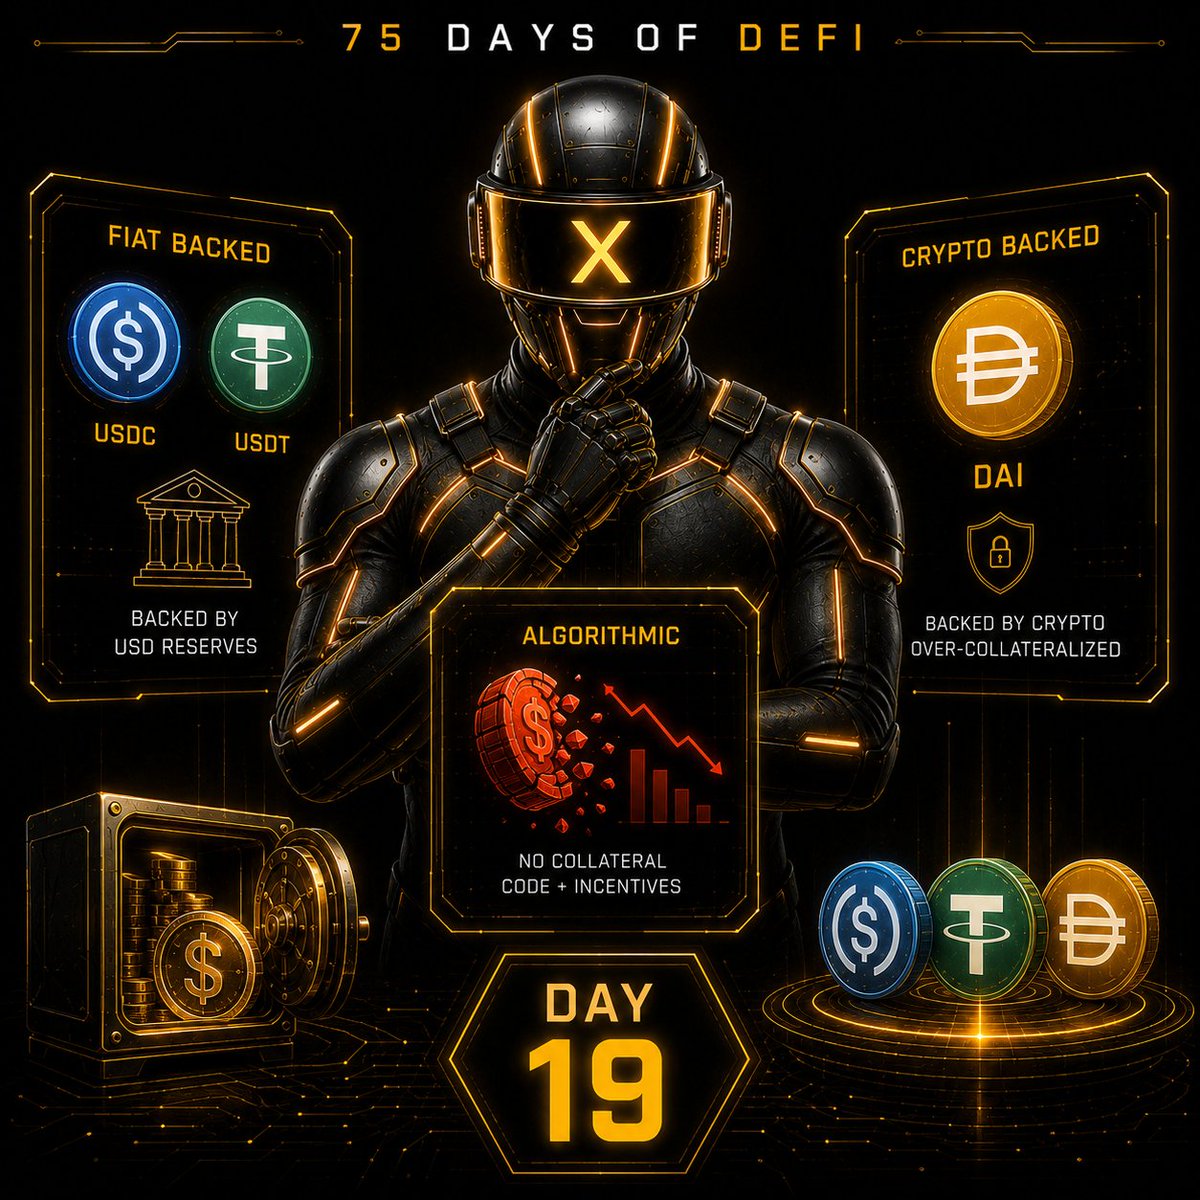
Three stablecoins dominate #DeFi.
All three are worth one dollar.
But they are not the same.
The differences between them could determine whether you lose everything or not.
Here is the honest comparison.
🧵👇

4
11
219
16h
Shoutout to the real ones who showed up and supported Day 19. This series grows because of you.
Reposted and Liked
@thatquietboyyy
Commented and Liked
@TheBTCKnight
@MikeThaMac
@mayaivanoff
@PatrikBatCrypto
@CryptJoh
@Albraju36
Liked only
@Alphaa_Hub
@HunterAllen4
@XZNSEI
@369muscari
@Brikka_trading
@Neni536975
@_deswiftfx
@LadyOffCryrs
@0xlynkr
@dogecoin349
@orangepilldev
@pajarosaldarria
Go follow each other, engage with each other's content, and grow together. That is how this community becomes something real.
If you want to be featured in the next shoutout then
Repost or Quote this thread and drop a comment and Like
I read and reply to every single one.
2
2
53
16h
Day 21 drops tomorrow and we get into one of the most misunderstood ways to earn in DeFi.
🟡 Day 21 What is Yield Farming
Follow and turn on notifications so you do not miss it.
3
40
17h
Homework done. #CAMT.
Camtek. Israel-based. Founded 1987. All-time high May 11, 2026.
Top three globally in semiconductor metrology and inspection for advanced packaging and HBM.
The thesis in numbers:
→ $105M in AI-focused orders announced June 2
→ $55M from a tier-1 OSAT. $50M in Hawk systems for HBM
→ H2 2026 guidance: 25% revenue growth vs H1
→ 50.97% gross margins
→ Revenue visibility extended into 2027
Every HBM stack manufactured for AI needs inspection at multiple stages.
HBM demand is not slowing.
Camtek's order book reflects that directly.
The fiber bottleneck. The power bottleneck. The cooling bottleneck.
Nobody talks about the inspection bottleneck.
This is it. 🎯🔶

Making a DD post on a cool stock breaking a 26 year high. Seems cool.
Top three globally in niche.
Still under 3B market cap.
Go do some homework
$AMKR 8%
$CAMT 4%
$ROKU 20%
$ONTO 6%
All making higher moves yesterday. 💪
Follow some more legends while you search. 👀
@longriverCM @ZeekTyt @Vance_Roberts5 @MoonWalkerTrd @HeuristicHomie @Twills08 @b_co_co @khawatmiTradez @BullMarketBoss @FindleysFinance @MoMoMacro @JungleStocks @JinJung @XYZalerts @0xAiBlock @Juls_Finance @MZohaibKhan92 @ant_trading1 @seahorse_anton @AntTradesHQ @Alleninvests @Jupiterian_Tech @napoleon21st @peterli34923561 @kurrensy_trades @RealJoeTrades @steady_profits @trevhesinvests
Any guesses?
3
5
144
May 10
I am starting a 75-day series on #DeFi.
Zero to Pro Max. One thread every single day.
If you have ever been confused about how DeFi actually works, this series is for you.
Save this. You will want to come back to it.
🧵
89
39
189
48,369
17h
🟡 Day 19 🧵Types of Stablecoins Fiat Crypto Algo👇
x.com/0xAiBlock/status/20647…
Jun 10

Not all stablecoins are created equal.
Some are backed by #dollars in a bank.
Some are backed by #crypto in a smart contract.
Some are backed by nothing but math and hope.
One of these has already collapsed and taken billions with it.
🧵👇
4
32
xBL⭕CK retweeted
22h
Elon & His 4,000 New millionaires Enjoying life like this 👇
4
6
18
3,909
20h
🚨 What's happening right now in #Bitcoin already happened in 2022
Same chart. Same pattern. Different scale.
Every prior cycle followed this exact sequence:
Top 1, correction, Top 2, bull trap, then the real drop to bottom.
2017: Top 1 → Correction → Top 2 ($19,800) → 120 day range with a bull trap → dump → Manipulation → Accumulation →
Here drawdown was 84%
2021: Top 1 → Correction → Top 2 ($69,000) → 120 day range with a bull trap → dump → Manipulation → Accumulation →
Here drawdown was 77%
2026: Top 1 → Correction → Top 2 ($126,296) → 120 day range with a bull trap → dump → Manipulation → Accumulation →
Currently priced at $63,800
Here drawdown is till today, 49%.
That is now past the halfway mark to matching the 2021 drawdown.
If the bottom timing rhythm holds (410 days after the 2013 top, 363 after 2017, 376 after 2021), the projected bottom window is late September to mid November 2026.
The 200 week MA sits around $68,800. Price is now trading below it.
The chart is not predicting doom. It is showing where we are in a pattern that has repeated three times.
The question is no longer whether the correction is real. It is how deep it goes before the next phase begins.
Not financial advice. 🛑
Turn on notifications and drop your thoughts below. 🔔
More pain is coming. Be ready for that. ⚠️
$BTC #Bitcoin
3
9
912

21h
Most investors still view #AMZN as a single story.
It's not.
Amazon has at least 5 independent growth engines:
• AWS growth
• AI demand
• Ad expansion
• Margin expansion
• Logistics & fulfillment
The fifth engine is the most overlooked.
Amazon's delivery network now moves more parcels in the U.S. than UPS and FedEx. Its regionalized fulfillment model has already reduced costs, improved delivery speeds, and is creating operating leverage that many analysts still underestimate.
The bull case isn't that all 5 engines fire at once.
It's that they don't have to.
The real debate is macro.
Consumer spending remains uneven. AWS faces tougher comparisons as cloud optimization normalizes. And with rates expected to stay higher for longer, multiple expansion has limits.
At current levels, #AMZN is less a valuation story and more an earnings growth story.
If the engines keep compounding, the stock likely works.
The question isn't if.
It's how long the market takes to fully price it in.
Not Financial Advice. Do Your Own Research.
Growth is Loading will print more millionaires in the future.
23h

Amazon has something most mega-caps don’t
Multiple ways to surprise investors:
• AWS growth
• AI demand
• Ad expansion
• Margin expansion
Bought more $AMZN yesterday

2
1
9
155