


ALT OpenTopography topographic differencing with NOAA lidar shows how the Earth’s surface changed from 2010-2014. The left image shows a lidar hillshade. In the right image, the difference between the 2010 and 2014 datasets is shown. Red indicates where the land surface moved down or was eroded. Blue shows where the land surface moved up or where material was deposited. Topographic analysis of these older lidar datasets indicates that landslide activity has been persistent in this area for decades.


ALT Hillshade of Taranaki Volcano, NZ. Credit LINZ LDS.


ALT 3D prints of pre-Oso landslide (left) and post-Oso landslide (right) made using stereolithography (SLA) resin 3D printing.
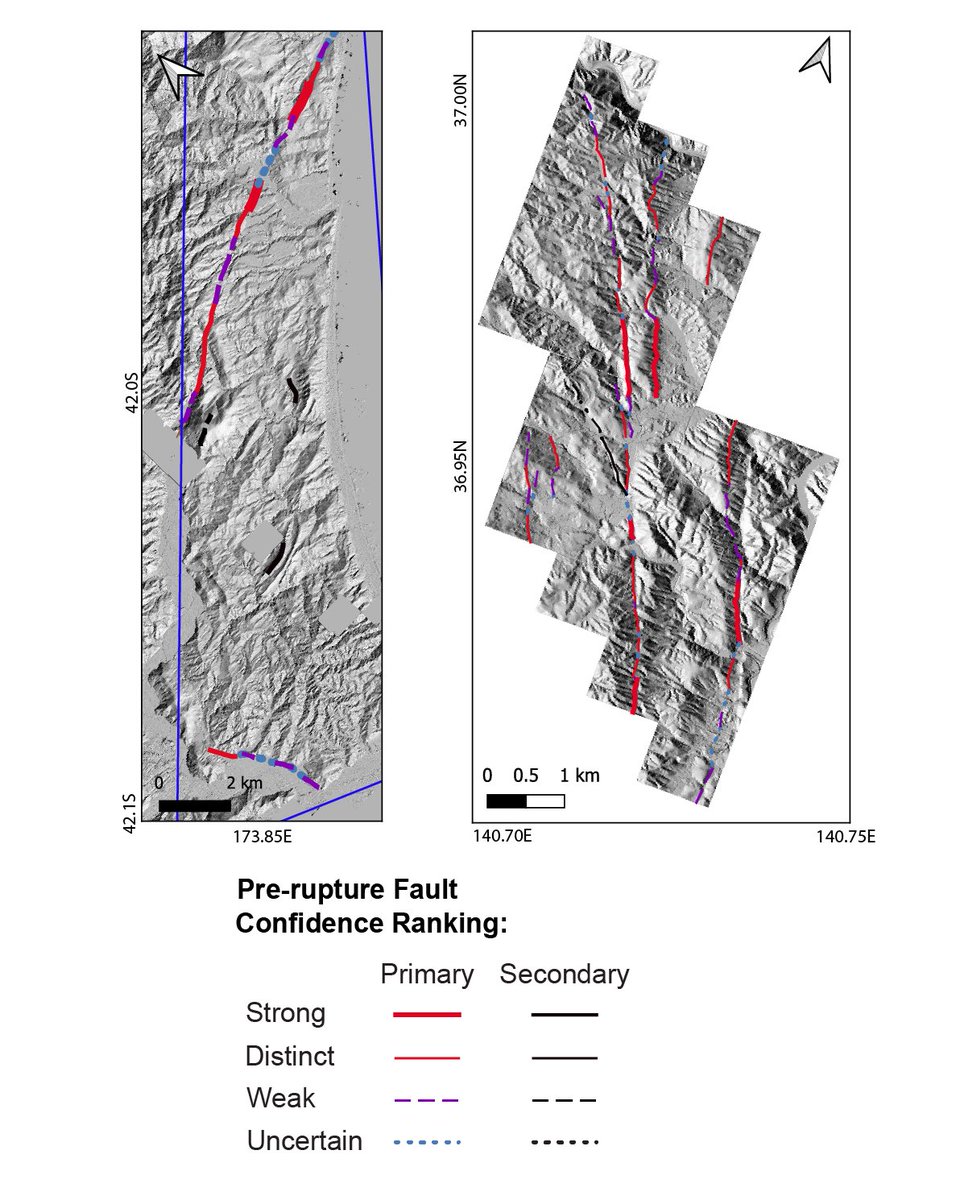
ALT Predictive pre-rupture fault maps of the 2016 M 7.8 Kaikoura, New Zealand, earthquake (left) and the 2011 M 6.6 Fukushima-Hamadori, Japan, earthquake (right) based on indicative surface features. Image credit: Dr. Chelsea Scott.

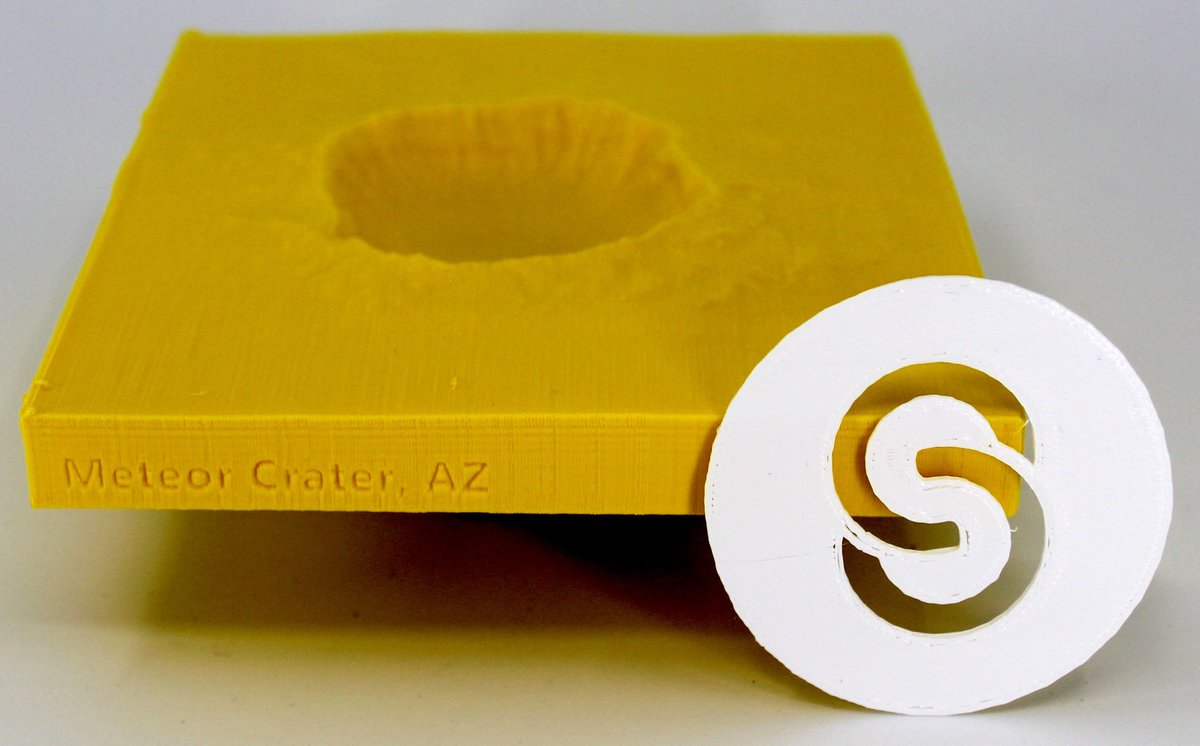
ALT 3D print of Meteor Crater with Scottsdale Community College logo.
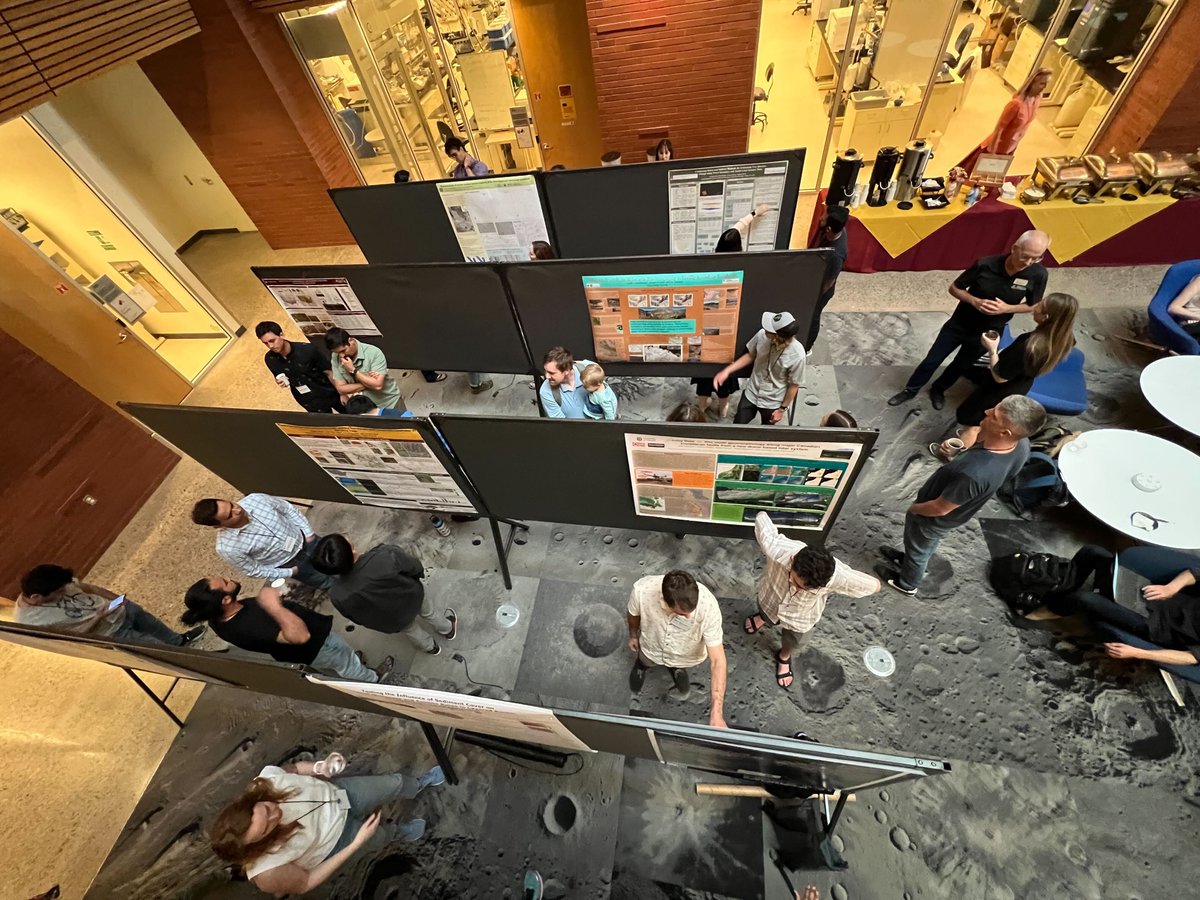
ALT Workshop poster session.

ALT Keynote lecture by David Shean, UW.

ALT lidR training session.
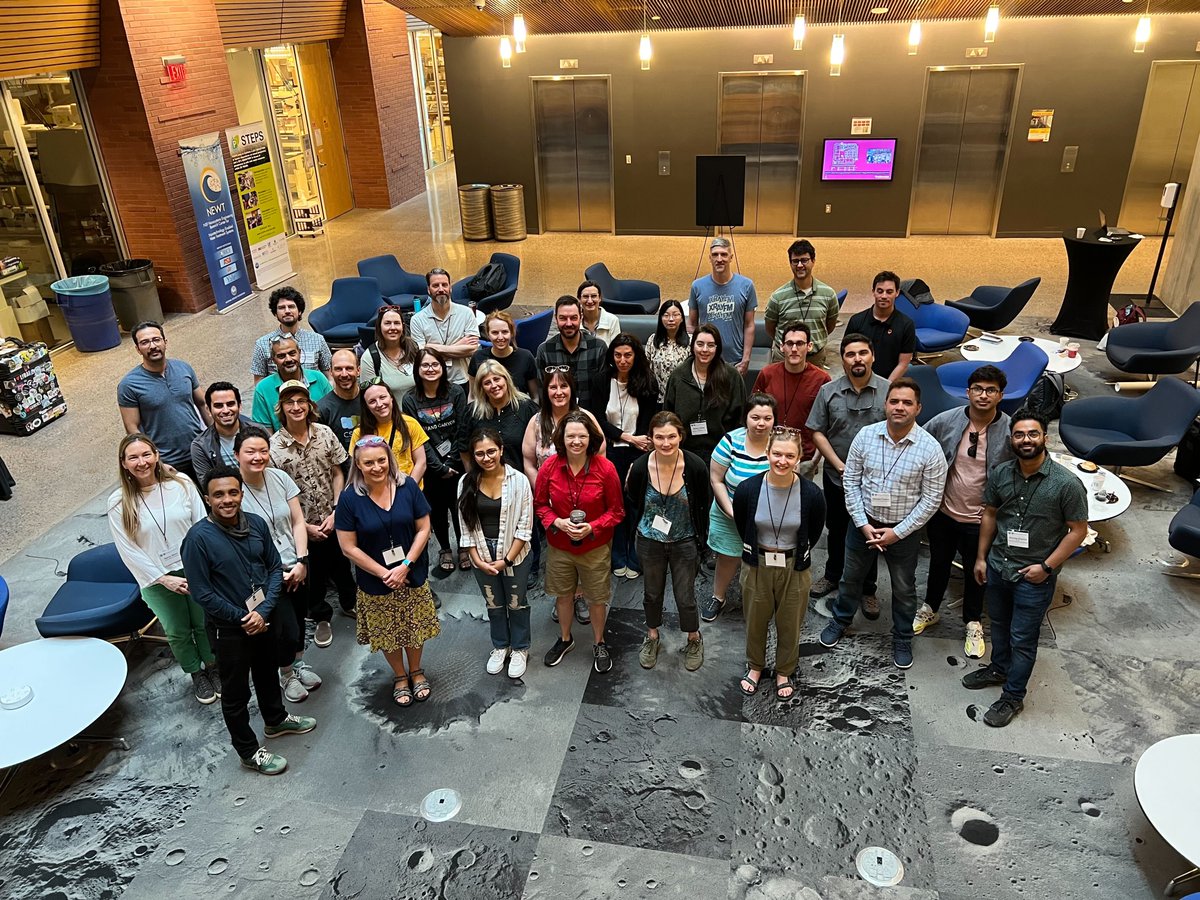
ALT Group picture.
ALT Screen capture of the article.


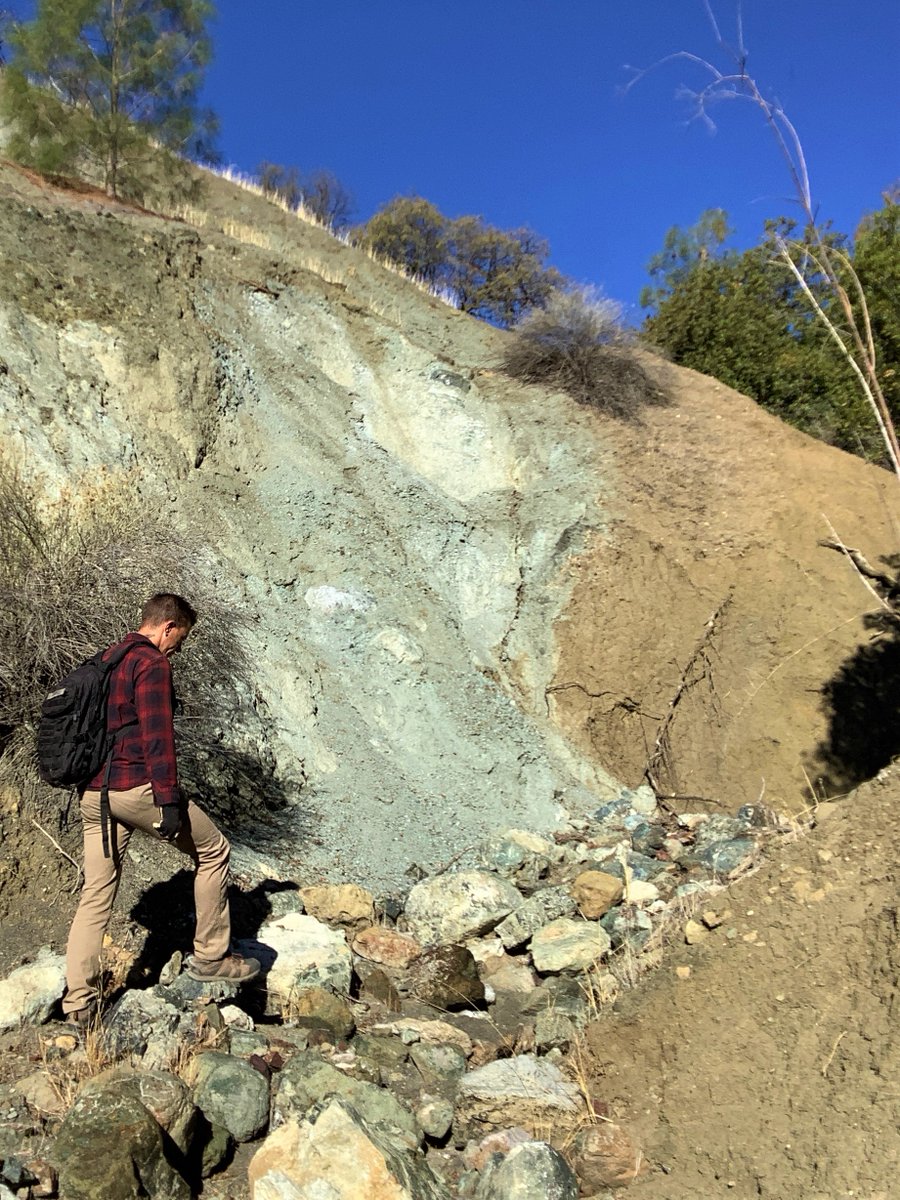
ALT ASU School of Earth and Space Exploration graduate student Joseph Powell in front of the San Andreas fault exposed in a canyon wall. The fault here is marked by white and grey rocks that are highly altered and damaged in the fault zone in up against reddish-brown sediments adjacent to the fault zone. A subtle topographic scarp (the change in slope behind the bush at the top of the fault zone) continues out of view.
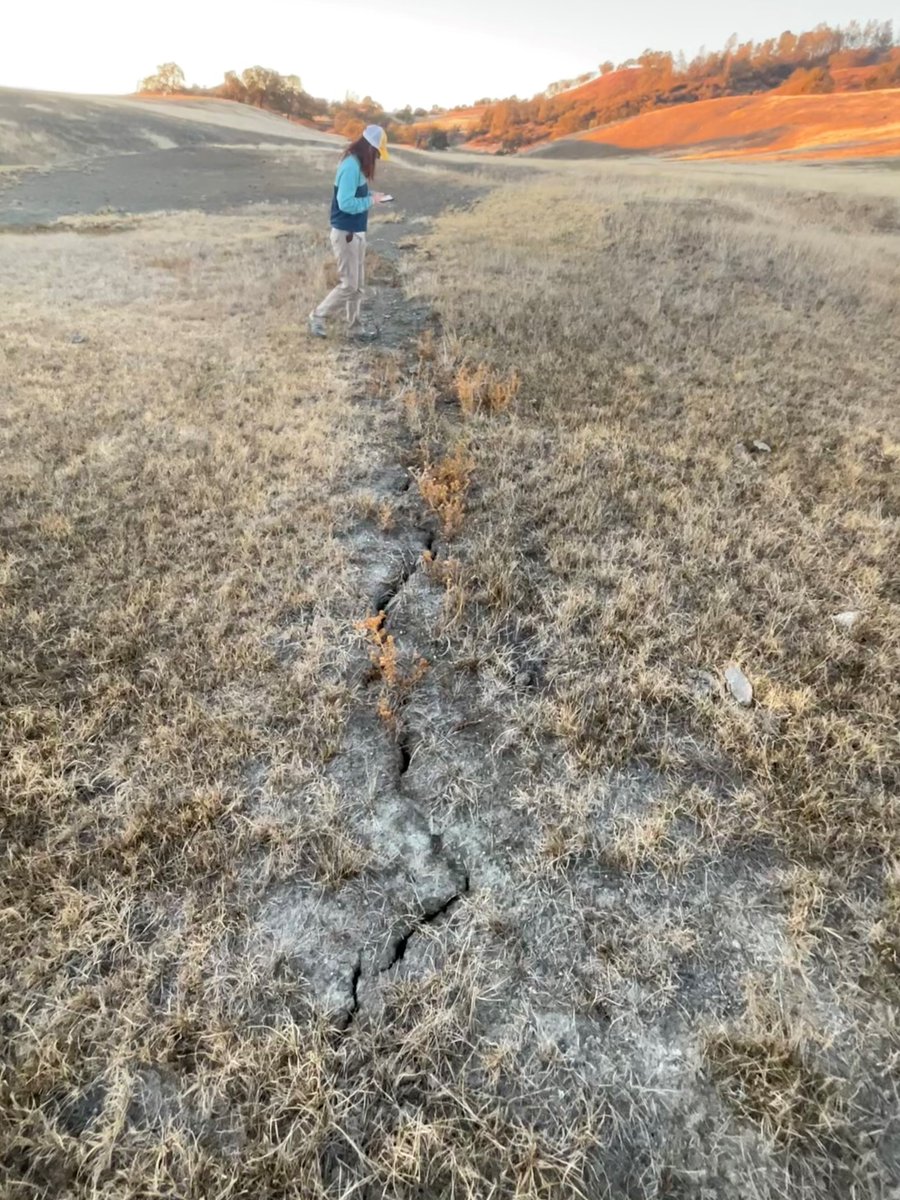
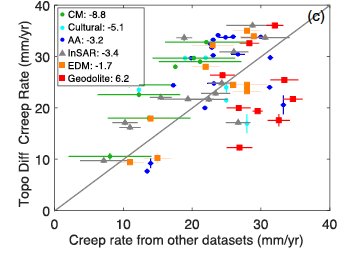
ALT ASU School of Earth and Space Exploration graduate student Mindy Zuckerman documents surface cracking that is a result of ongoing fault creep through very dry soils. This section of the San Andreas fault creeps at about one inch per year without the occurrence of earthquakes.
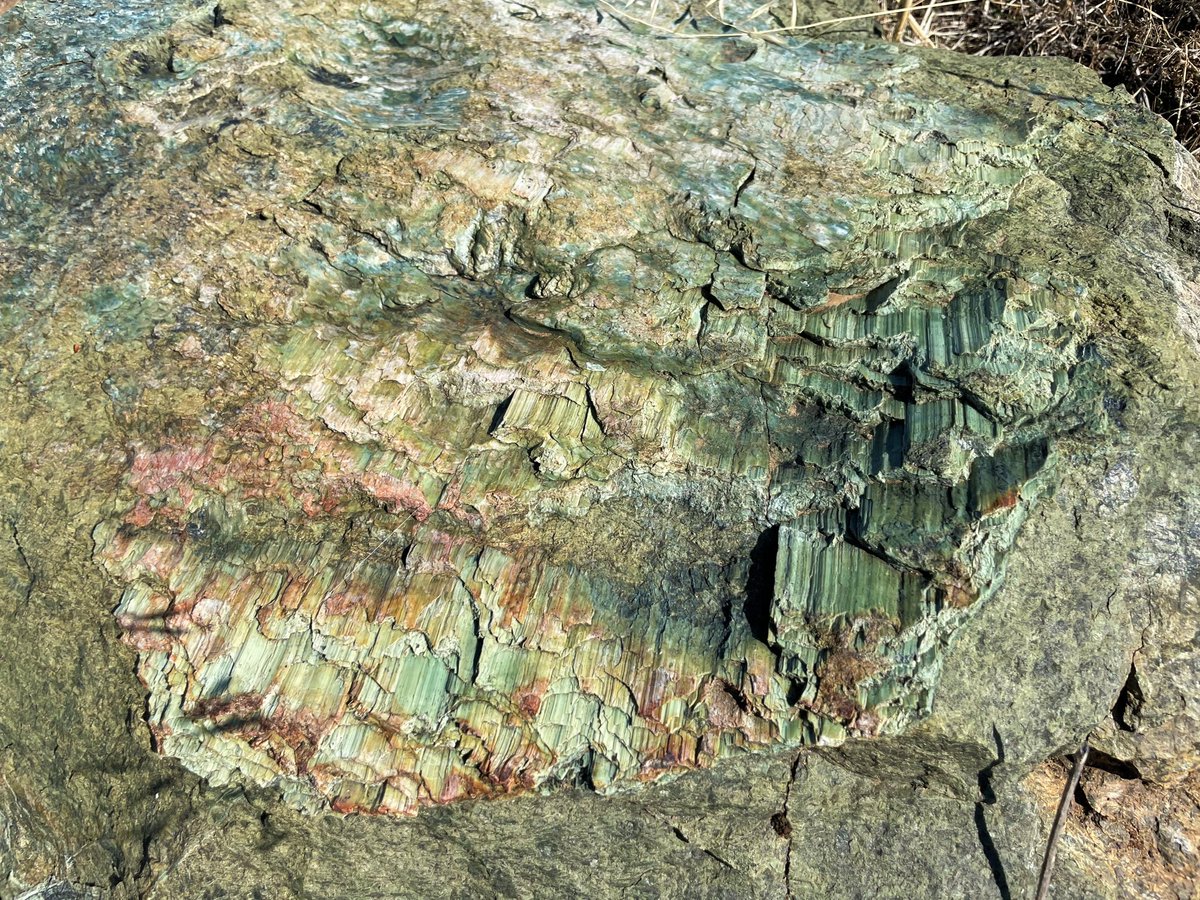
ALT A boulder eroded from the San Andreas fault zone reveals sheared and striated serpentinite, a rock type commonly found along the creeping San Andreas fault.
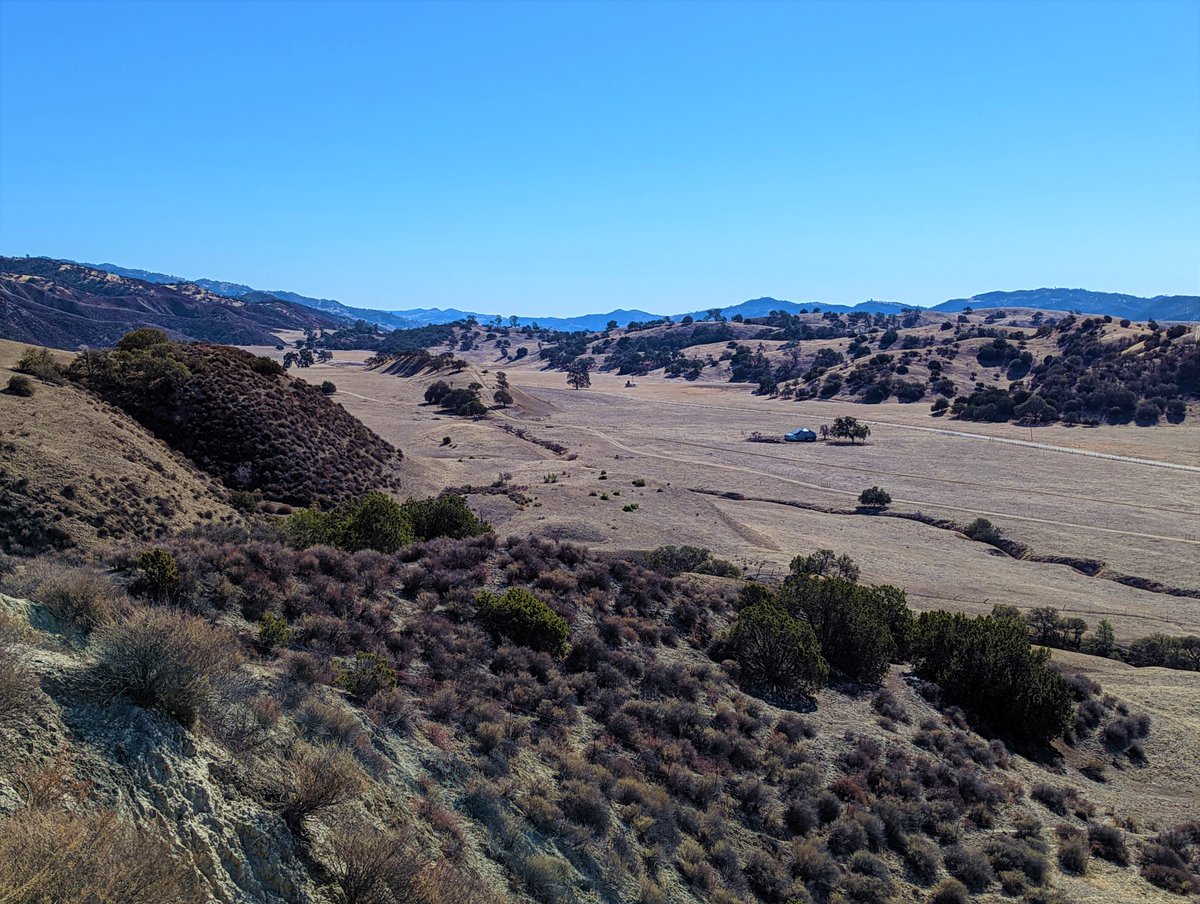
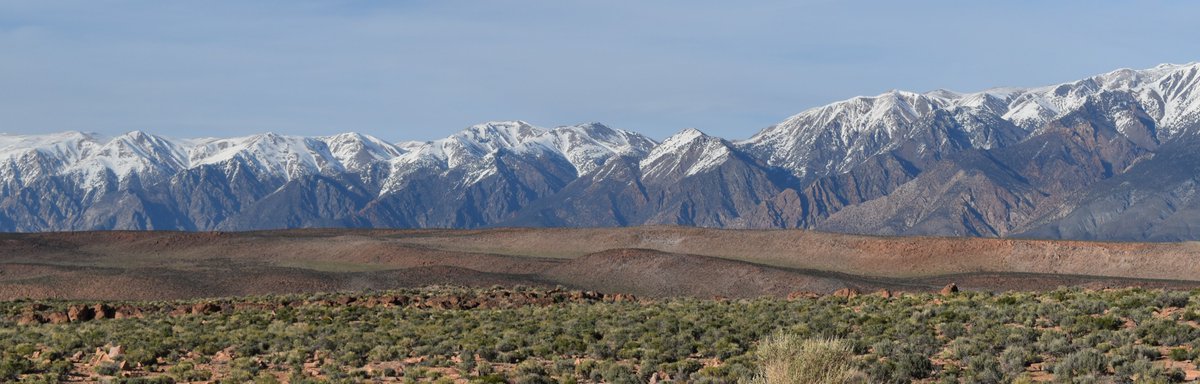
ALT A view looking southeast along the San Andreas fault near Bitterwater, CA. Here the low elongate ridge in the middle of the valley is the expression of the San Andreas fault. The ridge and associated scarps form as the fault compresses the landscape and shuttles topography along the fault zone.

ALT Abstract screen cap.
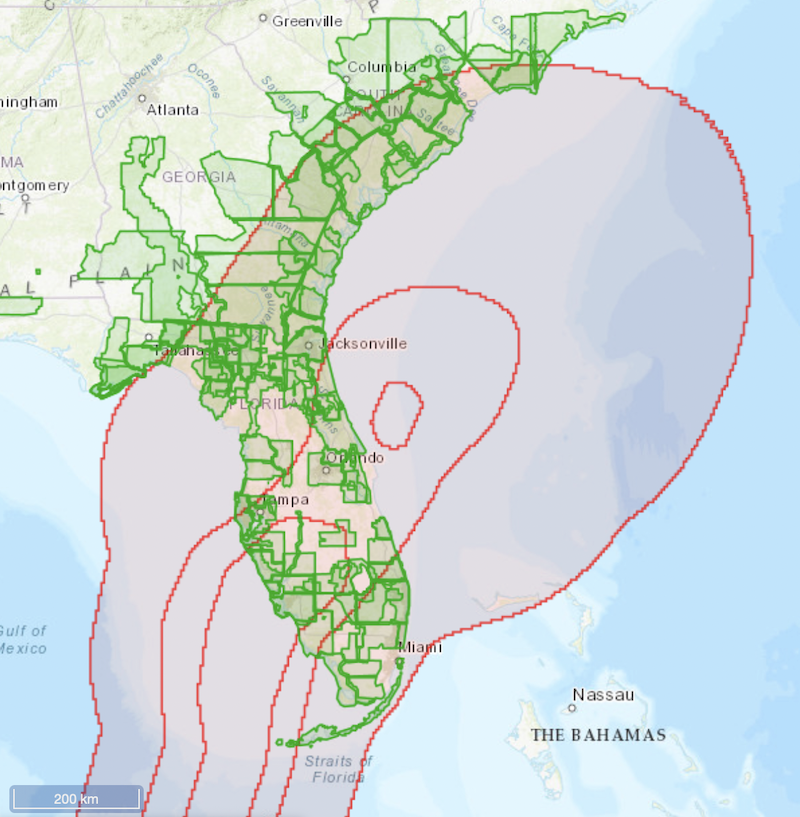
ALT Map showing the USGS 3DEP lidar datasets (green) in Florida, Georgia, South Carolina and North Carolina now temporarily available from OpenTopography in response to Hurricane Ian. Area of tropical-storm-force winds path (red) from NOAA.
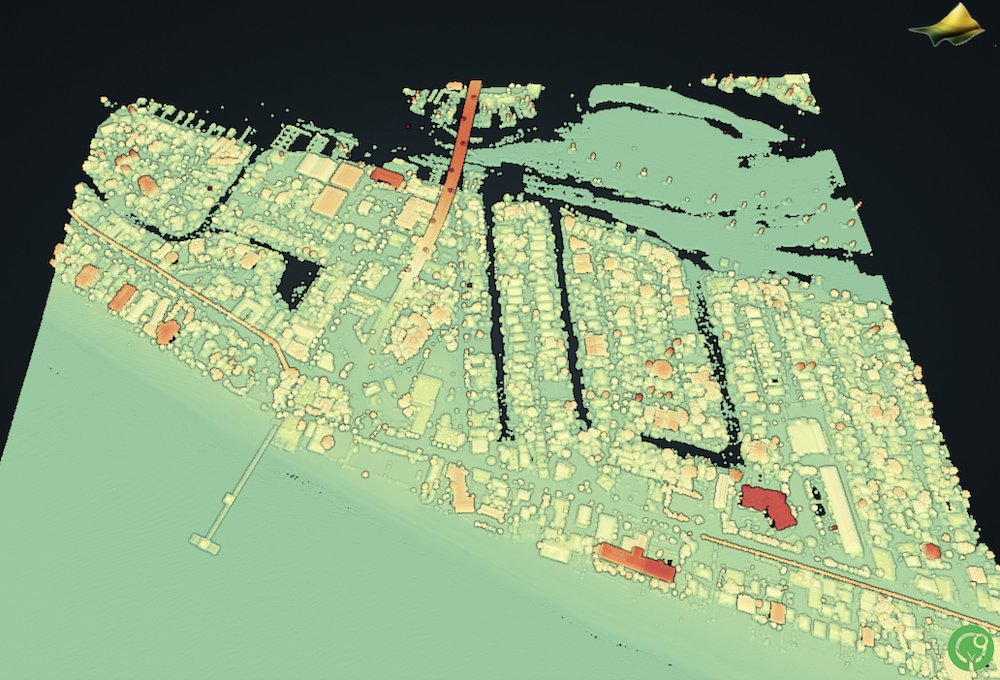
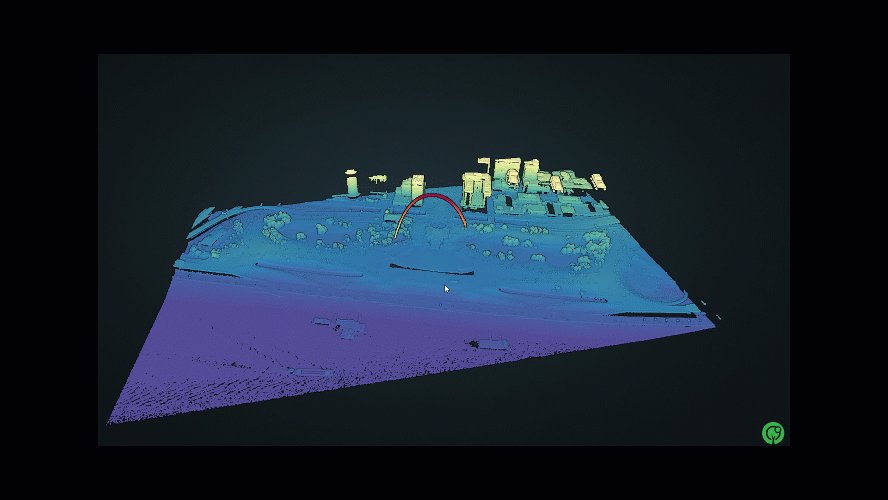
ALT 3D visualization of Fort Myers Beach, heavily impacted by Hurricane Ian, in 2018 USGS 3DEP lidar data.