
Independent Quant Seeking Alpha
Joined November 2015
- Tweets 467
- Following 348
- Followers 1,911
- Likes 1,766
54 Photos and videos

Helix Trader retweeted

Today is the DAY.
April 17, 2026.
The intermediate top before the most difficult time of the presidential cycle.
THE BAD NEWS
We're entering the mid-term correction phase.
Historically, markets correct an average of 16% during this period.
It's the weakest part of the 4-year presidential cycle.
And it starts NOW.
THE CHART
SPX Seasonal Composite 4-Year Presidential Cycle (99 years of data):
Election Year → Post-Election Year → Mid-Election Year → Pre-Election Year
Red line (current cycle): Peaked April 17, 2026
Black line (historical average): Shows consistent mid-term weakness
The pattern is clear.
Mid-election years are brutal.
THE HISTORICAL PATTERN
Out of the last 20 presidential cycles, we've witnessed 19 sharp mid-term corrections.
Average decline: 16%
Timing: Mid-election year (Year 2 of the cycle)
This is where markets reset.
THE GOOD NEWS
After 19 out of 19 sharp mid-term corrections, we've seen a new bull market.
Duration: 2 years
Phase: Pre-election year election year (Year 3 and Year 4)
This is the most bullish part of the cycle.
THE SETUP
We're at the top of Year 2.
The correction is coming.
But the 2-year bull market follows.
THE MESSAGE
Buy any dip in the coming months.
Not now. Not at the top.
But when the market corrects 10%, 15%, 20% — that's your entry.
Because history says: Mid-term corrections are buying opportunities for the pre-election rally.
THE PLAYBOOK
1. We're at the intermediate top (April 17, 2026)
2. Expect a 16% correction over the next 6-9 months
3. Layer in during weakness (-10%, -15%, -20%)
4. Hold through the pre-election year rally (Year 3)
5. Ride the election year momentum (Year 4)
THE PATTERN NEVER FAILS
19 out of 19 times, the mid-term correction was followed by a 2-year bull market.
That's 100%.
THE LESSON
Don't panic during the correction.
Don't fight the cycle.
Buy the dip. Hold for 2 years.
That's the presidential cycle playbook.
Today is the DAY.
The top is in.
The correction starts now.
The opportunity is coming.

73
149
942
583,408
Helix Trader retweeted

Apr 16
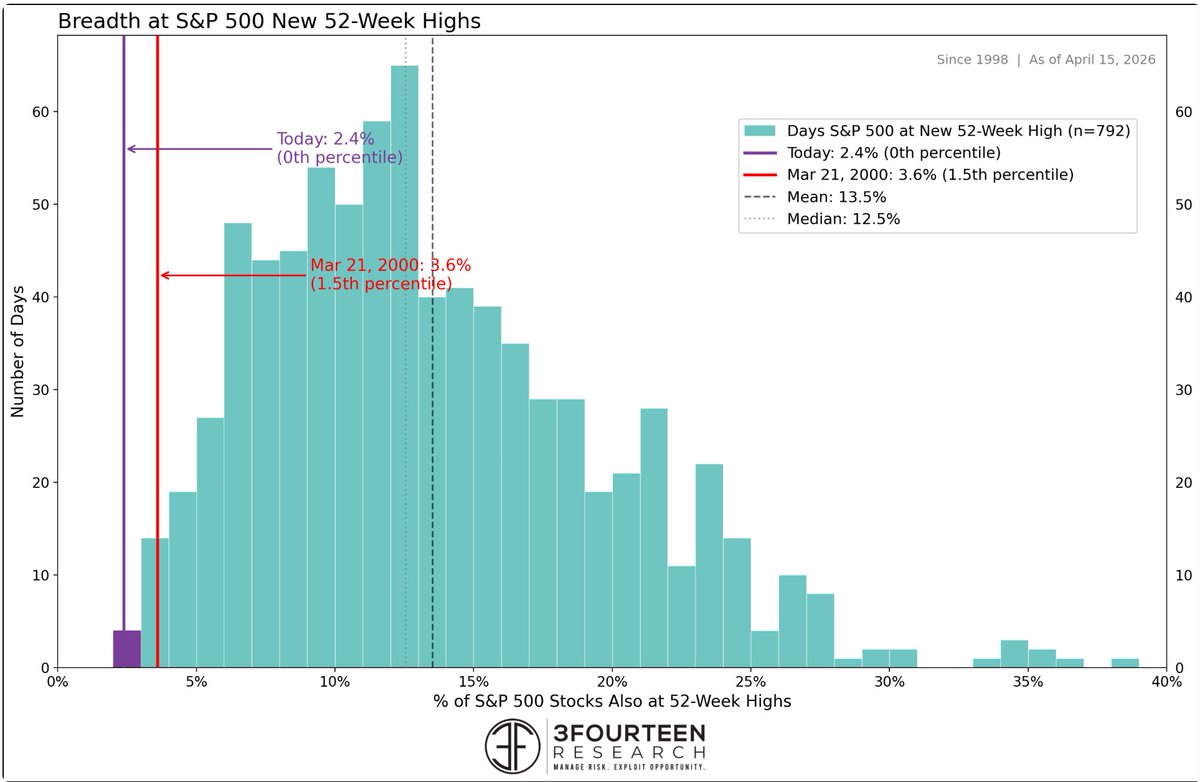
Yesterday's all-time high occurred with only 2.4% of S&P 500 stocks making a 52-week high.
Out of 792 days where the index made a new 52-week high since 1998, this is the fewest number of stocks participating.
84
281
1,876
269,094
Helix Trader retweeted

Apr 15
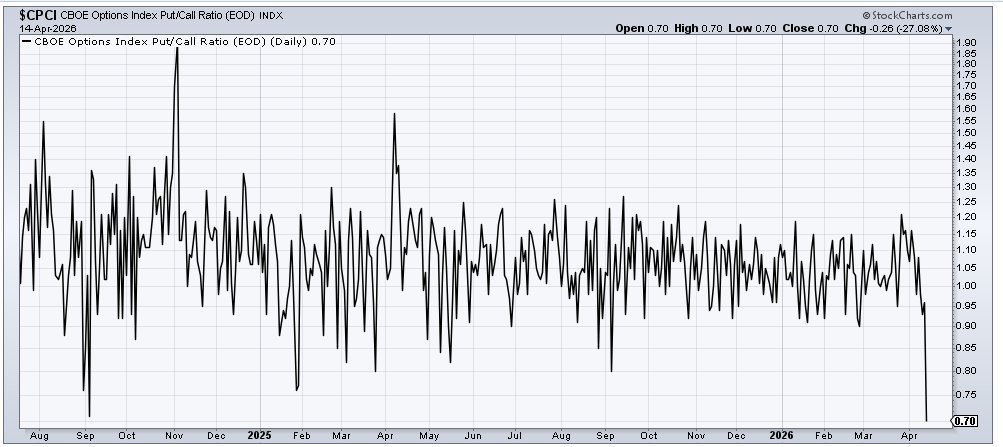
Yesterday's Index put/call ratio was .70. It hasn't been lower in at least 5 yrs but it was .71 in early September 2024
23
91
458
62,033
Helix Trader retweeted
Apr 15
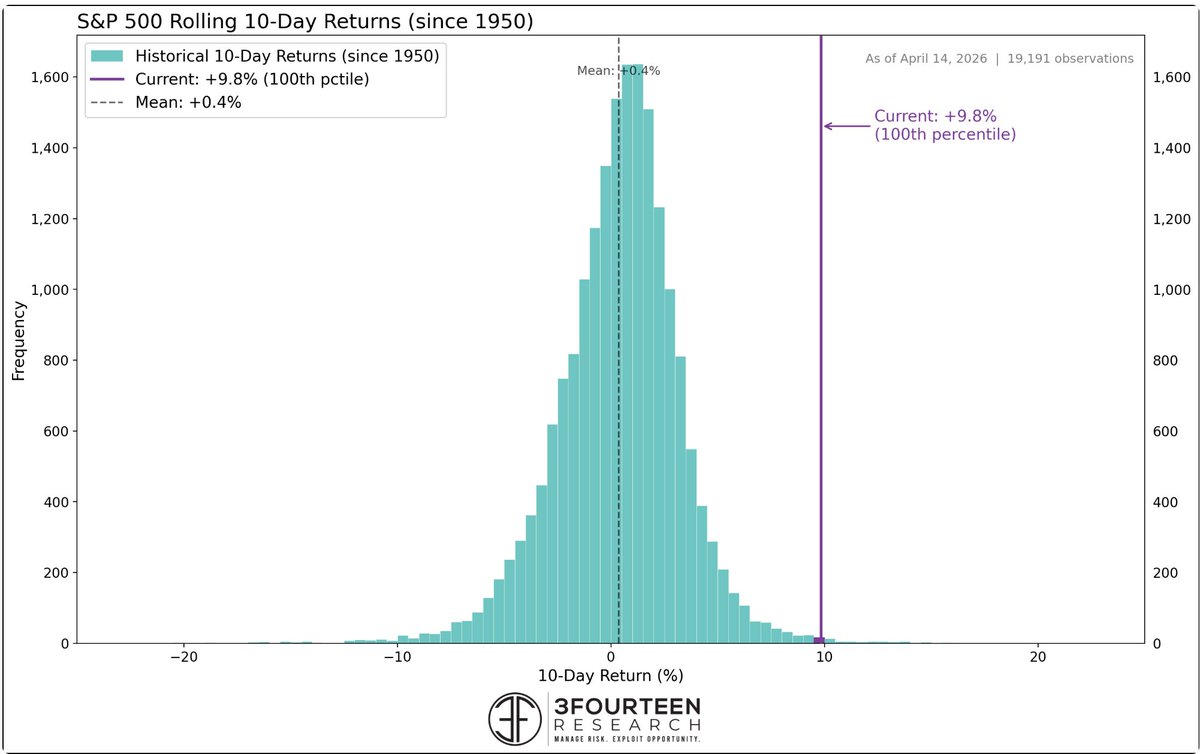
The last 10-days have been unlike any 10-day period in the market since 1950.
First, the S&P 500 is up 9.8% in 10-days, which is in the 99.7th percentile of all 10 day returns.
165
767
5,833
1,132,075

Apr 9
My latest quarterly market update, with the technical perspective on the big picture in stocks, currencies, and commodities - including where we stand now and what may lay ahead.
youtube.com/watch?v=WA2f25XJ…
2
241

Scrolling through my feed, there are two dominant ways I see traders actually using AI right now and neither of them is particularly flattering.
Dashboarding
There's something incredibly fulfilling about creating a system that's beautifully designed, tracking all the metrics anyone could ever want, P&L overlays, heat maps, sentiment feeds, whatever. It feels like real work. But for many people, it's just procrastination in a more expensive suit. The dashboard becomes the real project, and actual trading gets pushed to the side.
Backtesting/Overfitting
AI has made backtesting so accessible and so fast that people can torture historical data until it confesses to almost anything. And they do. I've literally watched people backtest a strategy, find that it underperforms on certain days of the week or certain hours, and simply remove those periods from the sample.
The irony is that AI was supposed to remove human error from the process, but in practice it's often just amplifying the same old biases with a lot more computational power and a lot more speed behind them. Garbage in, garbage out; except now the garbage is better formatted and executes faster.
33
25
434
49,860
Helix Trader retweeted

Mar 12
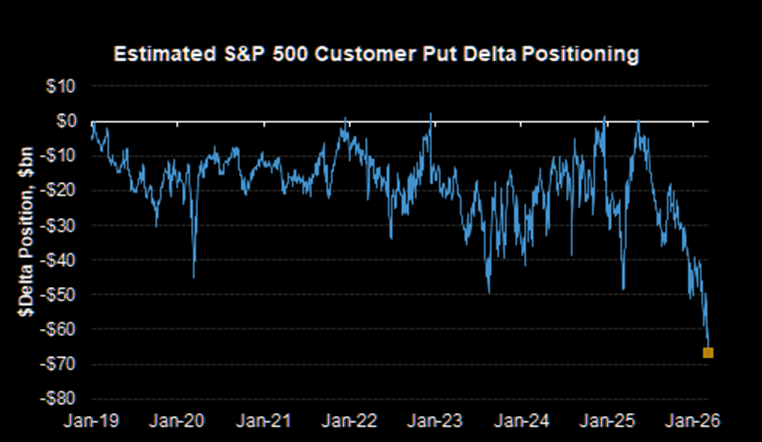
This chart, which has been doing the rounds, shows one of the most hedged equity markets in years. That usually means fear is already priced in, and the risk asymmetry increasingly favors upside surprises rather than further panic selling.
This chart tracks Estimated S&P 500 Customer Put Delta Positioning from 2019–2026.
Extreme hedging has often appeared near market turning points.
Right now the chart shows ~-$70B, the most negative level in the entire series.
A lot of bad news is already hedged. There is potential for a “hedge unwind rally”
36
68
447
89,691
Helix Trader retweeted

28 Oct 2025
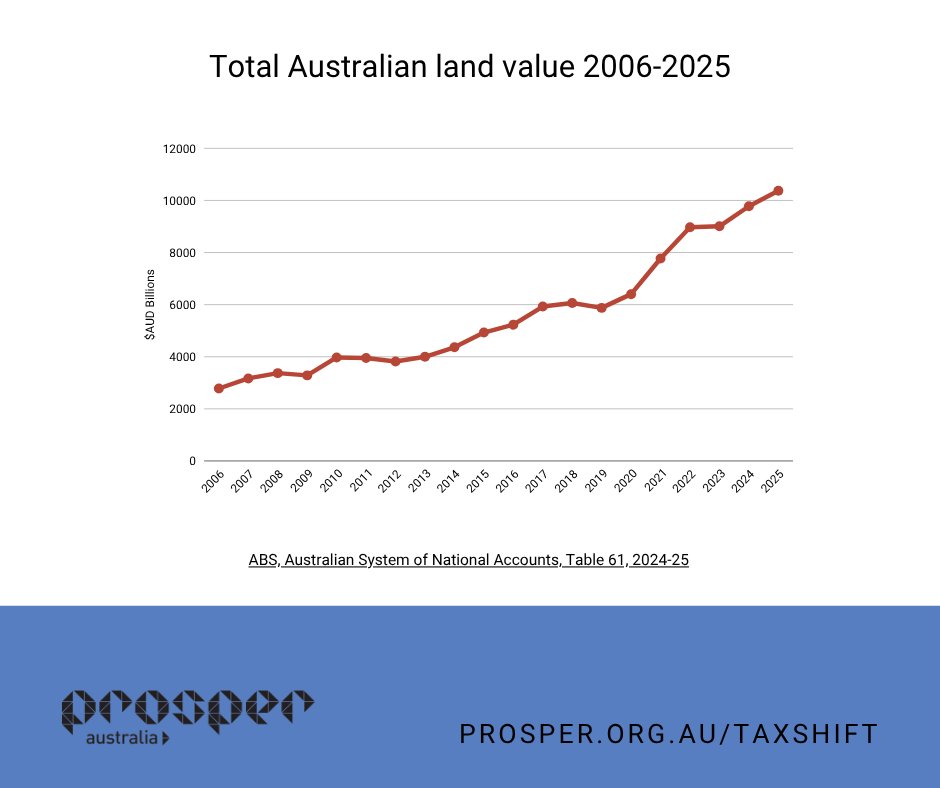
Australia’s land wealth now exceeds $10 trillion, yet most Aussies are still paying the bulk of taxes on their labour.
Other resource-rich nations reinvest unearned gains for the public, we let them flow largely untaxed to private owners.
📊: ABS ASNA, Table 61 2024-25
1/3
1
3
6
526
Helix Trader retweeted

8 Oct 2025
Backtests are the porn of quant #trading: addictive and usually unrealistic
10
19
105
8,871
Helix Trader retweeted

8 Oct 2025
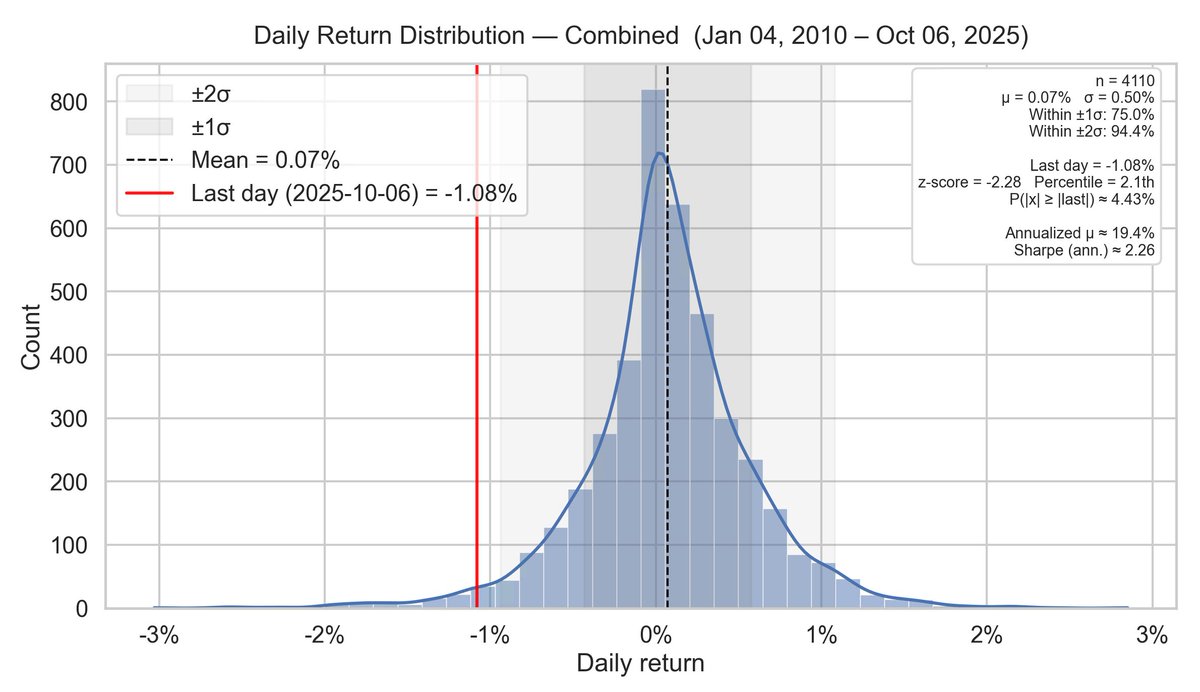
Traders panic over a bad day because they don’t know what’s normal.
One of the best ways to emotionally survive losses is to put them into context. 📊
I track every daily % PnL across the portfolio and plot them as a long-term distribution (live & backtest).
It shows what’s normal — even if returns aren’t perfectly normal-distributed.
Monday’s –1.08% loss?
z-score = –2.28 → roughly a 2.1% percentile event.
So I expect about 5–6 such days per year.
What this means to me:
• My risk sizing is right — I can absorb these
• If these events start clustering → something in my edge may be changing
Statistics ≠ perfection. But they turn fear into data — and data into control.
#SystematicTrading #RiskManagement #TradingPsychology
2
10
106
8,474
9 Oct 2025
My latest quarterly market update, giving the technical perspective on the big picture in stocks, currencies, and commodities - including where we stand now and what may lay ahead.
youtu.be/_OxTI88COzY
2
617
Helix Trader retweeted

3 Sep 2025
The Wall Street Journal noted that the yield spread between the 2-year Treasury note and 30-year Treasury bond has steepened to the widest point in several years.
The last two times this yield curve cycled from inversion to a spread of 1.25%, it coincided with the two most wicked bear markets in generations.
Since the inception of the curve, those were the only two signals that preceded negative returns.
🔗Read @jasongoepfert's Sep 2 article "A curve ball from the yield curve" - full report available: payhip.com/b/r5ZTv

110
297
1,019
1,004,100
Helix Trader retweeted

Excited to welcome @MicMcCarthy to this year's ATAA Conference in Melbourne, with @moomoo as a valued sponsor. Early bird registration ends Friday, August 22. Don't miss out! Book now: ataa.asn.au/conference-2025 youtu.be/5dVyv0II89c?si=4f8F…
2
2
902
Helix Trader retweeted

5 Aug 2025
Only people who have never traded believe in the Efficient Market Hypothesis.
26
219
1,535
92,226
30 Jul 2025
I'll be there. Hope to see you there.

Join the ATAA 2025 Conference: 'The Future of Trading – Blending Classic Tactics with Smart Technology'! Oct 18-19 in Melbourne (or online). Hear from experts like @lb_ASC, @RichB118, @Phil_J_Anderson & more on AI tools, strategies & networking. Non-members get 12 months FREE membership! Places limited – REGISTER NOW! #Trading #Investing #ATAA2025 ataa.asn.au/conference-2025
4
710
10 Jul 2025
My latest quarterly market update, giving the technical perspective on the big picture in stocks, currencies, and commodities - including where we stand now and what may lay ahead. youtube.com/watch?v=Swp2nEHu…
7
863
Helix Trader retweeted
30 Jun 2025
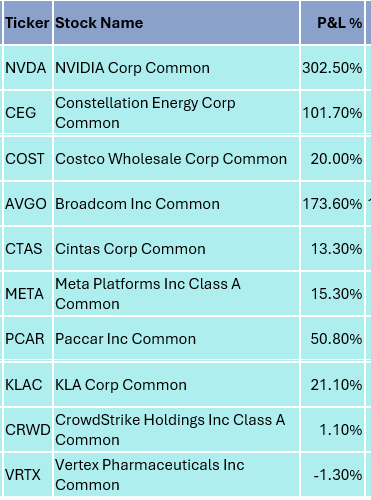
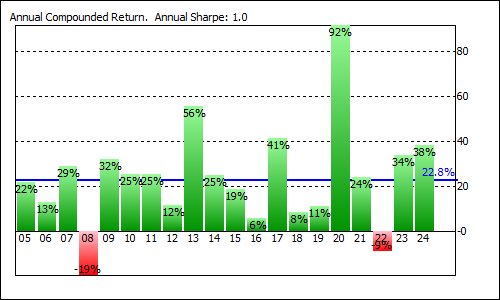
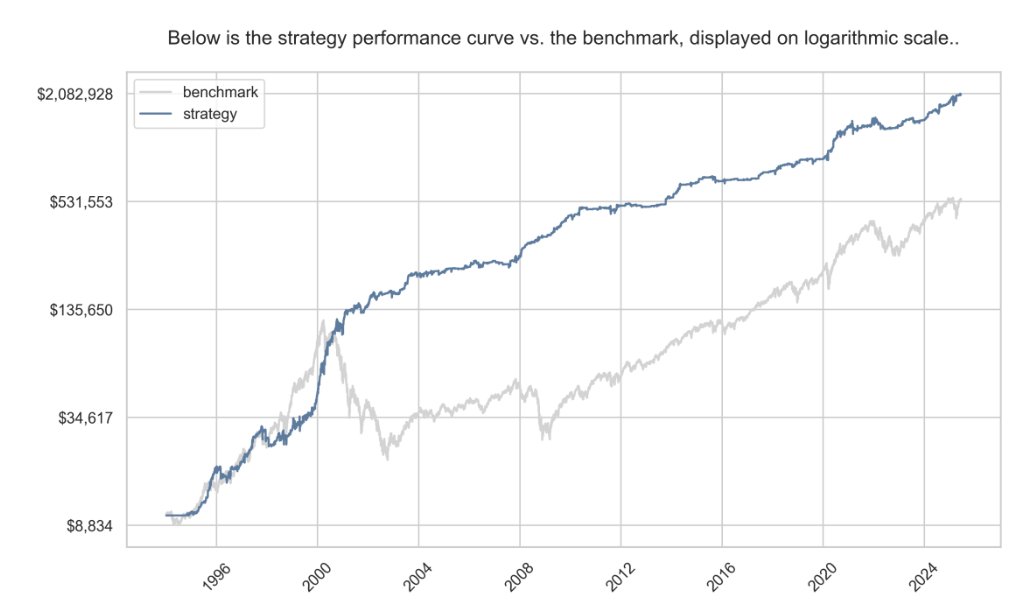
Profitable systematic trading isn’t about complexity. It’s about discipline.
Here’s a simple mean-reversion system I published 2 years ago. In 2025, it's delivered:
✅ 2.7x return of buy & hold $QQQ
✅ Half the drawdown
✅ Uses only 16% capital
🔍 The rules:
- Universe: Nasdaq 100 stocks
- Trend filter: Only trade stocks above their 200-day moving average
- Signal day: Stock closes down more than 3% vs. prior close
- Volatility filter: ATR(5)/Close must be > 3%
- Next day: Place a limit buy below the signal-day’s close (fraction of ATR below)
- If multiple signals: Buy the stock with the highest ATR(5)/Close
- Exit rule: Sell when the stock closes above the previous day’s high or after 10 days.
It’s that simple. No forecasting. No overfitting. Just rules discipline.
Try it free in our interactive backtester (with PDF report):
👉 crackingmarkets.com/buying-s…
#systematictrading #outofsample #completesystem
4
6
87
7,135
18 Jun 2025
Always love @GaryStoneSWS's content. Looking forward to tuning in.
📢 Join us for the ATAA Trading Expert Series featuring @GaryStoneSWS !
🗓️ Date: Saturday, 12 July 2025
⏰ Time: 12:00 PM AEST
💻 Location: Online Webinar
🎟️ Cost: Free for all attendees
Register now to secure your spot and receive the Zoom link: ataa.asn.au/content.aspx?pag…
Renowned trading coach Gary Stone will present "Building Habits to Achieve Trading Excellence & Life-long Profitability." Gain expert insights, practical strategies, and participate in an interactive Q&A session.
Don't miss this opportunity to elevate your trading skills!
643
Helix Trader retweeted

24 Apr 2025
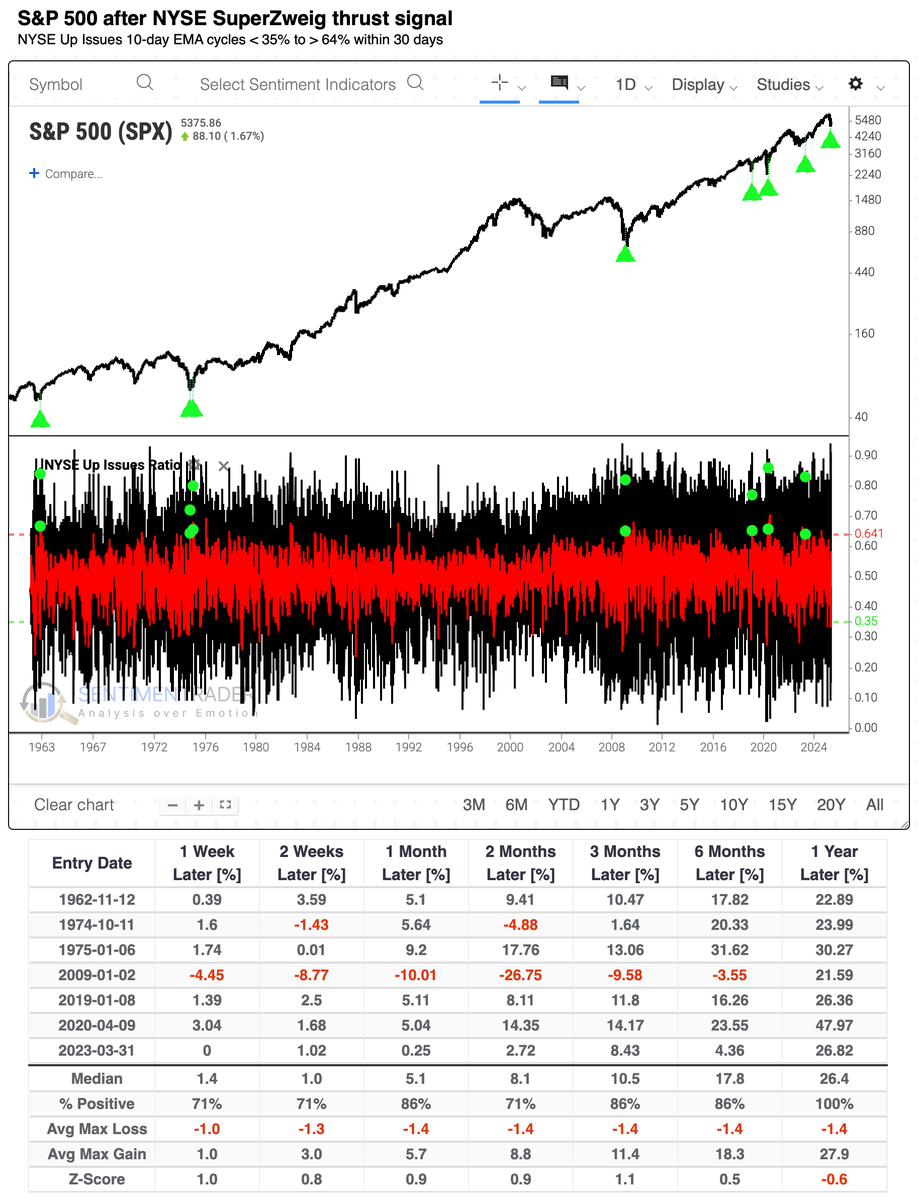
Forget the Zweig breadth thrust - the NYSE just triggered a SuperZweig.
Both extremes were significantly further than the thresholds of the original signal.
The S&P 500 returned more than 20% the year following every prior thrust.
Talk about a bear killer.
130
398
1,761
700,073