
Assistant Prof of Political Science @TAMU. US political economy & ag policy. Trying to follow Jesus, work in progress.
Joined July 2018
- Tweets 336
- Following 1,969
- Followers 573
- Likes 15,144
18 Photos and videos


Pinned Tweet

6 Aug 2024
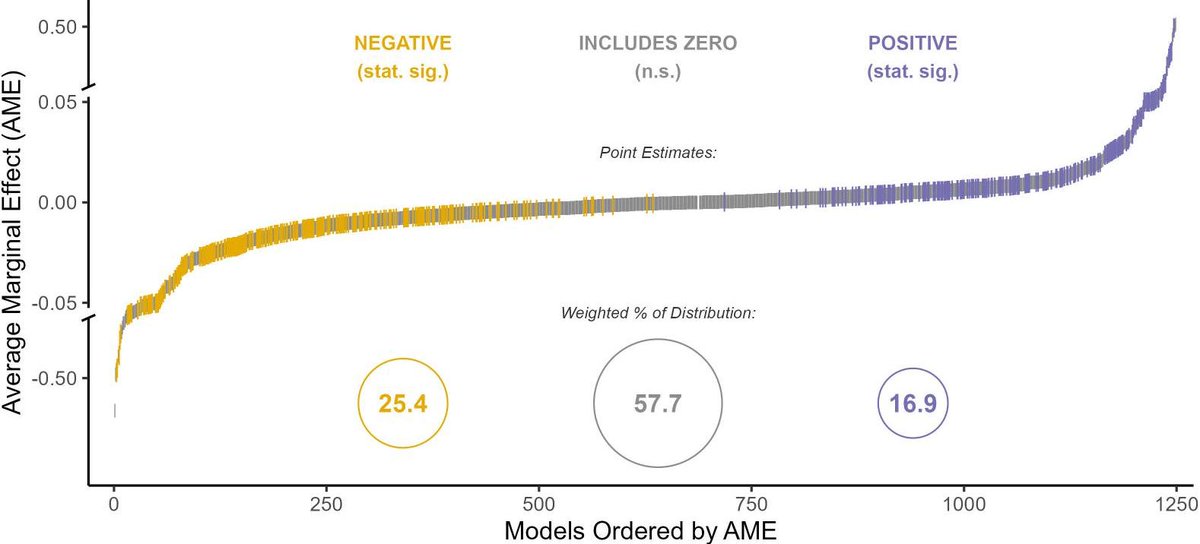
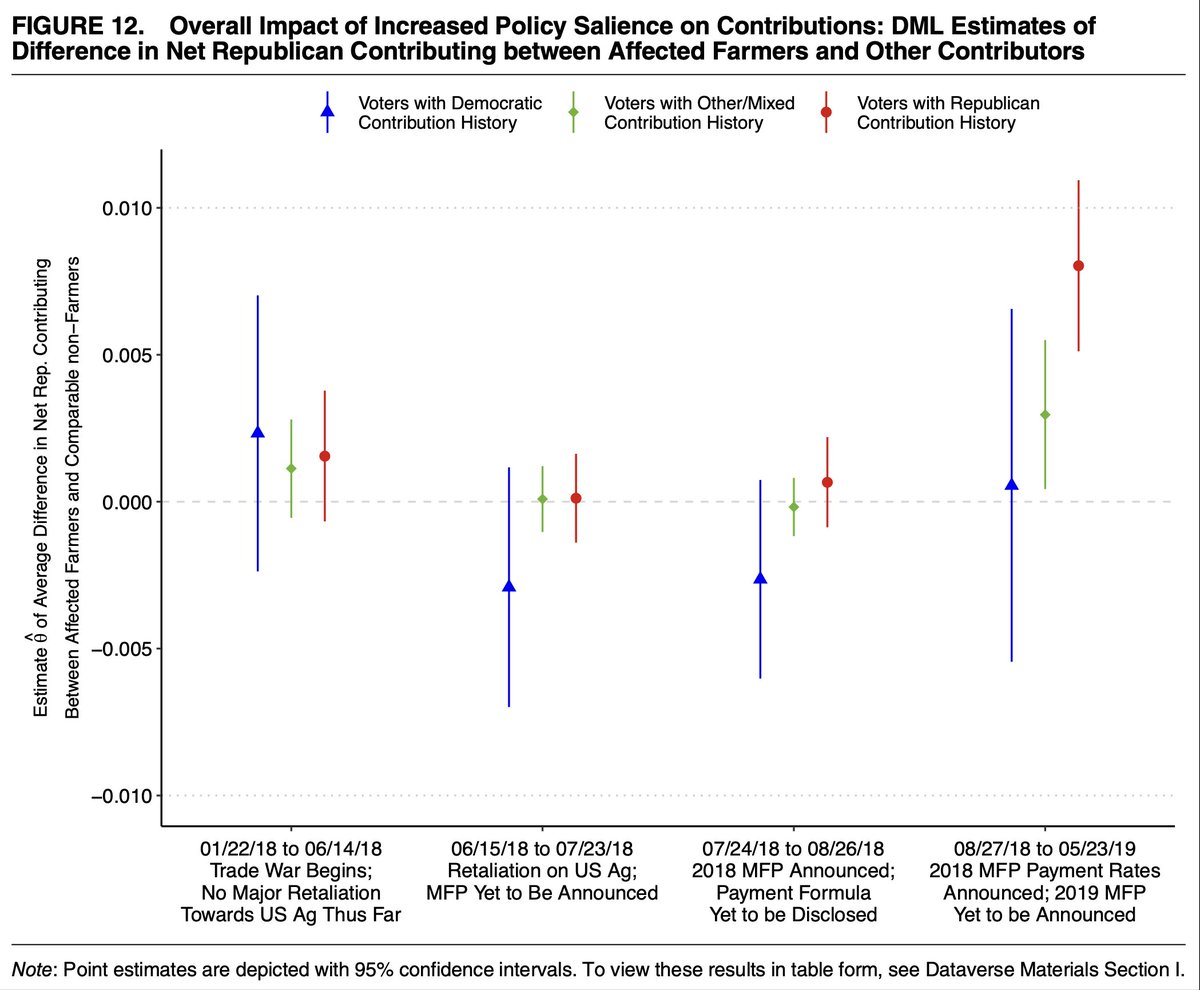
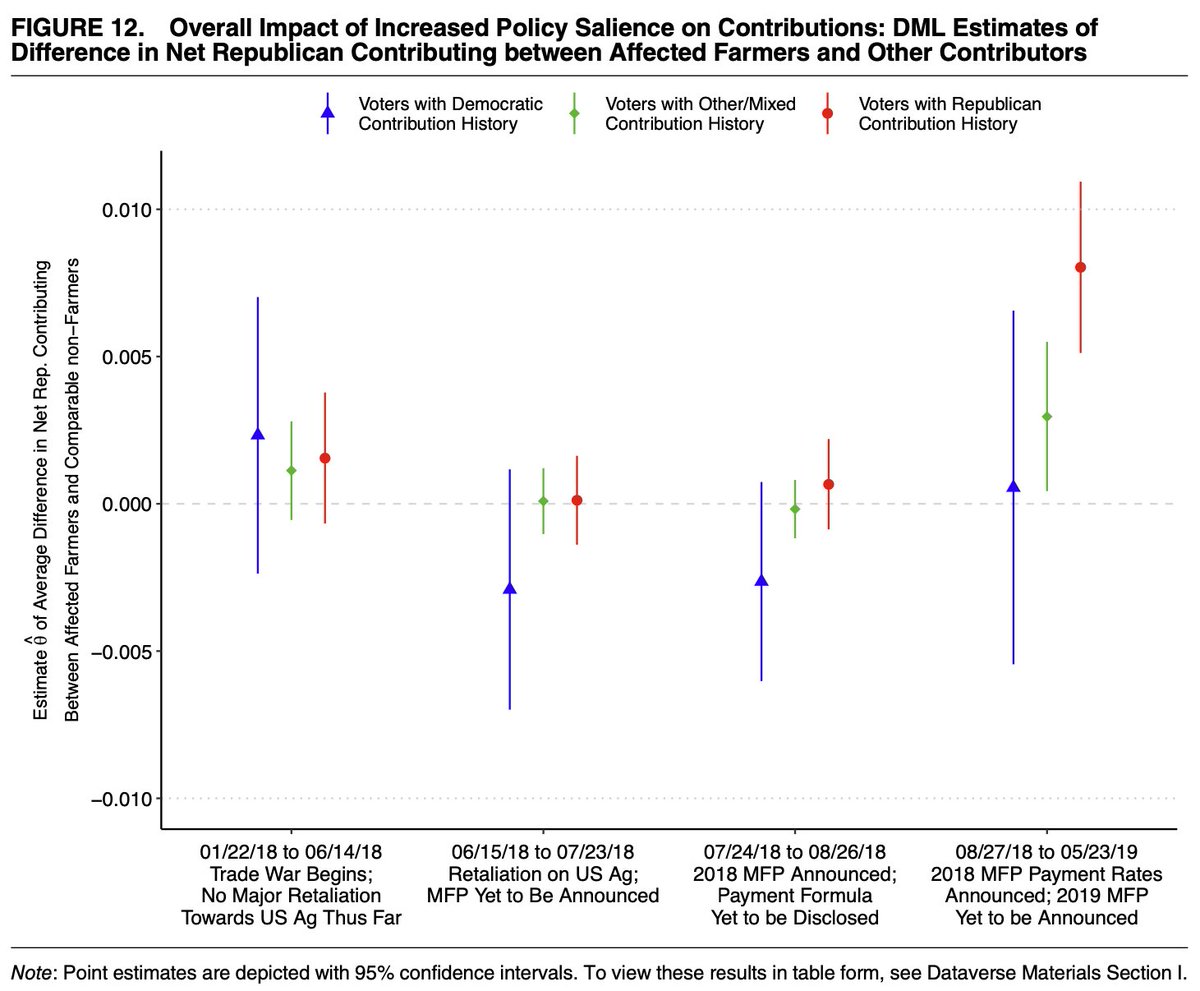
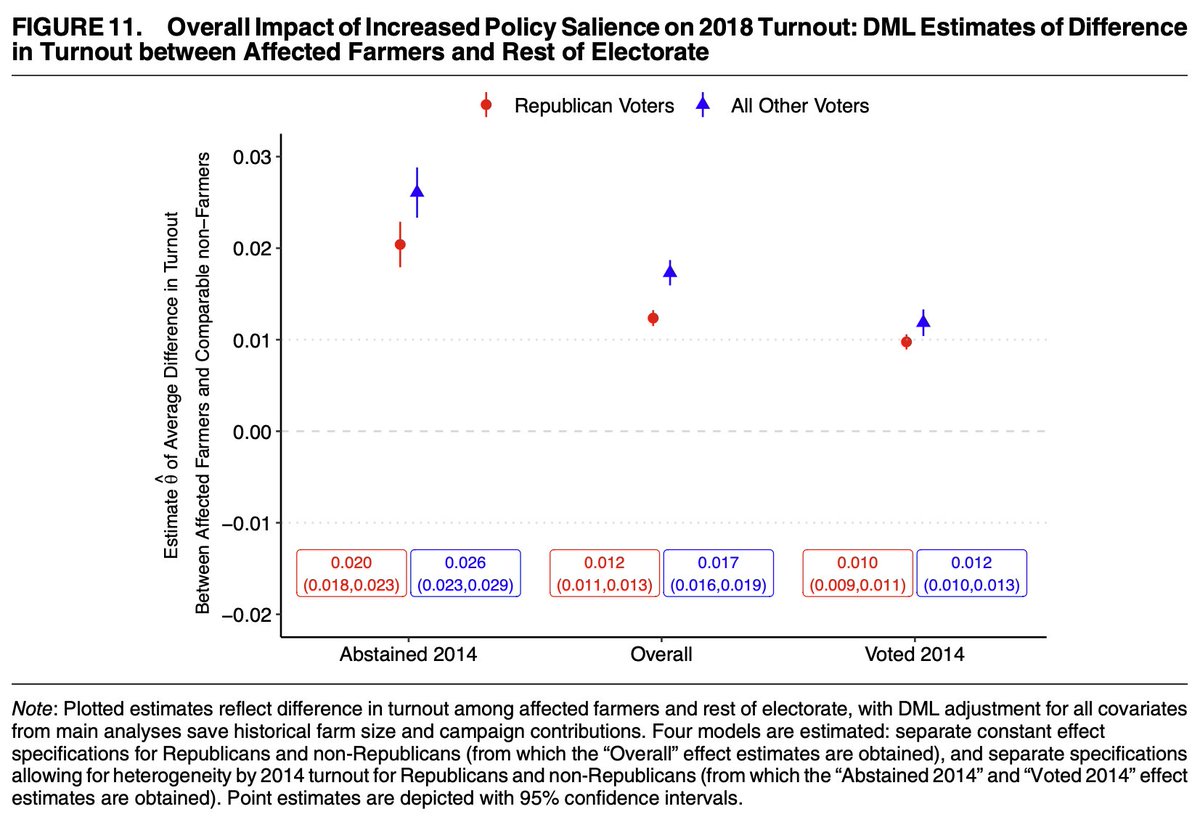
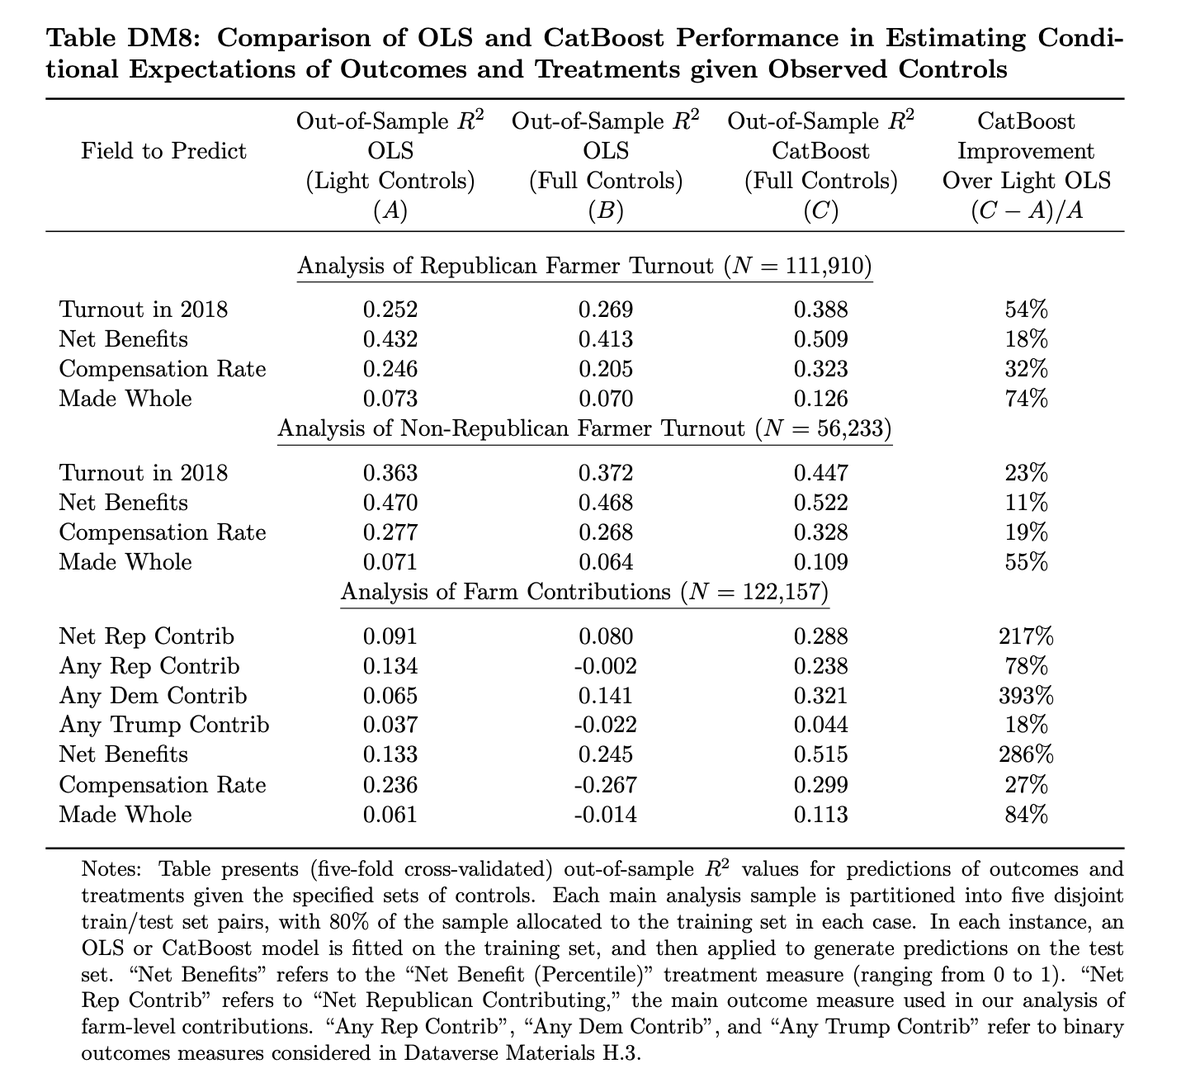
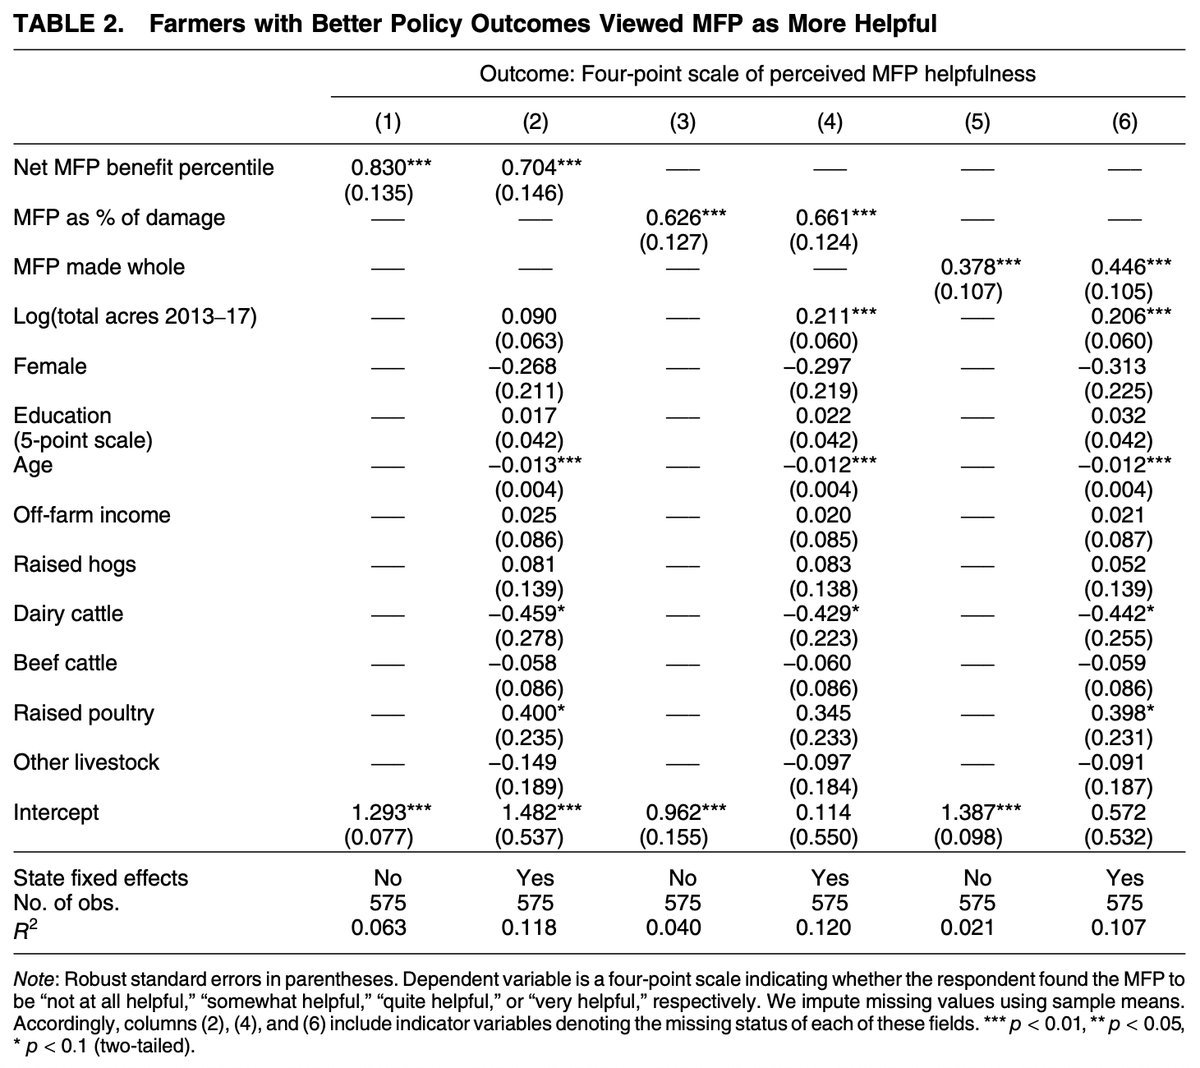
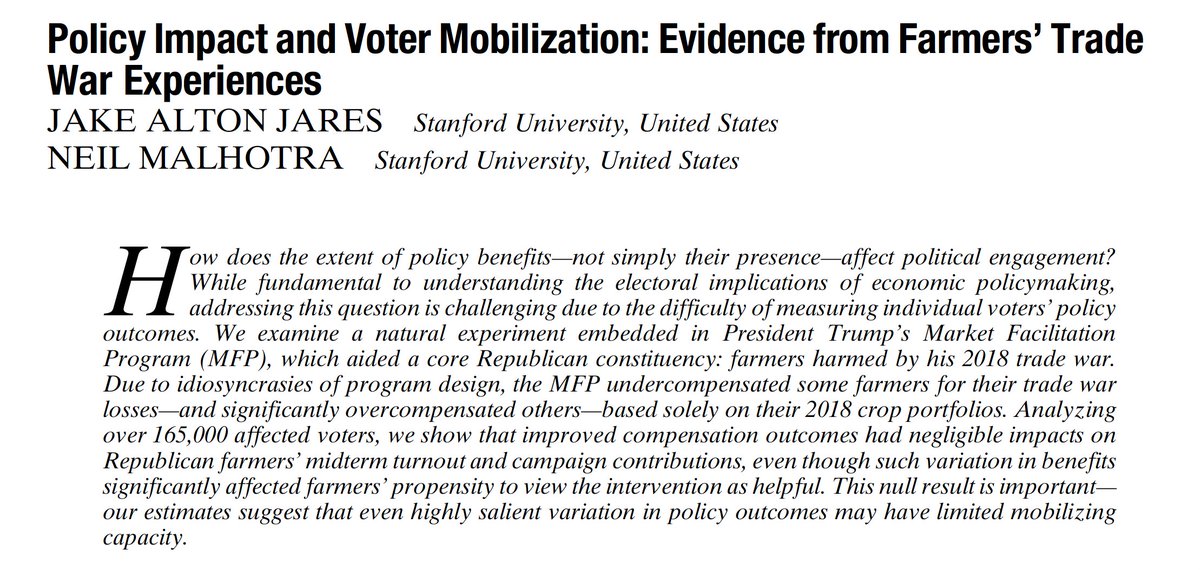
Thrilled my paper with @namalhotra is out at @apsrjournal! Have you always been captivated by the impacts of trade policy on political behavior, applications of causal machine learning, and shocks to soybean prices? Ok well regardless this is still the paper for you! A thread 🧵

Just published on APSR First View: “Policy Impact and Voter Mobilization: Evidence from Farmers’ Trade War Experiences”, by Jake Alton Jares and Neil Malhotra. cambridge.org/core/journals/…
6
33
159
34,639
Jake Jares retweeted

Josh Barro makes the Forbidden Argument in political punditry: policy outcomes are downstream of the electorate's preferences

28
129
1,786
72,949

1/ Happy to share that "Factorial Difference-in-Differences" (FDID), with Anqi Zhao and @pengding00, is out in JASA - ACS. doi.org/10.1080/01621459.202…
It has been a truly thrilling experience working with Anqi and Peng.
6
57
213
22,826
Jake Jares retweeted

The Econ nobel ranking is merely the initial assignment. Second welfare theorem takes care of the rest
1
2
33
5,741
Jake Jares retweeted

May 20
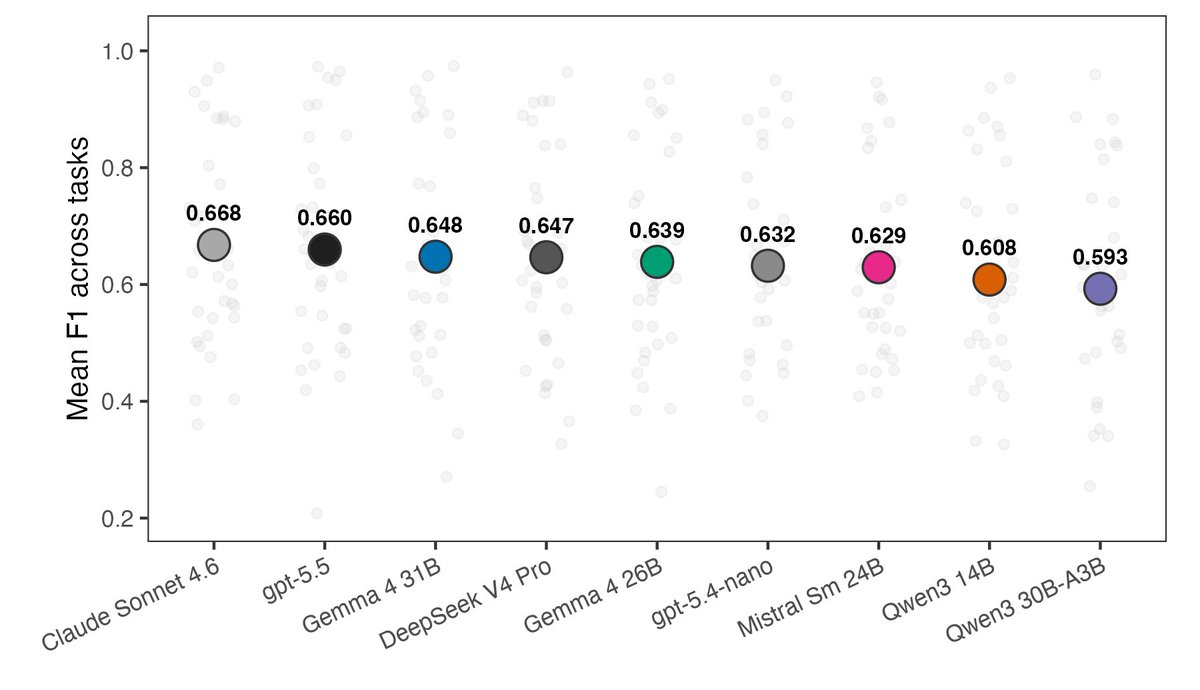
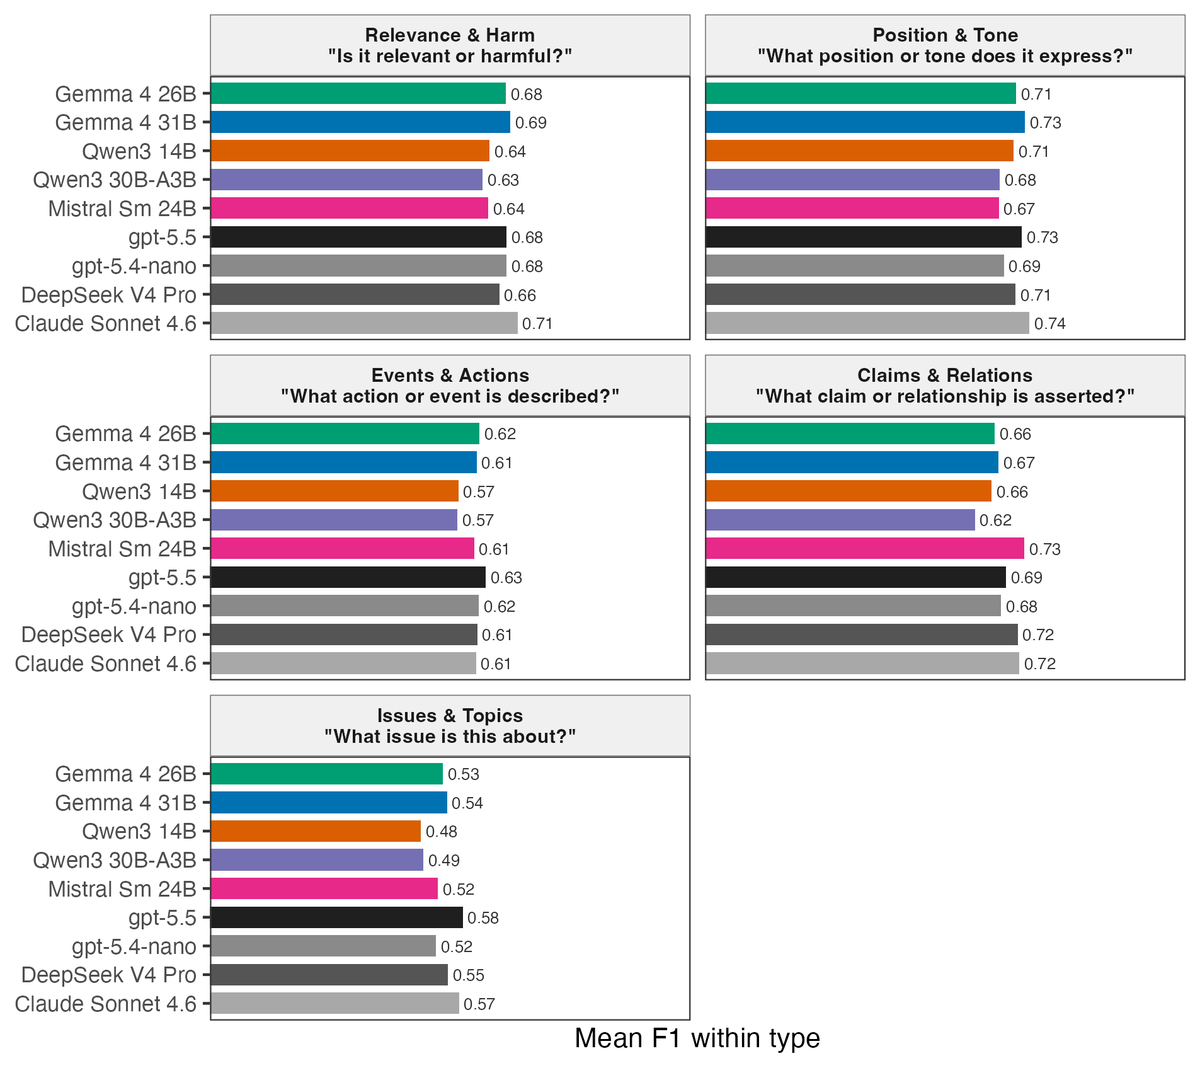
Update on my benchmark of local vs. commercial LLMs for text classification, focusing on political science applications.
I compared 5 local open-weight models with 4 API models on 34 coding tasks (~147k predictions). Tasks include tweets, news, survey responses, policy texts, etc
The best local LLMs are often close and sometimes perform better. Local models match or exceed API on 9/34 tasks. The average API advantage is pretty small, at 0.015 F1.
3
17
45
5,407
Jake Jares retweeted

May 19
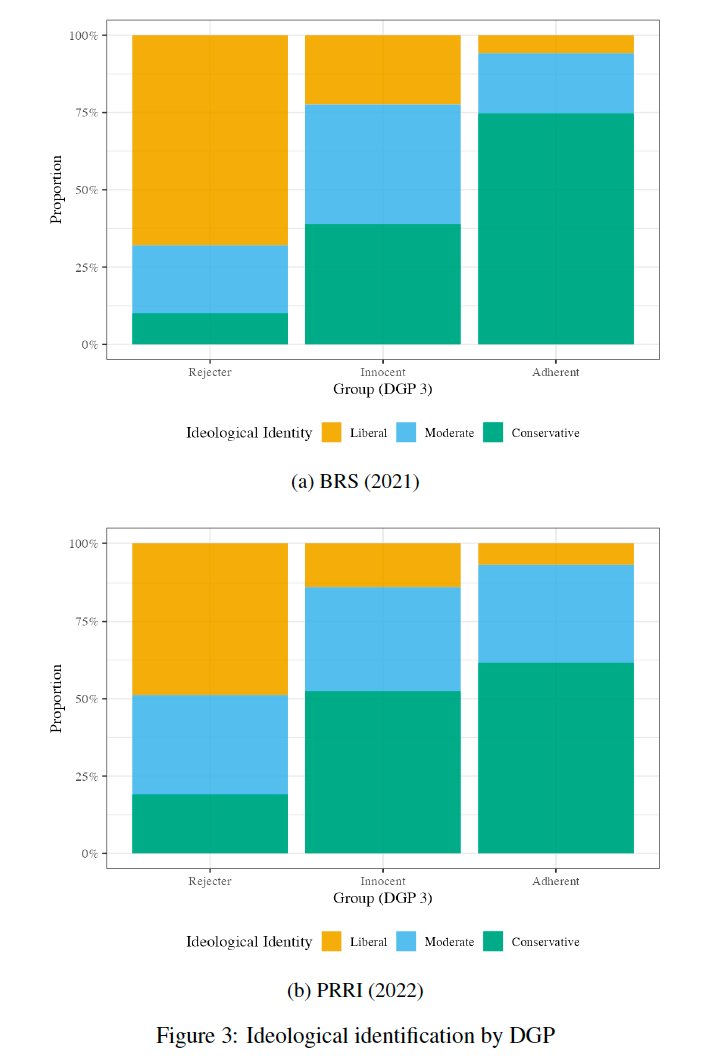
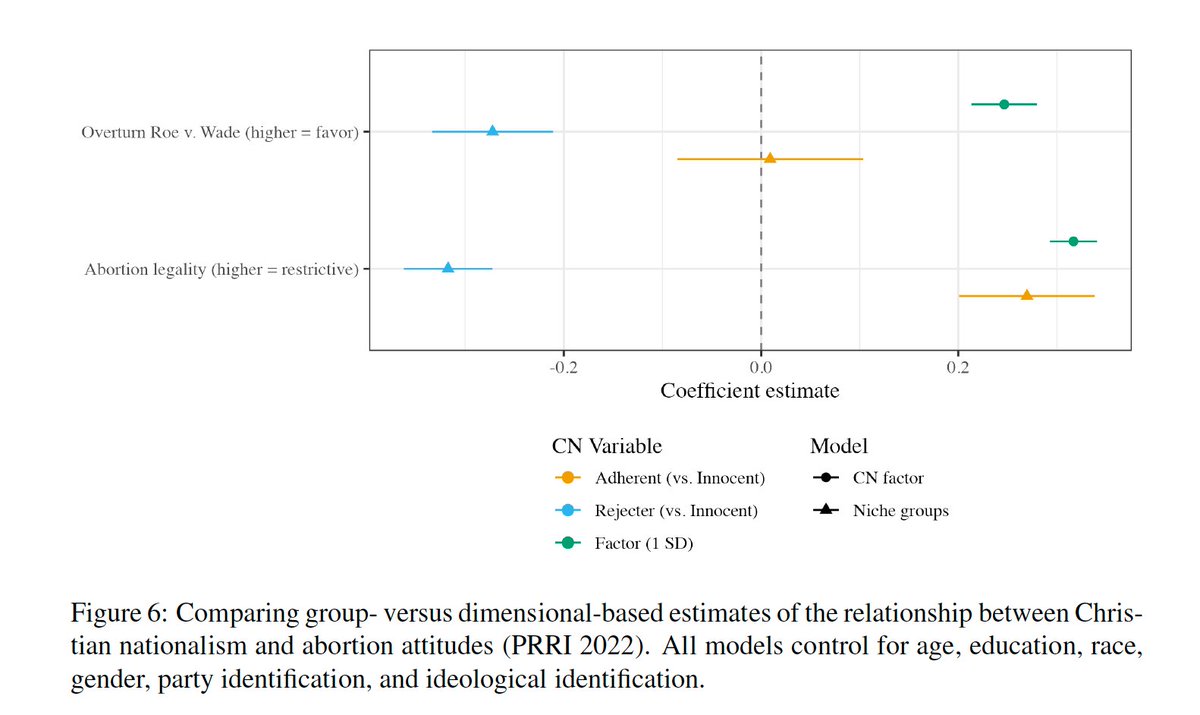
new WP (w/ Nick Davis): we use the case of Christian nationalism to make a broader point about "niche ideologies" in mass opinion research, and why you shouldn't scale them the same way you'd scale more general attitudes
1
5
35
2,705
Jake Jares retweeted

🚨Early version of my JMP! 🚨
To what extent is the contact between corporate lobbyists and federal government officials publicly disclosed?
In other words, how big is the market for "shadow lobbying"?
The Lobbying Disclosure Act mandates quarterly disclosure of lobbying "contacts" subject to many caveats. Watchdogs have long complained about lacunae in the LDA, but there is little evidence of the size of shadow lobbying market.
In my JMP, I use 4.5 trillion pings from 179 million smartphones spatially merged to building shapefiles and observe movement between lobbyists' offices, corporate headquarter buildings, and the federal government in Washington DC.
See below: movement of lobbyists from corporate HQs to federal government buildings:
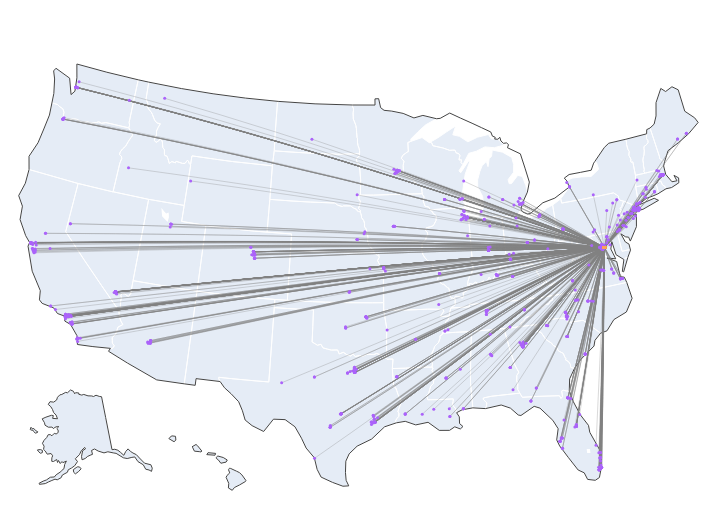
ALT Movement of lobbyists from corporate HQs to federal government buildings in Washington DC.
10
76
436
147,166
Jake Jares retweeted

May 9
Hating on developers won’t solve the housing crisis, but this hatred certainly explains why people oppose the types of policies that would help


Seattle has one of the worst housing crises in the country. I see it every time I’m home in my district.
People working full-time jobs who can’t afford rent. Teachers, nurses, and transit workers who can’t live in the city they serve. Families on housing assistance waiting lists that have been frozen for years.
This is a policy failure, not an inevitability.
We built this crisis by choosing developers over people. We can choose differently.
Housing is a human right. We fight for it like one.
4
9
153
21,353
Jake Jares retweeted

Am I the only social scientist that thinks the marginal returns to social science research are pretty low? I mean, I enjoy it & think it's interesting. But I don't think it’s improving the world much. Imo society oversupplies social science and undersupplies medical research.
May 7

Some of us just dodged the pissing match about randomized trials versus macro development because we believe the marginal returns to research in both areas are pretty high
51
29
376
89,414
Jake Jares retweeted

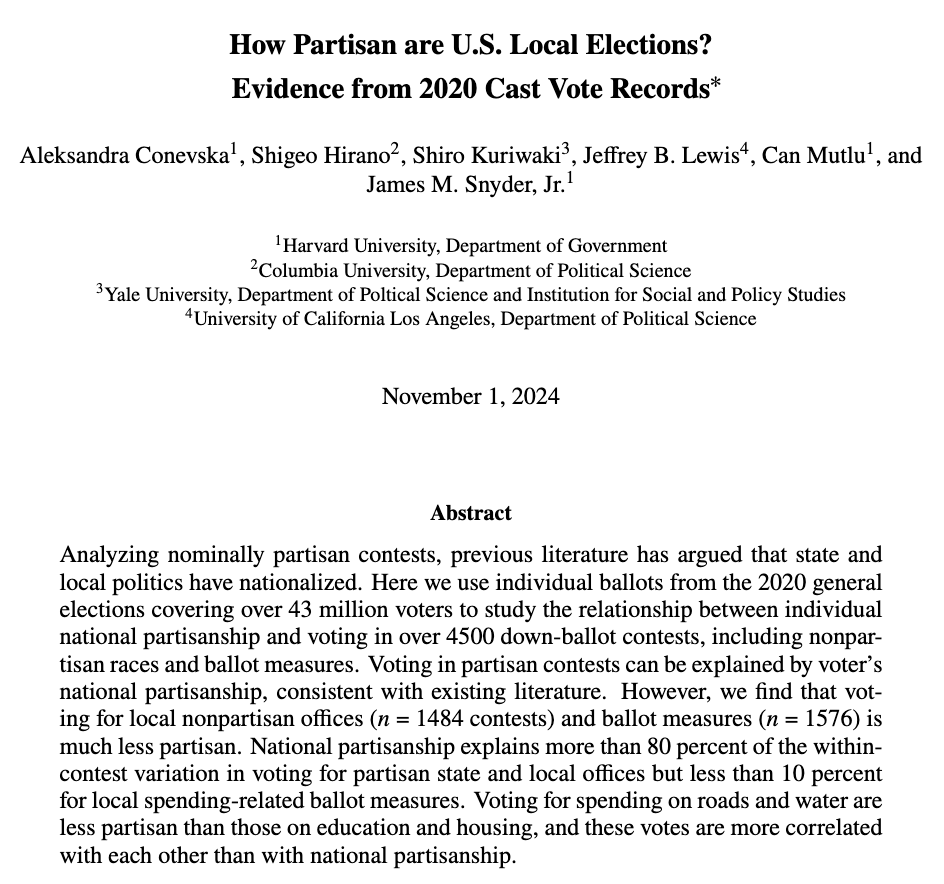
Our paper on how Democrats and Republicans vote on state/local referendums, nonpartisan offices, and partisan elections is in the latest issue of the American Political Science Review.
Feel free to contact us if you're interested in any aspect of this cast vote record data.
25 Nov 2024

How partisan is voting in US local elections? Our new preprint covering everything from state legislature down to hundreds of school board and local referendums: osf.io/preprints/osf/db3mj
2
11
53
7,478
Jake Jares retweeted

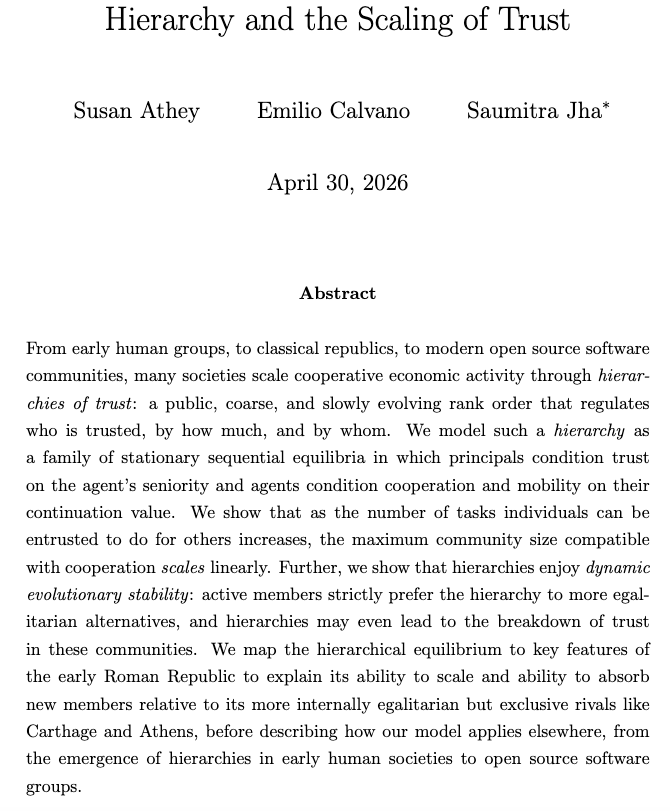
Fascinating paper by @Susan_Athey, Emilio Calvano, and @saumjha!
4
38
166
15,807
Jake Jares retweeted

15
38
2,771
Jake Jares retweeted

Apr 30
So, this is actually a common mistake! Frisch-Waugh-Lovell works by residualizing on the *right* (i.e. the x-axis), not only on the left. In this case you'd only recover the regression relationship by residualizing the HHI measure (with or without residualizing the rebellious activity measure)
I wrote a note about this a few years ago (link below)
Apr 30

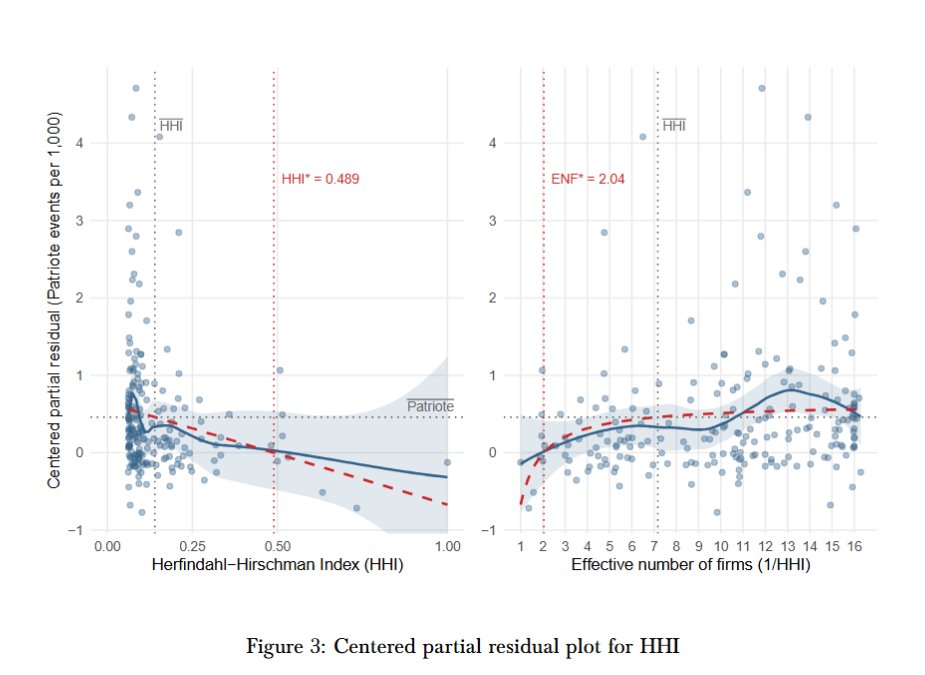
My graduate student Patrick Crawford introduced me to "partial residual plots" as a tool for showing relationships. Its so simple in elegance.
The partial residual plot below shows the conditional relationship between newspaper competition and rebellion after controlling for everything else. On the x-axis is market concentration (HHI: higher = fewer newspapers), and on the y-axis is the residualized level of rebellious activity.
Basically, the entire logic of the graph is for visualization. The regression has already controlled for other variables. What remains is the variation in rebellion intensity (depvar) attributable to the independent variable of interest. "Centered" just means both axes are normalized so that 0 corresponds to the sample mean. Positive values imply more rebellion than average (conditional on controls) (and vice-versa).
Now, its not exactly a new estimation method per se. But it does allow for a nice visualization of results that I had not seen and may even allow you to play with different functional forms with the residuals.
I know we should not care about "does it look cute" but I disagree with that sort of. I mean, at one point, we have to convince and convincing is really about cutting on inputs needed to (honestly) push a person from disbelief to acquiescence. That graph below is cutting down on inputs.
11
38
370
81,969
Jake Jares retweeted

Apr 27
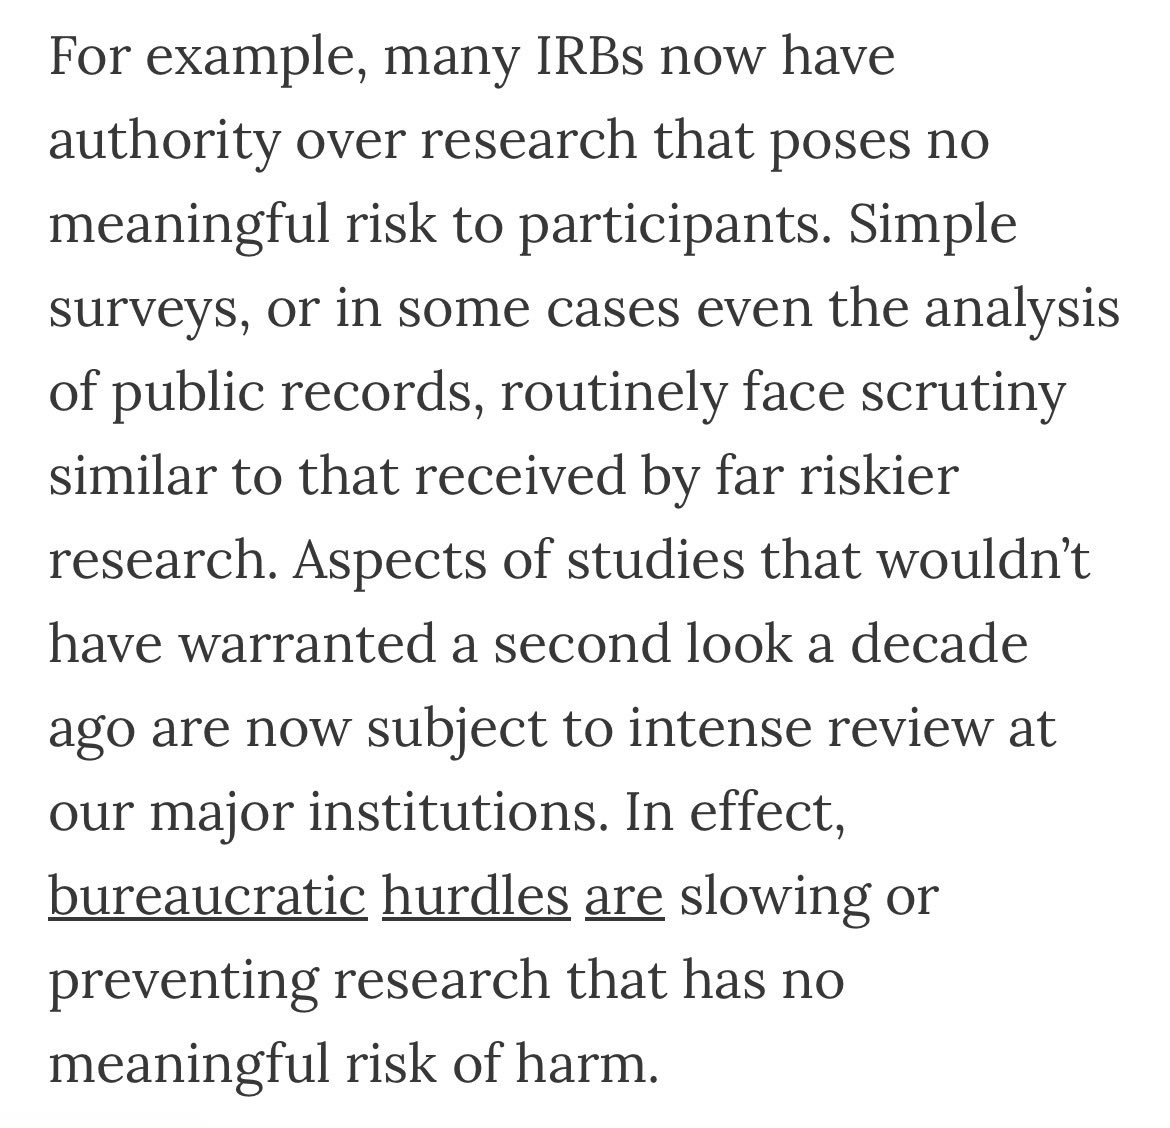
There really should be organized pushback from societies/associations. I am surprised that we have gone deep into the minutia of other aspsects of research, but largely let IRBs operate with impunity. I guess fear of retribution is powerful

This, from a guest @stuartbuck1 substack post on institutional review boards, is really spot on
2
5
31
3,084
Jake Jares retweeted

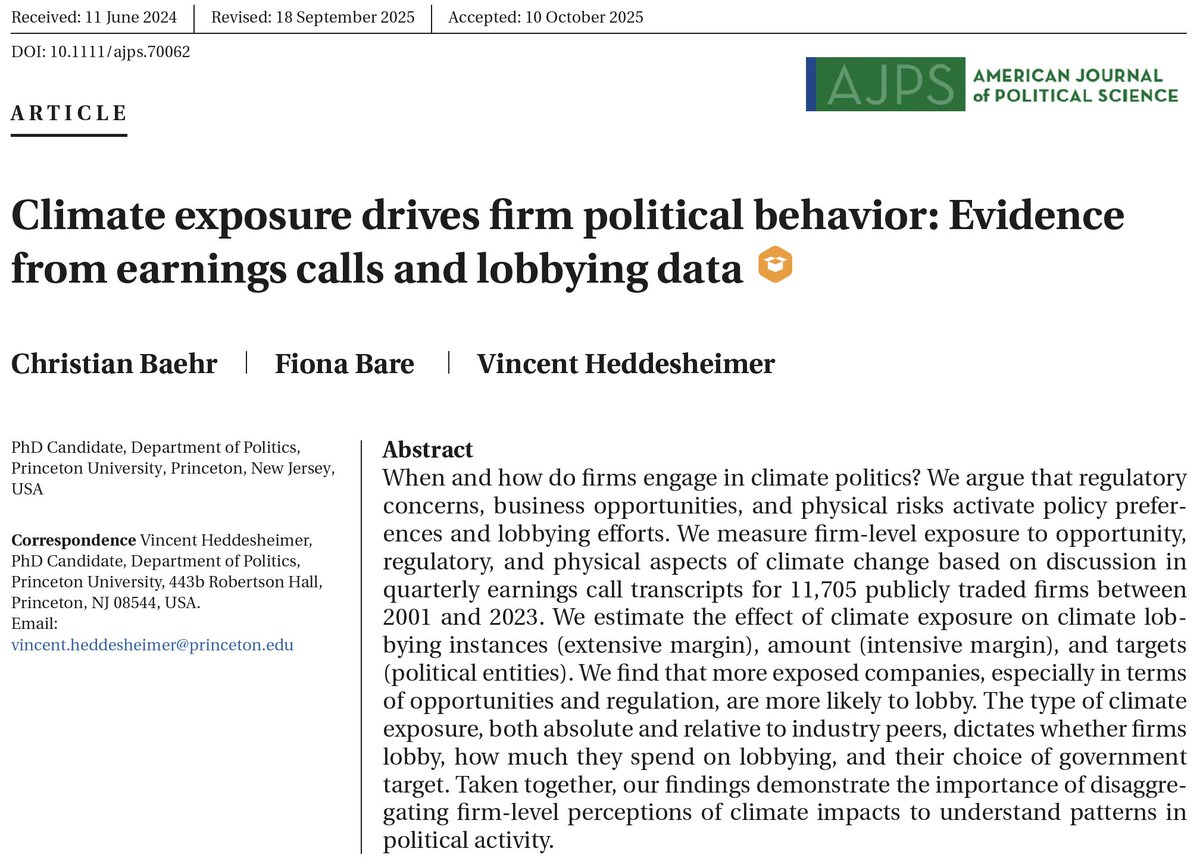
📢 New paper out in @AJPS_Editor with Christian Baehr (@christian_baehr) & Fiona Bare (@FionaBare):
"Climate Exposure Drives Firm Political Behavior: Evidence from Earnings Calls and Lobbying Data"
When & how do firms engage in climate politics? 🧵
🔗 doi.org/10.1111/ajps.70062
1
14
45
3,830

i can still live another 50 years if @Mike_Pence has the courage
Apr 27

Profoundly Moving. Start to Finish. Thank You @BenSasse for Your Personal Courage and Showing What it Means to Love Your Family and Love God🙏🏻
456
2,843
32,381
4,487,830

I just used 4.7 to create an 80 page primer on the history of budget airlines, incredible.
I didn’t read it but Claude made me a three bullet point summary.
I didn’t read that either but Openclaw put it in a markdown file to broaden my context.
I’m getting smarter every day.
22
170
3,981
101,963
Jake Jares retweeted
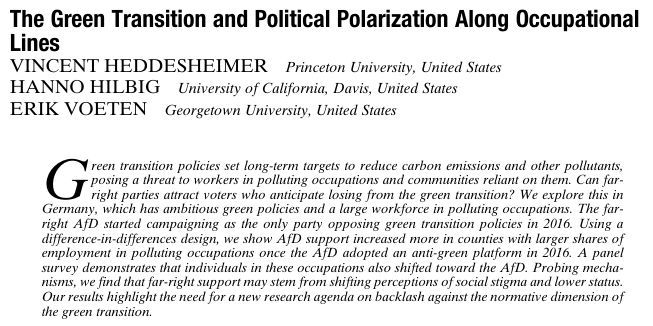
From our FirstView: The Green Transition and Political Polarization Along Occupational Lines by @VHeddesheimer, @hannohilbig and @ErikVoeten. doi.org/10.1017/S00030554251…
27
65
5,065
Jake Jares retweeted

Apr 15
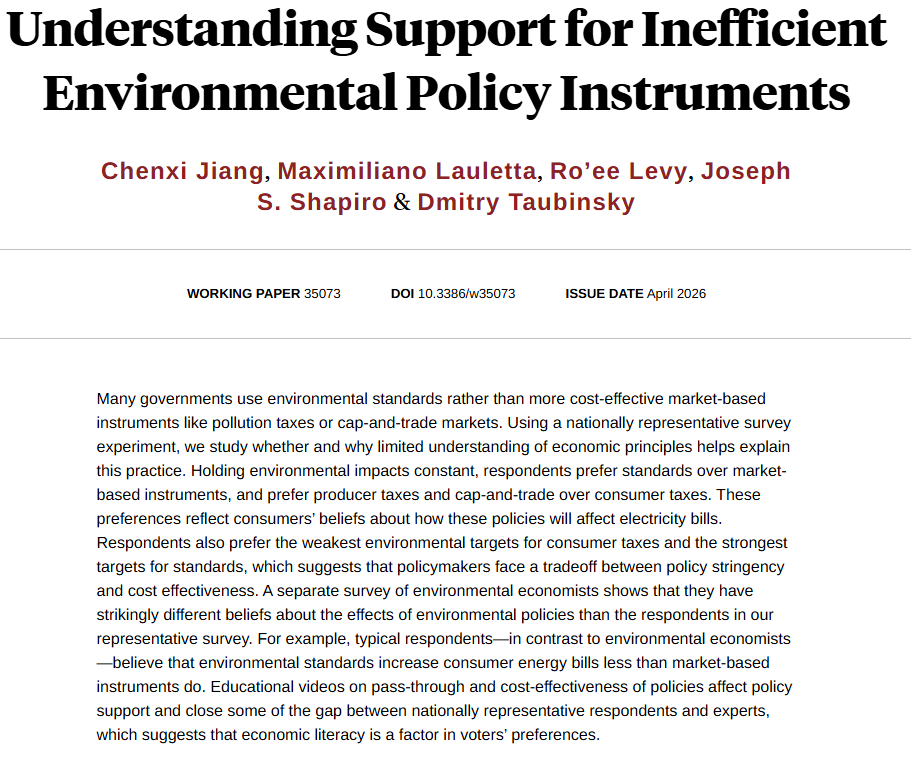
A short thread on a new paper studying why voters often prefer environmental standards over more cost-effective instruments, like taxes or cap-and-trade. With Chenxi Jiang @maxlauletta @_josephshapiro @DmitryTaubinsky. 1/8
3
24
57
11,883


Jake Jares retweeted

Apr 12
This may sound like a sponsored post but I promise it's not (I just hate TurboTax and their rent-seeking lobbyists with the passion of a thousand suns):
Use FreeTaxUSA instead. It's >90% cheaper than TurboTax and easier to use/higher quality software.

188
460
5,997
654,934