
Joined April 2022
- Tweets 6,167
- Following 104
- Followers 139
- Likes 45,144
613 Photos and videos


Markus Whitman retweeted

This was the counter event to UFC at the White House?
I think the culture war is over guys…
103
45
633
23,802
Markus Whitman retweeted

This woman discovers the ultimate Karen antidote while visiting Texas. Now, she says she never encountered any in the entire state until she got to the leftist conclave of Austin, where she had to endure three separate Karens. What’s her secret?
Fake a French accent and roast her to her face.
‘Are you one of those Karens we’ve seen online? With that haircut? From California?’
Karen shrinks, gets embarrassed, and walks away.
Pro tip: Europeans are ‘more cultured’ so they instantly self-destruct. Austin in shambles 😂🇫🇷
Now, not sure this all went down like she says it did, but who else is trying this next time?
241
1,326
9,888
484,063
Markus Whitman retweeted

Jun 15
Why did both these things have to be on at the same time!? I’m fanatically going back and forth during every commercial break!
Jun 15

Libs are counter-programming the UFC event at the White House. With this.
128
92
1,907
87,433
Markus Whitman retweeted

You should watch this.
Jun 14

This is a fairly long film in terms of what X likes, but it is one of the most important and detailed videos that absolutely everybody should bookmark, watch and share.
This is the most detailed evidence-based film about the Origins of the Palestinian Cause, right from its Nazi roots.
I cannot complement the producer of this film, @rehoov, enough. This is a masterpiece of historical significance.
I hope people like @MOSSADil @marklevinshow @DefiyantlyFree @BillAckman @ACTBrigitte @jihadwatchRS and others may share this to a much wider audience. It is so essential that the truth is seen by everyone, and the lies exposed.
21
287
987
58,493
Markus Whitman retweeted

Jun 15
Here is context for people who actually care about that sort of thing…
It was not Elon Musk personally taking a loan. It was Tesla Motors, the company, that received a $465 million loan from the U.S. Department of Energy in early 2010.
The loan came from the Advanced Technology Vehicles Manufacturing program, created by Congress in 2007 under President George W. Bush. The goal was to support American companies building more fuel-efficient vehicles and create jobs.
Tesla was not the only recipient. The same program gave much larger loans to other companies, including Ford for $5.9 billion and Nissan for about $1.4 to $1.6 billion. Fisker Automotive also received $529 million but later went bankrupt.
In May 2013, Tesla repaid the full $465 million plus interest and prepayment penalties — nine years ahead of schedule.
They used money from a successful stock offering. Taxpayers actually made a profit of roughly $12 to $26 million on the loan.
Elon Musk publicly thanked the Department of Energy and American taxpayers at the time.
Tesla used a program Democrats supported...they just used it far more successfully than other companies
BTW, I don't support these kinds of government programs, but for the leftists that only hate them when it suits their political objectives… you're all shameless hypocrites that are only pissed. Because Elin doesn't carry water for the left the way Soros and Steyr do.
26
338
2,447
16,762
Markus Whitman retweeted

Jun 15
Remember when Obama joked that Donald Trump would never be President and Trump hit back by strategically dismantling the entire Democratic Party over a 10 year period culminating with a UFC Fighter announcing that Michele Obama is a man.
Good times. Good times, indeed.
356
4,418
50,855
755,763
Markus Whitman retweeted

Jun 14
Can we debunk this nonsense?
Elon Musk was awarded (note: not given) cost-per-result contracts to perform a service for the US government. The total of those for SpaceX specifically is ~$22B, which includes repaid loans, state tax incentives, etc.
The deal was simple: put stuff into LEO at or below a set cost. If SpaceX does it below the set cost, SpaceX keeps the difference. If it doesn’t, the company is responsible for the overrun.
End result? SpaceX & Elon lowered the cost of getting 1 kg into LEO by 95-97% vs what NASA was paying previously.
And for the record, every other company around at the time was offered the same opportunity to bid on the contract - Musk/SpaceX just took it.
The handout narrative implies the taxpayer is the patron and SpaceX the dependent. The cost data shows the opposite: before SpaceX, NASA paid Russia’s Soyuz $80-86M per seat; SpaceX delivered at ~$55 million. SpaceX saved the US taxpayer $300M-$465M each year on that alone (the US sends 12-15 astronauts to space each year)
On the lunar lander, NASA estimated SpaceX’s fixed-price bid saved $20B-$30B vs the Boeing-preferred cost-plus approach.
So: SpaceX saved the US taxpayer more than the total value of contracts it earned on a single project, PLUS provided the US government with the requested services (put stuff in LEO) at the best possible price.
Jun 14

Elon Musk was given tens of billions in government contracts and tax breaks and was able to take a company that’s lost $41 billion and somehow become a “trillionaire.”
You will pay social security your whole life and they’ll tell you it’s an “entitlement” when you try to collect
453
3,139
12,619
1,290,418
Markus Whitman retweeted

Jun 12
Again for those in the back, Elon once offered to cut a check for $6 BILLION to the WFB to "eliminate World hunger" as they said the money could. His one condition was that the accounting was public.
They did not accept.
Jun 12

Elon Musk dismantled USAID programs that provided lifesaving assistance to millions of the world’s poorest and most vulnerable people. The human cost was enormous, while DOGE’s net fiscal impact was inconsequential.
Now, as Musk approaches trillionaire status, he should commit/tithe at least $100 billion to a fund dedicated to combating extreme poverty, hunger, preventable disease, and humanitarian crises worldwide.
Money alone cannot undo the damage already done. But if this moment marks an unprecedented personal financial milestone, it should also be an opportunity for an unprecedented act of restitution. Musk has the resources to save and improve countless lives. He should use them.
605
17,514
89,162
1,844,050
Markus Whitman retweeted

Jun 12
HOLY FREAKING SHIT!!!! 🫳🎤🔥
417
2,428
13,640
338,714
Markus Whitman retweeted
Jun 12
Look, you clowns. I didn’t “defend Epstein.” I am still waiting for hard evidence of pre-pubescent kids being fucked on that island and I don’t like the word “pedophile” being diluted by gross pervs who fuck 16-year-olds.

@Gavin_McInnes should be ashamed of himself for defending Epstein what's wrong with these people
562
52
995
150,662
Markus Whitman retweeted

Jun 10
MUST WATCH: Cam Higby DISMANTLES Phil Tourney's claim that the USS Liberty accident was actually a false flag attack.
Tourney alleges that Israel (and US President Johnson) wanted to blame the USS Liberty attack on Egypt in order to drag the US into World War III against Egypt.
Cam Higby corrects Tourney:
- Egypt's Air Force had already been destroyed three days before (making it impossible to blame Egypt for an air assault)
- Israel had already fully taken Sinai from Egypt
- Egypt was already about to surrender on the same day
Wow.
45
123
765
26,811
Markus Whitman retweeted

Jun 9
WATCH: Rep. Brandon Gill (R-TX): Your organization said that restricting and banning abortion is a tool that the far right uses to maintain white supremacy. Do you believe that pro-lifers are white supremacist?”
SPLC CEO Bryan Fair: “Ummm, I believe that reproductive liberty is... I can’t answer that question yes or no.”
Brandon Gill: “How many babies that are in the United States that are aborted are black?”
Bryan Fair: *Speechless*
Brandon Gill: “About 40% of abortions nationwide are of black babies—blacks represent about 13% of the population. Does that sound like something a white supremacist would oppose?”
I love this guy!
248
4,514
21,857
475,287
Markus Whitman retweeted

Elon Musk defended America better than every politician in Washington combined.
Musk: “After World War 2, the US could have basically taken over the world and any country. Like we got nukes, nobody else got nukes. We don’t even have to lose soldiers. Which country do you want?”
One nation on earth held a weapon nobody else had.
Total dominance. Zero competition. No risk of retaliation.
Every empire in history that held that kind of advantage used it.
Rome. The Mongols. The British. The Ottomans.
They conquered until they collapsed.
America had a bigger advantage than all of them combined.
And it rebuilt the countries it just defeated.
Musk: “The United States actually helped rebuild countries. So it helped rebuild Europe, it helped rebuild Japan. This is very unusual behavior, almost unprecedented.”
Almost unprecedented?
It had never happened before. Not once in 5,000 years of recorded history.
The Marshall Plan wasn’t foreign aid.
It was the most radical act of restraint any superpower ever committed.
America turned its enemies into allies. Turned rubble into economies. Turned surrender into partnership.
Germany went from ashes to the economic engine of Europe in a generation.
Japan went from unconditional surrender to the third largest economy on earth.
Three years after the war, America was flying food into Berlin.
A city in the heart of the nation that just tried to destroy it.
That’s not policy.
That’s a civilization deciding what it is at the exact moment it has the power to be anything.
You’re being told a story right now.
That America is the villain of history.
You hear it everywhere. Media. Universities. Social platforms.
Musk: “There’s always like, well America’s done bad things. Well of course America’s done bad things, but one needs to look at the whole track record.”
Every nation on earth has dark chapters. Every single one.
The difference is what a country does when nobody can stop it.
And when nobody could stop America, it fed its enemies and rebuilt their cities.
Musk: “The history of China suggests that China is not acquisitive. Meaning they’re not going to go out and invade a whole bunch of countries.”
Probably right.
China has historically built walls, not fleets.
But the real question isn’t about borders anymore.
We’re approaching a moment that mirrors 1945 in ways nobody has fully processed yet.
AI is going to give a handful of people a power advantage that makes nuclear monopoly look quaint.
If someone is going to hold that kind of power, who do you want it to be?
The country that conquered when it could? Or the one that rebuilt when it didn’t have to?
Every alliance. Every trade route. Every economy.
Billions lifted out of poverty.
All of it traces back to one act of restraint that had never been done before.
And carries no guarantee of being repeated.
The most powerful thing America ever did wasn’t building the bomb.
It was what it didn’t do after.
205
1,320
3,709
96,322
Markus Whitman retweeted

The FINAL tally on anything between President Trump and Jeffrey Epstein....ALL OF IT‼️
1.39 million documents scrutinized for ANY references to President Trump.
LISTEN 👂
#Epstein
300
1,741
6,646
71,531
Markus Whitman retweeted

Were liberals-Antifa PAID to disguise themselves as MAGA Trump supporters to start the J6 riot so President Trump and the rest of us would be the ones to get the blame for it?! 😡
281
3,163
4,738
43,350
Markus Whitman retweeted

Jun 8
Let’s review. California:
- Made it illegal to show voter IDs
- Mass mail-in ballots across the state
- Allows people to print ballots at home
- Allows people to register anywhere in the state
- Allows ballot harvesting
- Allows people to register with “IDs” like gym memberships & insurance cards
- Allows people to hand-date ballot envelopes, no postmark required
- Has 853,000 “ghost voters”
- Sanctuary state that harbors illegal aliens
- Refuses to turn over dirty voter rolls for verification
- Refuses to allow independent signature verification audit
- Refuses to allow ballot inspection audit
This isn’t exactly “subtle.” It’s a blueprint for stealing elections.


276
2,556
5,617
120,732
Markus Whitman retweeted

Jun 8
Useful Idiot Kristen Welker's PATHETIC defense of California election fraud DEBUNKED
Larry O'Connor takes Welker to task for the rigged system she's dismissing.
"The real scandal coming out of California right now is quite possibly every single thing we are seeing transpire before our very eyes is 100% legal."
O'Connor explains that anyone with a functional brain can see what's happening in California and know that the election is being stolen.
"You can steal something and not break the law. And that's what's happening here. They are stealing it without actually breaking the law."
As a former Californian resident, O'Connor breaks down the entire process.
"This is the election system in California as we speak. Anybody who is a registered voter gets a ballot mailed to them, and you register to vote because you walk into a DMV, and you automatically get registered no matter what. And as you know, California leads the nation in giving driver's licenses and registrations to illegal immigrants, people who are in the country illegally, and they're getting driver's ed. They're getting commercial driver's license in California right now. And when you go through the process, they register you to vote. And there is no check for citizenship. There's no check for ID, there's no check for anything. And they'll register to vote. And you're on the voter rolls."
O'Connor even stated he hasn't lived in Los Angeles County since 2012, and he's STILL being notified by email that his ballot has been mailed to him.
"I don't know who's got it. Whatever address I used to live in has has the Lawrence O'Connor ballot, and I'd love to know if I voted. I probably have without anyone knowing it."
And then comes the issue of ballot harvesting...
"In California, individuals can go and collect ballots from anyone. They can go and knock on the doors and say, 'Hey, give me your ballot. I'll take care of it for you' legally. And those people who knock on your door and collect your ballot, they call it 'ballot harvesting,' they can work for political entities. They can work for political action committees."
"They can go and they can pick and choose what ballots they want to collect. And they bring them in or they don't. And every mail in ballot, there is no ID required for every single mail in or drop box ballot. All you've got to do is sign the ballot. But of course, it would be discriminatory to allow somebody who is illiterate and can't write their name to not vote."
"So when you sign your ballot, you can just make a mark. You can make a smiley face if you want, but it's witnessed. Don't worry. There's a little box for a witness to sign. But of course, there's no name associated with a witness. It's just a signature. And oh, by the way, when those ballots are collected, the witness signature isn't checked."
"They just check that there is a signature for a witness. So, of course, there's nothing keeping people from making a little mark on the signature for the voter. And then that same person squiggling the witness box, putting it in an envelope and then having those votes come in. Oh, what else are they doing in California? Well, they allow ballots that come in as late as a week after Election Day to be counted. That doesn't seem right. Oh. It's okay. The ballot had to be mailed or put into a Dropbox or delivered by Election Day. But of course, if it's not postmarked, they'll overlook that. If there's no postmark at all on the envelope, they'll just look at whatever date you put on it and they'll trust you, and then they'll count the ballots."
"Every single thing I just described for you is accurate and legal. They're not breaking the law. They're following the laws that they have written so that they can get away with this garbage and everyone knows it."
@LarryOConnor
421
1,925
6,017
150,058
Markus Whitman retweeted
Jun 9
Me knowing I make liberals cry.
732
1,369
17,066
238,444
Markus Whitman retweeted

Jun 9
I am the only person who has ever debated a survivor of the USS Liberty incident.
The myth of intentional attack was fully obliterated and the lies of people like Phil Tourney were thoroughly illuminated.
548
310
2,816
116,102
Markus Whitman retweeted

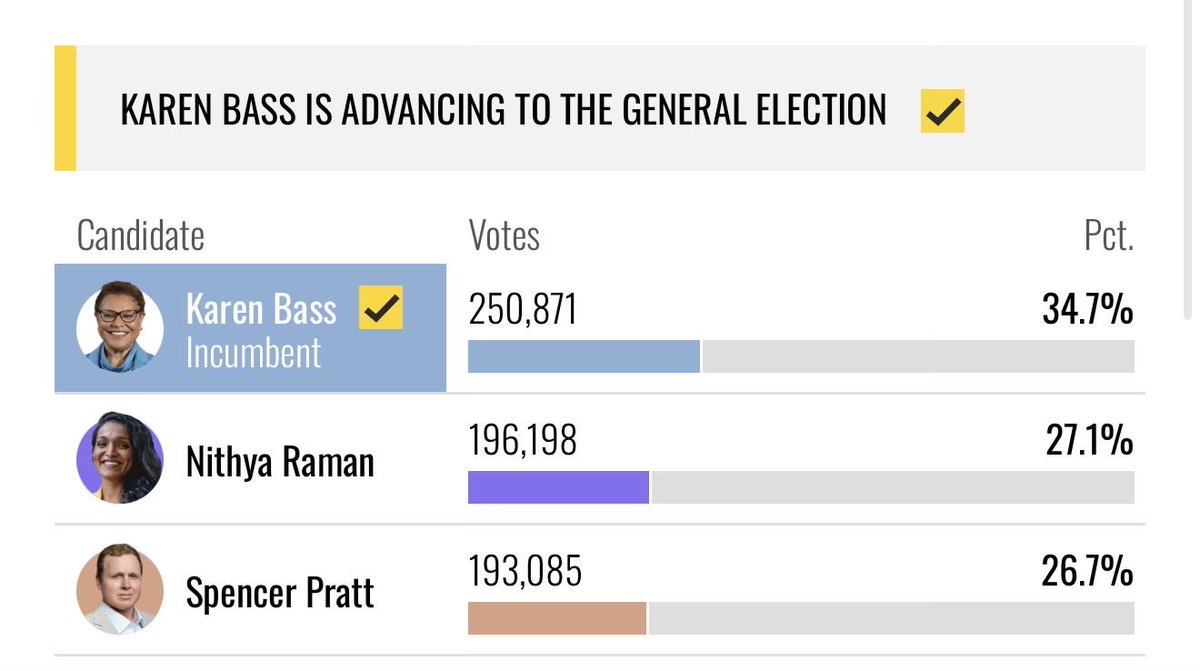
THE FORMULAS
WHAT THEY MEAN AND WHY THEY MATTER
I derived four deterministic linear formulas from the ballot drop data:
Raman% = 27.87 (3.19 × drop number)
Pratt% = 22.05 - (1.17 × drop number)
Bass% = 40.20 - (1.86 × drop number)
Other% = 9.88 - (0.16 × drop number)
The Starting Points
The constants - 27.87, 22.05, 40.20, 9.88 - represent each candidate’s baseline. Where they genuinely stood when post-election counting began. Real votes. Organic support. These are the numbers before anything unusual occurs.
The Slopes - How the Formula Runs
The slope is the increment applied to each candidate every single drop. It gets multiplied by drop number - 1, 2, 3, 4 - which means the effect escalates automatically with each drop.
So for Raman it isn’t just plus 3.19% every drop. It’s:
Drop 1: 27.87 (3.19 × 1) = 31.06%
Drop 2: 27.87 (3.19 × 2) = 34.25%
Drop 3: 27.87 (3.19 × 3) = 37.44%
Drop 4: 27.87 (3.19 × 4) = 40.63%
Drop 5 predicted: 27.87 (3.19 × 5) = 43.82%
Each drop pushes her further from her baseline. It is built in. Automatic by design.
The slopes also sum to exactly zero.
3.19 - 1.17 - 1.86 - 0.16 = 0.00
Every percentage point Raman gains comes precisely from the other three candidates/groups combined. This is a closed system. Conservation of votes. The formula doesn’t create votes - it redistributes them.
The R Values - The results were remarkable
To validate these formulas I ran linear regression analysis. The Pearson correlation coefficients, R values, came back as follows:
Raman vs Pratt: R = 0.9966
Raman vs Bass: R = 0.9934
Raman vs Batch: R = 0.9984
Raman vs Other: R = 0.9794
R values measure how perfectly data fits a straight line. They run from 0 to 1.
0 means completely random.
No pattern whatsoever.
1 means a perfect straight line.
Every point exactly where predicted.
For context:
0.70 is considered strong in social science research.
0.85 gets researchers excited.
0.90 is extraordinarily rare in human behavioral data.
Squaring them to get R² values:
Raman vs Pratt: R² = 0.9932
Raman vs Bass: R² = 0.9869
Raman vs Other: R² = 0.9592
Raman vs Batch: R² = 0.9968
That last number, 0.9968, means that 99.68% of Raman’s vote share movement across these drops is explained by a single variable. Drop number. Nothing else. Just counting to five.
You get R values like that in physics experiments. In controlled laboratory conditions. Measuring the expansion of metal under heat. Not in elections. Not in a major American city with millions of diverse voters casting ballots across weeks.
The Slope Relationship
The slope of 3.110 between Raman and Pratt is particularly significant.
It means for every percentage point Pratt lost Raman gained 3.110 points. Every drop. Without variation. Without noise.
Candidates in a democratic election don’t move in mathematical opposition to each other at a fixed ratio across 200,000 ballots. Four variables in an equation do.
Why The Shutoff Had To Exist
Because drop number keeps increasing, the formula keeps pushing percentages further from baseline. Left unchecked by drop 7 the math produces:
Raman: 27.87 (3.19 × 7) = 50.2%
Pratt: 22.05 - (1.17 × 7) = 13.9%
Bass: 40.20 - (1.86 × 7) = 27.2%
So the formula was never intended to run to completion. It was designed to run until a specific objective was achieved, Raman leading Pratt by a sufficient margin to secure the runoff and then stop.
The stopping condition appears to have been triggered at approximately 38,000 votes into drop 5. The precise moment Raman crossed 3,000 votes ahead of Pratt.
After that point the remaining 9,800 votes in drop 5 distributed at approximately the baseline that existed after drop four.
The formula completed its task. Then it stopped. And the numbers went back to looking normal.
85
328
981
48,794