
Trivenor Digital OÜ Presents 4 Content Performance Indicators That Brand Teams Misread as Audience Growth
#contentperformance #contentmarketing #pressrelease #pressreleaseservice @247pressnews
Press release: 24-7pressrelease.com/press-r…
4

Mar 24
ITVR: One View of Your Audience Across Every Screen and Platform
What if the entire world watched television at the same time—and you could see it all at once, turning that view into smarter decisions?
No fragmented ratings.
No delayed reports.
No disconnected datasets across countries and platforms.
Just one clear, unified view of how the world is watching—right now.
That breathtaking moment of total clarity is no longer out of reach.
MediaLogiq’s #ITVR is redefining global television intelligence. In an industry flooded with data but lacking cohesion, #ITVR brings together program-level audience measurement from 90 markets into a single, standardized view.
The same title. The same episode. The same moment—matched and aligned across languages, territories and platforms.
What once required weeks of manual reconciliation now happens in seconds.
Studios, broadcasters, distributors and investors no longer have to infer performance across markets or piece together fragmented insights. With #ITVR, they can:
▪ Track audience performance across regions in real time
▪ Compare content consistently across platforms
▪ Identify emerging global hits earlier
▪ Make faster, smarter, more informed strategic decisions
Because when you can see your audience clearly—across every screen and every platform—you don’t just respond to the market.
You get ahead of it.
The era of fragmented television data is over.
This is global audience intelligence—connected.
Step into the future of global television intelligence with #ITVR—your single source for real-time, cross-platform audience insights that transform data into decisive action.
Discover the possibilities at MediaLogiq Systems website (medialogiq.com/itvr).
Contact us at info@medialogiq.com to request your demo today.
#InternationalTVResearch #AudienceAnalysis #TVAnalytics #GlobalTVAudience #audiences #ContentPerformance #ContentTracking #TelevisionAudienceMeasurement #AudienceMeasurement #viewers #TVRatings #TVAudienceAnalytics #MediaAnalytics #TAM #CrossMarketAnalytics #EntertainmentIntelligence #TVContentPerformance #GlobalTVInsights #BroadcastAnalytics #TVViewership #ProductTracking #TelecastTracking #media #entertainment #tv #content #SaaS #software

3
5
46

17 Sep 2025
Connect With Us at MIPCOM 2025!
Medialogiq Systems is attending MIPCOM 2025 at the Palais des Festivals, Cannes, from October 13–16, 2025. We would appreciate the opportunity to discuss your needs and demonstrate how our solutions can benefit your business.
Please let us know if you would like to arrange a live demo session during the event.
Contact us at info@medialogiq.com or visit our website at medialogiq.com/contact-us to book a meeting.
We look forward to connecting with you at the event.
#MIPCOM2025 #MIPCOM #Cannes #MediaLogiq #MediaLogiqSystems #InternationalTVResearch #ITVR #MediaRights #TVAnalytics #ContentTracking #AudienceMeasurement #TVRatings #TAM #TelevisionAudienceMeasurement #AudienceReporting #AudienceAnalytics #AudienceAnalysis #TelecastPerformance #ContentPerformance #FilmDistribution #TVDistribution #ContentDistribution #FilmDistributionSoftware #TVDistributionSoftware #RightsLicensing #RightsManagement #RightsTracking #RightsManagementSoftware #entertainment #media #content #film #movies #tv #tvseries #tvprogram

2
5
43
2 Sep 2025
Questions About Global Content Tracking? ITVR Has the Answers
(Part 2)
Your content circulates, evolves and creates value across borders. But tracking that movement is more challenging than ever.
With so many platforms, territories and competitors in play, even basic questions like what’s airing, where and when can quickly turn into complex strategic puzzles.
That’s where risk lives.
That’s where opportunity hides.
ITVR works like your radar.
Designed for broadcasters, distributors, strategists and researchers, #ITVR monitors how content moves across the global TV landscape with speed, precision and real-world business context.
It turns scattered broadcast data into clear, actionable insight.
Every day, teams rely on #ITVR to answer critical questions like:
▪ How many runs of Planet Rescuers did a licensee take in the past year?
▪ Which of my competitors’ dramas are currently airing in the Czech Republic?
▪ Which markets are airing the format Design Challenge Pros?
▪ What is the licensing footprint of The Big History Quiz across CEE markets?
▪ Has Cooking with Fire premiered in France yet, or is it still unexploited?
▪ Are competitors licensing my genre in new markets I haven’t entered yet?
With #ITVR, you gain the visibility to move with clarity and the confidence to stay ahead.
Learn more on our website (medialogiq.com/itvr) or contact us at info@medialogiq.com to request further information.
#TVAnalytics #whatpeoplewatch #audiences #ContentTracking #AudienceMeasurement #viewers #TelevisionAudienceMeasurement #TAM #AudienceReporting #AudienceAnalytics #AudienceAnalysis #TVRatings #LinearAudienceSubscriptions #TVChannelRankings #TelecastPerformance #LeadInAnalysis #LeadOutAnalysis #ContentPerformance #entertainment #media #content #film #movies #tv #tvseries #tvprogram

2
4
33
25 Aug 2025
Questions About Global Content Tracking? ITVR Has the Answers
(Part 1)
What aired? Where did it air? Has it aired yet?
These questions may seem simple. But when you are trying to answer them across dozens of countries, hundreds of broadcasters and thousands of hours of programming, the reality is far more complex.
ITVR simplifies that reality.
Built for professionals who need accuracy and speed, #ITVR provides detailed insight into what is airing, where it is airing and how content is circulating across the global television landscape. From acquisitions and sales to programming strategy and competitive analysis, #ITVR transforms scattered broadcast data into clear and usable intelligence.
It goes beyond basic listings. #ITVR helps you track content movement, spot gaps in the market and uncover new opportunities before your competitors do.
Here are just a few of the questions #ITVR helps answer every day:
▪ Where has Blue Dragon aired to date, and on which channels?
▪ Which broadcaster topped the primetime share rankings in Norway in Q2?
▪ Which countries are the main sources of imported comedy series in the U.K.?
▪ What aired in primetime on Sweden’s TV4 during the first week of June?
▪ What is the current broadcast share of unscripted lifestyle programming in Switzerland?
▪ Which nature documentaries have not been aired on free-to-air channels in Austria?
For every question about global content, #ITVR provides the clarity to move forward with certainty.
Learn more on our website (medialogiq.com/itvr) or contact us at info@medialogiq.com to request further information.
#TVAnalytics #whatpeoplewatch #audiences #ContentTracking #AudienceMeasurement #viewers #TelevisionAudienceMeasurement #TAM #AudienceReporting #AudienceAnalytics #AudienceAnalysis #TVRatings #LinearAudienceSubscriptions #TVChannelRankings #TelecastPerformance #LeadInAnalysis #LeadOutAnalysis #ContentPerformance #entertainment #media #content #film #movies #tv #tvseries #tvprogram

2
4
27
19 Aug 2025
Television Audience Measurement: Behind the Ratings That Shape the Broadcast Industry
Every second, millions of viewers switch channels, stream shows, skip ads or binge-watch their favorite series. Capturing this whirlwind of behavior with accuracy and depth is the mission of Television Audience Measurement (TAM), the behind-the-scenes hero that turns fleeting attention into concrete insights.
As media habits continue to evolve, audiences no longer watch TV in a linear predictable way. Viewers jump between live broadcasts, on-demand platforms, mobile devices and social media screens. This fragmentation creates enormous challenges for broadcasters, advertisers and content creators who need to understand not just how many people watch but also who they are, when they watch and how they engage.
TAM is the critical system that deciphers this complexity. It transforms vast amounts of raw data into actionable intelligence, enabling media stakeholders to make informed decisions — whether choosing which show to greenlight, identifying the best time slot to run an ad or tailoring content to target demographics.
As television viewing habits continue to evolve rapidly, so must the tools that measure them. This includes developing measurement techniques that account for hybrid viewing patterns — spanning traditional TV, OTT platforms, mobile, and social media video — with consistent methodologies across all devices. This article will explore the essentials of TAM: what it is, how it works, why it matters and how the industry is innovating to meet the demands of the modern viewer.
What is TAM?
Television Audience Measurement (TAM) is the process of collecting, analyzing and interpreting data regarding who is watching television, what they are watching, when and for how long. The primary goal is to provide statistically accurate insights into viewer habits and program performance.
TAM plays a critical role in the media and advertising industries. It allows:
▪ Broadcasters to determine the popularity of their shows.
▪ Advertisers to optimize their ad placements.
▪ Media planners to allocate budgets effectively.
▪ Regulators and policymakers to maintain transparency in media ownership and fair advertising practices.
At its core, TAM serves as a kind of “audience currency,” an agreed-upon system that helps different stakeholders assess the value of television content and commercial airtime.
Behind the Scenes of TAM
The process of measuring television audiences is complex and highly technical. It involves both sampling techniques and electronic measurement technologies. Here’s a breakdown of how TAM works:
1. Sampling
Since it is impractical to monitor every household in a country, TAM agencies create a representative sample of households that reflects the population’s demographic and geographic diversity. These households agree to have measurement devices installed on their televisions.
To maintain accuracy, panels are periodically refreshed to avoid “panel fatigue” and to ensure they remain demographically representative of the changing population.
Sample sizes vary by country. For example:
▪ In the U.K., Barb Audiences measures viewership through about 5,300 homes.
▪ In the U.S., Nielsen uses a combination of people meters and set-top box data across thousands of homes.
▪ In France, Médiamétrie maintains a panel of around 5,000 households.
▪ In Canada, Numeris uses a panel of approximately 4,500 households.
▪ In Brazil, Kantar IBOPE Media uses a panel of about 2,000 to 3,000 households.
2. People Meters
A people meter is an electronic device connected to each television in the panel households. Every family member is given a button or a remote identifier to press when they start or stop watching TV. The meter logs:
▪ Channel being watched
▪ Time spent
▪ Viewer’s demographic data (age, gender, etc.)
Under-reporting can occur if viewers forget to log in or out, often called “button fatigue.” To address this, some systems are moving toward passive monitoring technologies that can auto-detect a viewer’s presence without manual input.
3. Return Path Data (RPD) and Smart TV Integration
With the rise of digital cable and satellite services, some TAM systems also collect return path data from set-top boxes. Increasingly, these large data sets are calibrated against panel-based measurements to create hybrid TAM systems that combine statistical representativeness with massive scale.
In addition, Smart TVs and connected devices are increasingly being integrated into TAM systems through audio watermarking or automatic content recognition (ACR) to capture viewing data across linear and streaming platforms.
4. Data Processing and Reporting
The data collected is transmitted to central servers where it is validated, processed and analyzed. Reports are then generated for stakeholders, providing insights such as:
▪ Television Rating Points (TRPs)
▪ Reach and frequency
▪ Time spent per channel or show
▪ Program ranking
▪ Genre popularity
Key Metrics in TAM
Understanding TAM involves familiarity with several essential metrics:
▪ Television Rating Point (TRP): Indicates the percentage of the total target audience that watched a specific program. A TRP of 5 means 5% of the target group watched the show.
▪ Reach: The total number of unique viewers who watched a program for at least a minimum defined duration (e.g., 1 minute or 3 minutes).
▪ Impressions: Impressions represent the total number of viewing occurrences, possibly including repeat viewers — sometimes referred to as “contacts” in TV research, to differentiate from digital ad impressions.
▪ Share: The percentage of the total TV-watching audience tuned to a specific program at a particular time.
▪Time Spent: Average duration each viewer spent watching a program.
These metrics inform decisions on content development, media planning, pricing of advertising slots and audience targeting.
The Role of TAM in the Industry
The importance of TAM extends across the entire television value chain:
▪ For Broadcasters:
TAM helps broadcasters understand which programs are successful, which time slots attract the most viewers and what kind of content resonates with different demographic segments. It guides programming strategy, scheduling and content investment.
▪ For Advertisers and Brands:
For advertisers, every second of airtime counts. TAM allows them to:
• Select the right time slots and programs.
• Measure ad campaign reach and effectiveness.
• Optimize media budgets.
• Maximize ROI.
For instance, if a sports channel sees high TRPs during live football matches among 18–34-year-old males, it becomes a premium advertising slot for brands targeting that demographic.
▪ For Media Planners and Agencies:
Media planners use TAM data to craft efficient ad campaigns by targeting specific demographics and analyzing which channels or shows deliver the best value per viewer.
▪ For Regulators and Researchers:
Regulatory bodies rely on TAM to ensure transparency in media practices and monitor the diversity of content. Academic researchers use TAM data to study media consumption trends and audience behavior.
Global TAM Providers
Different countries and regions have dedicated organizations responsible for TAM:
▪ United States: Nielsen Media Research (nielsen.com/)
▪ United Kingdom: Barb Audiences (barb.co.uk/)
▪ Canada: Numeris (numeris.ca/)
▪ France: Médiamétrie (mediametrie.fr/)
▪ Sweden/Nordics: MMS (Mediamätning i Skandinavien) (mms.se/)
▪ Several European and Asian markets: Kantar Media (kantarmedia.com/)
▪ Brazil and Latin America: Kantar IBOPE Media (kantaribopemedia.com/)
▪ Australia: OzTAM (oztam.com.au/)
Each organization may use slightly different methodologies but follows global standards to ensure accuracy and reliability.
Challenges in TAM
Despite its usefulness, TAM faces several challenges:
▪ Sample Limitations: Accuracy depends heavily on sample quality. If the sample isn’t truly representative, the data can be skewed — even more so if panels are not refreshed regularly or fail to track emerging demographic groups.
▪ Changing Viewing Habits: Audiences are shifting to non-linear viewing on OTT platforms, apps and smart TVs. Traditional TAM struggles to fully capture cross-platform behavior.
▪ Privacy Concerns: Increased data collection raises concerns about privacy and consent.
▪ Ad-Skipping and Multiscreen Behavior: Viewers may skip ads or multitask, reducing the effectiveness of metrics based solely on viewership. Measuring actual attention — whether someone is truly in the room and engaged — remains an open technical and methodological challenge.
The Future of TAM
The future of TAM lies in integration and innovation. Here’s where the industry is headed:
▪ Cross-Platform Measurement: Unified tracking across linear TV, OTT platforms, mobile apps and social media video.
▪ Real-Time Analytics: Near-instant reporting for faster decisions.
▪ Big Data and AI: Deeper behavioral analysis and trend forecasting.
▪ Hybrid Models: Combining panel data with big data for accuracy and depth.
ITVR: Revolutionizing Global Audience Analytics
As the television landscape becomes increasingly global and fragmented, Medialogiq Systems’ #ITVR platform emerges as a groundbreaking solution to unify and elevate audience measurement across markets.
#ITVR is a cloud-based analytics platform that integrates data from over 90 markets, consolidating audience measurement from TAM providers like Nielsen Media Research, Barb Audiences, Numeris, OzTAM, Médiamétrie, Kantar Media and Kantar IBOPE Media. This enables broadcasters, distributors, advertisers and researchers to perform seamless cross-market analysis.
The platform standardizes program ID and classification using a proprietary mapping system, ensuring consistent and comparable insights. #ITVR offers extensive reporting options with demographic filters, channel groupings and product segments tailored to user needs.
With real-time analytics, users gain instant access to trends, rankings and advertising performance across time intervals. Rich metadata includes time-slot performance, distributor breakdowns and revenue insights to support informed decisions.
Designed for ease of use, #ITVR features an intuitive interface with smart text prompting, multi-level filtering and automatic data refresh for a smooth experience.
As technology and viewing habits evolve, TAM must keep pace. The challenge and opportunity lie in building systems that capture the full spectrum of media consumption, ensuring every view counts, across every screen, in every household. With innovative platforms like Medialogiq’s #ITVR, the industry is equipped to meet these challenges head-on, ensuring accurate, comprehensive and actionable audience measurement in an increasingly complex world.
Learn more on our website (medialogiq.com/itvr) or contact us at info@medialogiq.com to request further information.
#TVAnalytics #whatpeoplewatch #audiences #viewers #TelevisionAudienceMeasurement #TAM #AudienceReporting #AudienceAnalytics #AudienceAnalysis #TVRatings #MediaMeasurement
#ViewershipAnalytics #TVMetrics #AudienceResearch #LinearAudienceSubscriptions
#TVChannelRankings #TelecastPerformance
#ContentPerformance #TelevisionRatingPoint #TRP #AudienceShare #Impressions #TimeSpentViewing #PeopleMeters #ReturnPathData #RPD #AudioWatermarking #LeadInAnalysis #LeadOutAnalysis #entertainment #media #content #film #movies #tv #tvseries

2
4
322

13 Aug 2025
@Siteimprove Introduces Siteimproveai – The First Enterprise Agentic Content Intelligence Platform
Read More: martech360.com/tech-content/…
#AccessibilityAgents #AnalyticsAgents #ContentAgents #contentintelligence #contentperformance #martech360 #news #OrchestrationAgents
ALT Siteimprove® Introduces Siteimprove.ai – The First Enterprise Agentic Content Intelligence Platform Siteimprove® Introduces Siteimproveai – The First Enterprise Agentic Content Intelligence Platform
1
2
37
6 Aug 2025
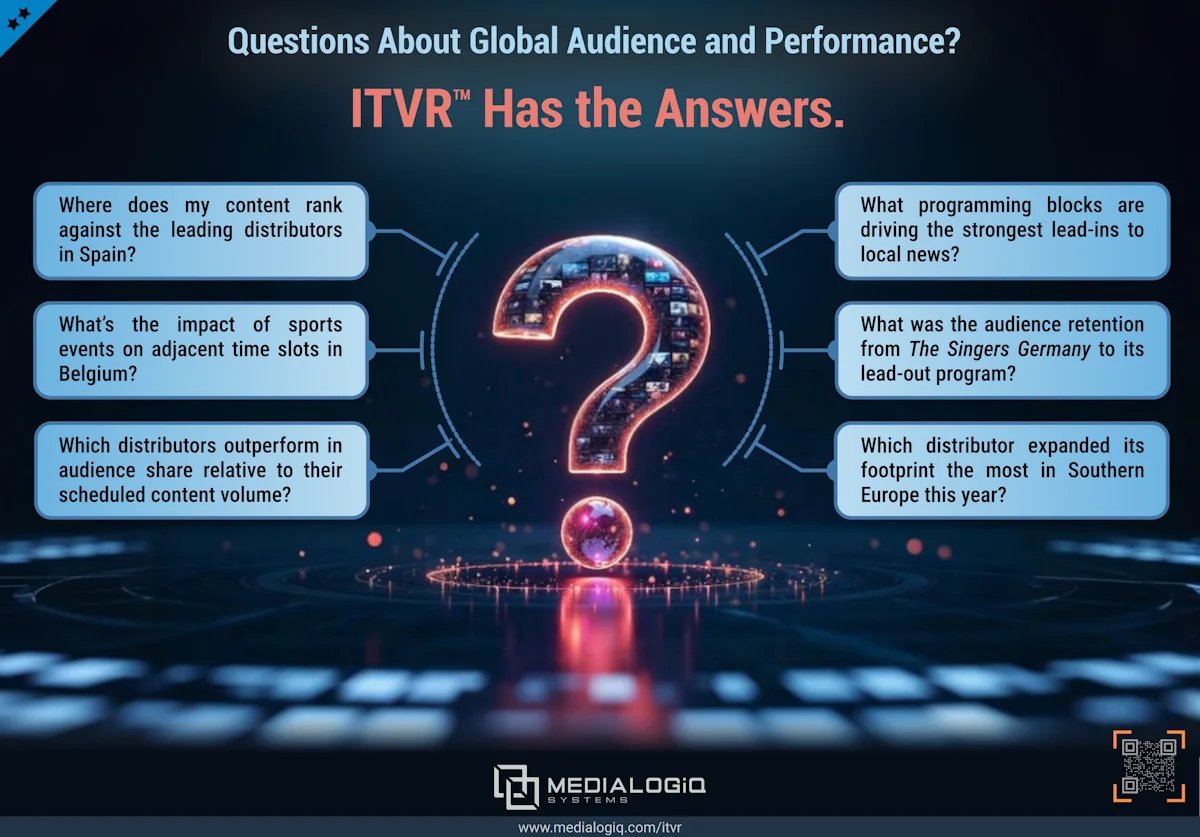
Questions About Global Audience and Performance? ITVR Has the Answers
(Part 2)
When it comes to understanding how content performs across diverse global markets, broadcasters and media executives need more than just raw numbers. They need clarity, context and comparability. That’s where #ITVR, the international TV ratings platform from MediaLogiq Systems, keeps media leaders ahead of the curve.
In this second part of our spotlight series, we highlight just a few of the many types of questions that #ITVR helps answer every day. Whether you are part of a production company, a distribution team, a network or a research department, these examples reflect the kind of real-world decisions #ITVR supports across markets and content strategies.
Here are some sample questions that #ITVR addresses:
▪ Where does my content rank against the leading distributors in Spain?
▪ What’s the impact of sports events on adjacent time slots in Belgium?
▪ Which distributors outperform in audience share relative to their scheduled content volume?
▪ What programming blocks are driving the strongest lead-ins to local news?
▪ What was the audience retention from The Singers Germany to its lead-out program?
▪ Which distributor expanded its footprint the most in Southern Europe this year?
#ITVR makes it easy to translate complex audience questions into clear answers that drive smarter decisions across content and markets.
Learn more on our website (medialogiq.com/itvr) or contact us at info@medialogiq.com to request further information.
#TVAnalytics #whatpeoplewatch #audiences #viewers #TelevisionAudienceMeasurement #TAM #AudienceReporting #AudienceAnalytics #AudienceAnalysis #TVRatings #LinearAudienceSubscriptions #TVChannelRankings #TelecastPerformance #LeadInAnalysis #LeadOutAnalysis #ContentPerformance #entertainment #media #content #film #movies #tv #tvseries #tvprogram
2
4
31
29 Jul 2025
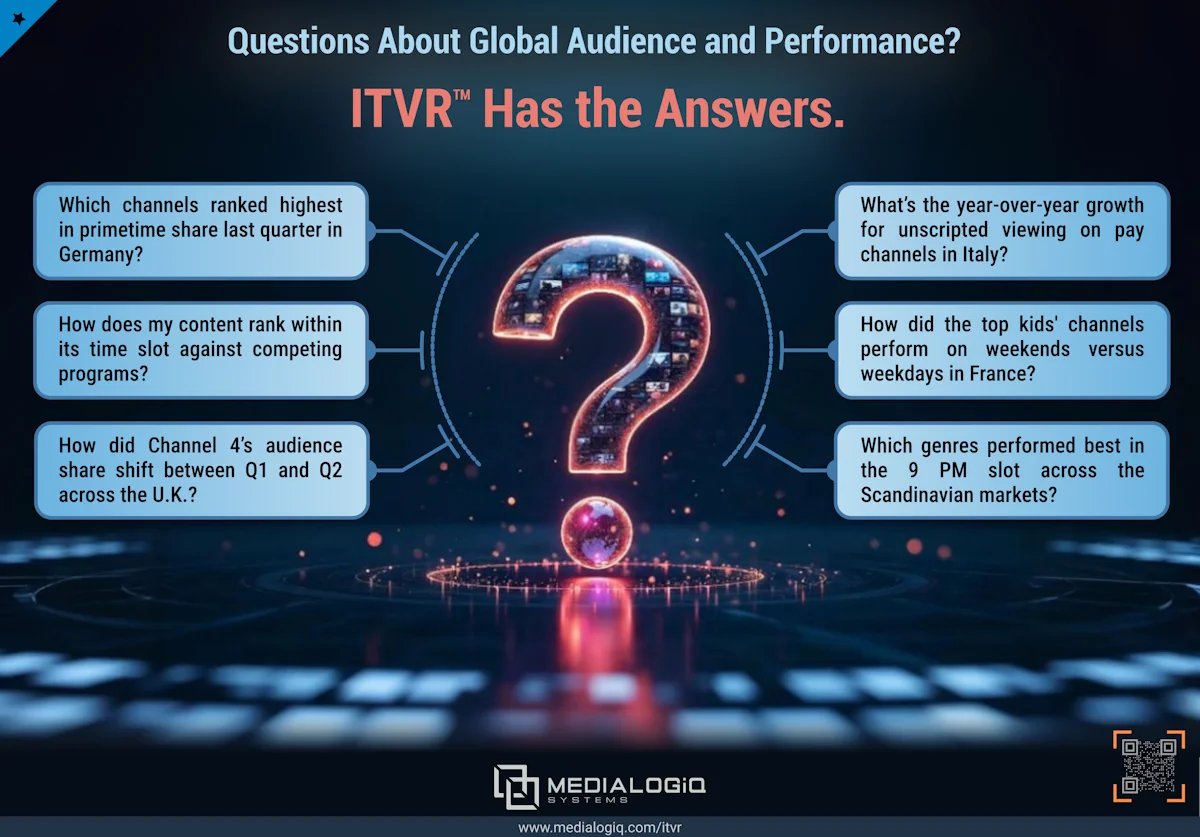
Questions About Global Audience and Performance?
ITVR Has the Answers
(Part 1)
Imagine a platform engineered for the complexities of global television, one that effortlessly transforms fragmented audience data from over 80 markets into sharp strategic insight in seconds. That’s #ITVR by MediaLogiq Systems, where intelligence, scale and speed converge to redefine audience measurement and performance reporting.
With #ITVR’s Audience and Performance Reporting, media professionals can quickly analyze:
🗹 Market and channel rankings
🗹 Time period comparisons (e.g., Q1 vs Q2, YoY)
🗹 Lead-in and lead-out effects
🗹 Distributor volume and viewing behavior
🗹 Individual telecast performance
So when you are asking critical questions about audience dynamics, market share or competitive performance, #ITVR doesn’t just help — it delivers. Questions like:
▪Which channels ranked highest in primetime share last quarter in Germany?
▪How does my content rank within its time slot against competing programs?
▪How did Channel 4’s audience share shift between Q1 and Q2 across the U.K.?
▪What’s the year-over-year growth for unscripted viewing on pay channels in Italy?
▪How did the top kids’ channels perform on weekends versus weekdays in France?
▪Which genres performed best in the 9 PM slot across the Scandinavian markets?
#ITVR turns questions into answers and data into strategy.
Learn more on our website (medialogiq.com/itvr) or contact us at info@medialogiq.com to request further information.
#TVAnalytics #whatpeoplewatch #audiences #viewers #TelevisionAudienceMeasurement #TAM
#AudienceReporting #AudienceAnalytics #AudienceAnalysis #TVRatings #LinearAudienceSubscriptions #TVChannelRankings
#TelecastPerformance #LeadInAnalysis #LeadOutAnalysis #ContentPerformance #entertainment #media #content #film #movies #tv #tvseries #tvprogram
2
4
34

10 Jul 2025
🧠 𝐂𝐎𝐍𝐓𝐄𝐍𝐓 𝐌𝐀𝐑𝐊𝐄𝐓𝐈𝐍𝐆 𝐒𝐄𝐑𝐕𝐈𝐂𝐄𝐒 – 𝐁𝐄 𝐓𝐇𝐄 𝐁𝐑𝐀𝐍𝐃 𝐓𝐇𝐄𝐘 𝐑𝐄𝐌𝐄𝐌𝐁𝐄𝐑.
In a world flooded with noise, content is your signal. Not just any content—𝐬𝐭𝐫𝐚𝐭𝐞𝐠𝐢𝐜, 𝐬𝐭𝐨𝐫𝐲-𝐝𝐫𝐢𝐯𝐞𝐧, 𝐬𝐞𝐚𝐫𝐜𝐡-𝐨𝐩𝐭𝐢𝐦𝐢𝐳𝐞𝐝 𝐜𝐨𝐧𝐭𝐞𝐧𝐭 that educates, engages, and converts. At 𝐏𝐂 𝐃𝐨𝐜𝐭𝐨𝐫𝐬 𝐍𝐄𝐓, we don’t just write—we engineer narratives that build trust and drive action.
📌 𝐖𝐡𝐲 𝐂𝐨𝐧𝐭𝐞𝐧𝐭 𝐌𝐚𝐫𝐤𝐞𝐭𝐢𝐧𝐠 𝐒𝐭𝐢𝐥𝐥 𝐖𝐢𝐧𝐬 𝐢𝐧 𝟐𝟎𝟐𝟓
- 🎯 𝐈𝐭’𝐬 𝐭𝐡𝐞 𝐟𝐨𝐮𝐧𝐝𝐚𝐭𝐢𝐨𝐧 𝐨𝐟 𝐒𝐄𝐎—Google loves fresh, relevant, authoritative content.
- 🧠 𝐈𝐭 𝐛𝐮𝐢𝐥𝐝𝐬 𝐭𝐡𝐨𝐮𝐠𝐡𝐭 𝐥𝐞𝐚𝐝𝐞𝐫𝐬𝐡𝐢𝐩—position your brand as the expert, not just a vendor.
- 💬 𝐈𝐭 𝐟𝐮𝐞𝐥𝐬 𝐞𝐯𝐞𝐫𝐲 𝐜𝐡𝐚𝐧𝐧𝐞𝐥—email, social, ads, SEO, video… all powered by great content.
- 🤝 𝐈𝐭 𝐧𝐮𝐫𝐭𝐮𝐫𝐞𝐬 𝐥𝐞𝐚𝐝𝐬—from awareness to decision, content guides the journey.
- 📈 𝐈𝐭 𝐜𝐨𝐦𝐩𝐨𝐮𝐧𝐝𝐬 𝐨𝐯𝐞𝐫 𝐭𝐢𝐦𝐞—one blog today can drive traffic for years.
🚀 𝐖𝐡𝐲 𝐏𝐂 𝐃𝐨𝐜𝐭𝐨𝐫𝐬 𝐍𝐄𝐓 𝐃𝐨𝐞𝐬 𝐈𝐭 𝐁𝐞𝐭𝐭𝐞𝐫
- ✍️ 𝐂𝐮𝐬𝐭𝐨𝐦 𝐂𝐨𝐧𝐭𝐞𝐧𝐭 𝐒𝐭𝐫𝐚𝐭𝐞𝐠𝐲—tailored to your audience, goals, and platforms.
- 🔍 𝐒𝐄𝐎-𝐃𝐫𝐢𝐯𝐞𝐧 𝐂𝐫𝐞𝐚𝐭𝐢𝐨𝐧—we write for humans and algorithms.
- 🎨 𝐌𝐮𝐥𝐭𝐢-𝐟𝐨𝐫𝐦𝐚𝐭 𝐄𝐱𝐩𝐞𝐫𝐭𝐢𝐬𝐞—blogs, infographics, videos, whitepapers, social posts.
- 📊 𝐏𝐞𝐫𝐟𝐨𝐫𝐦𝐚𝐧𝐜𝐞 𝐓𝐫𝐚𝐜𝐤𝐢𝐧𝐠—we measure what matters and optimize relentlessly.
- 🛠️ 𝐑𝐞𝐩𝐮𝐫𝐩𝐨𝐬𝐢𝐧𝐠 & 𝐃𝐢𝐬𝐭𝐫𝐢𝐛𝐮𝐭𝐢𝐨𝐧—we squeeze every drop of value from your content.
- 🕒 𝟐𝟒/𝟕 𝐒𝐮𝐩𝐩𝐨𝐫𝐭 & 𝐈𝐭𝐞𝐫𝐚𝐭𝐢𝐨𝐧—we evolve with your brand, not just deliver and disappear.
📌 𝐈𝐟 𝐲𝐨𝐮𝐫 𝐜𝐨𝐧𝐭𝐞𝐧𝐭 𝐢𝐬𝐧’𝐭 𝐜𝐨𝐧𝐯𝐞𝐫𝐭𝐢𝐧𝐠, 𝐢𝐭’𝐬 𝐣𝐮𝐬𝐭 𝐝𝐞𝐜𝐨𝐫𝐚𝐭𝐢𝐨𝐧.
Let’s turn your words into revenue.
🌐 pcdoctorsnet.com
📞 1 (346) 355-6002
#ContentMarketing #DigitalStrategy #MarketingThatWorks #SEOContent #ContentCreation #ThoughtLeadership #ContentThatConverts #MarketingTips #InboundMarketing #ContentIsKing #BrandStorytelling #ContentStrategy #ContentPerformance #DigitalFuture #MaximumVisibility #StrategicBranding #texas #usa #UnitedStates #pcdoctorsnet #canada #india

ALT PC Doctors NET offers strategic Content Marketing Services designed to drive traffic, build authority, and convert leads. From SEO-optimized blogs and infographics to video scripts and email campaigns, we craft content that performs across platforms. Visit pcdoctorsnet.com or call 1 (346) 355-6002 to fuel your brand with content that works.
1
2
8
Metadata isn’t a checkbox — it’s a growth channel.
Backed by GL’s global editorial and SEO experts, we optimize for:
🔍 Search engine rankings
🖱️ UI engagement
📊 Platform-specific performance
#GLSEO #TVSEO #ContentPerformance #BroadcastResults #StreamingDiscovery

2
2
45

10 Jun 2025
Although GenAI makes creating creative content easier than ever, how well does such content perform? Find outn this MSI webinar held at noon on June 24, with David Schweidel of @EmoryUniversity: ow.ly/plpK50W50Lb #GenAI #LLMs #ContentPerformance

2
108

15 May 2025
❌ Inconsistent brand voice across platforms
A consultant creates a roadmap that links every piece of content to a clear objective.
#MarketingAudit #BrandStrategy #ContentPerformance
1
2
11

Are you tracking the performance of your content? 📝
Find out the key metrics to track, how to monitor them and what they mean for your content marketing strategy in our blog ⤵️
shorturl.at/w44Me
#contentmarketing #seoagency #contentperformance

2
4
134

8 Aug 2024
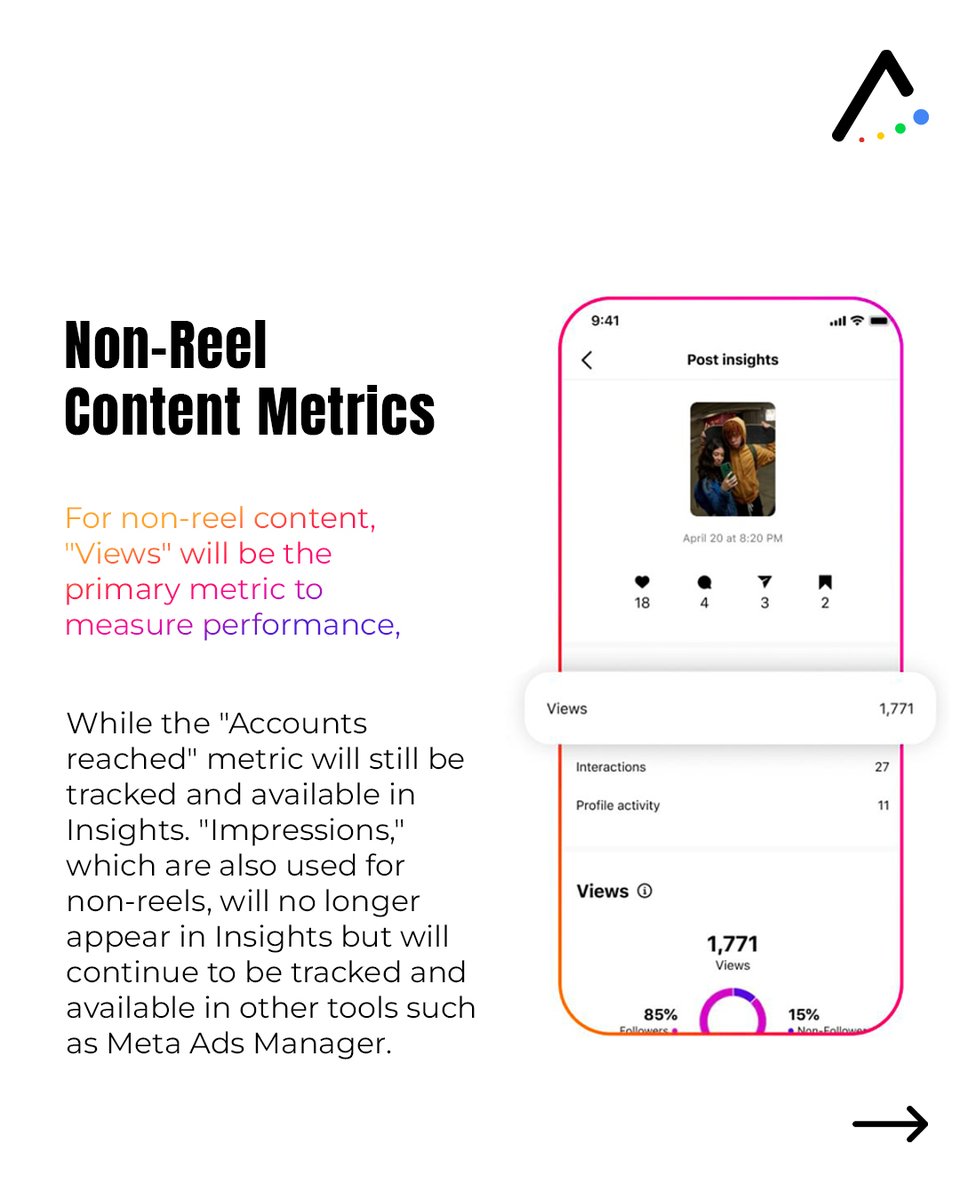
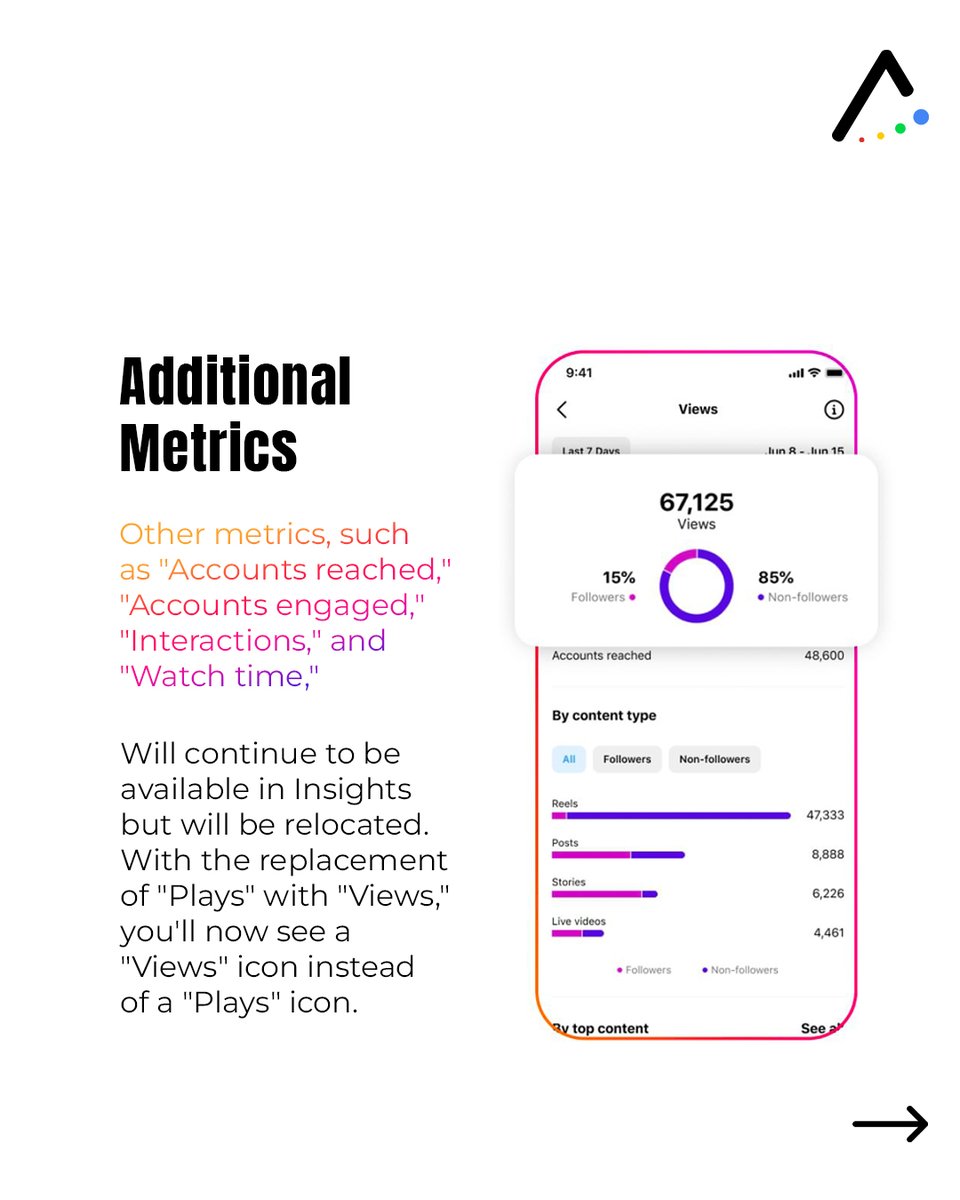
Latest Update: Instagram Insights now use "Views" as the primary metric for all content types! 📊 Ensure consistent and clear performance tracking. Stay tuned!
@instagram @mosseri
#AlgorithmX #InstagramUpdates #NewMetrics #ContentPerformance


2
63

9 Feb 2024
📊 7 Proven Ways to Measure Your Blog’s Content Performance
#SEO #ContentMarketing #Blogging #InternetMarketing #OnlineMarketing #ContentPerformance #ContentSEO #blogMarketing amberddesign.com/7-ways-to-m…
1
18
25 Dec 2023
📊 7 Proven Ways to Measure Your Blog’s Content Performance buff.ly/2EoarFJ
#SEO #ContentMarketing #Blogging #InternetMarketing #OnlineMarketing #ContentPerformance #ContentSEO #blogMarketing
10

30 Nov 2023
Discover the transformative journey of a global technology and services company that turned to Quark to overcome challenges.
Dive into this case study: bit.ly/47yIZn3
#QuarkDocurated #ContentIntelligence #SalesEnablement #DocumentSimplification #ContentPerformance

1
2
18

29 May 2023
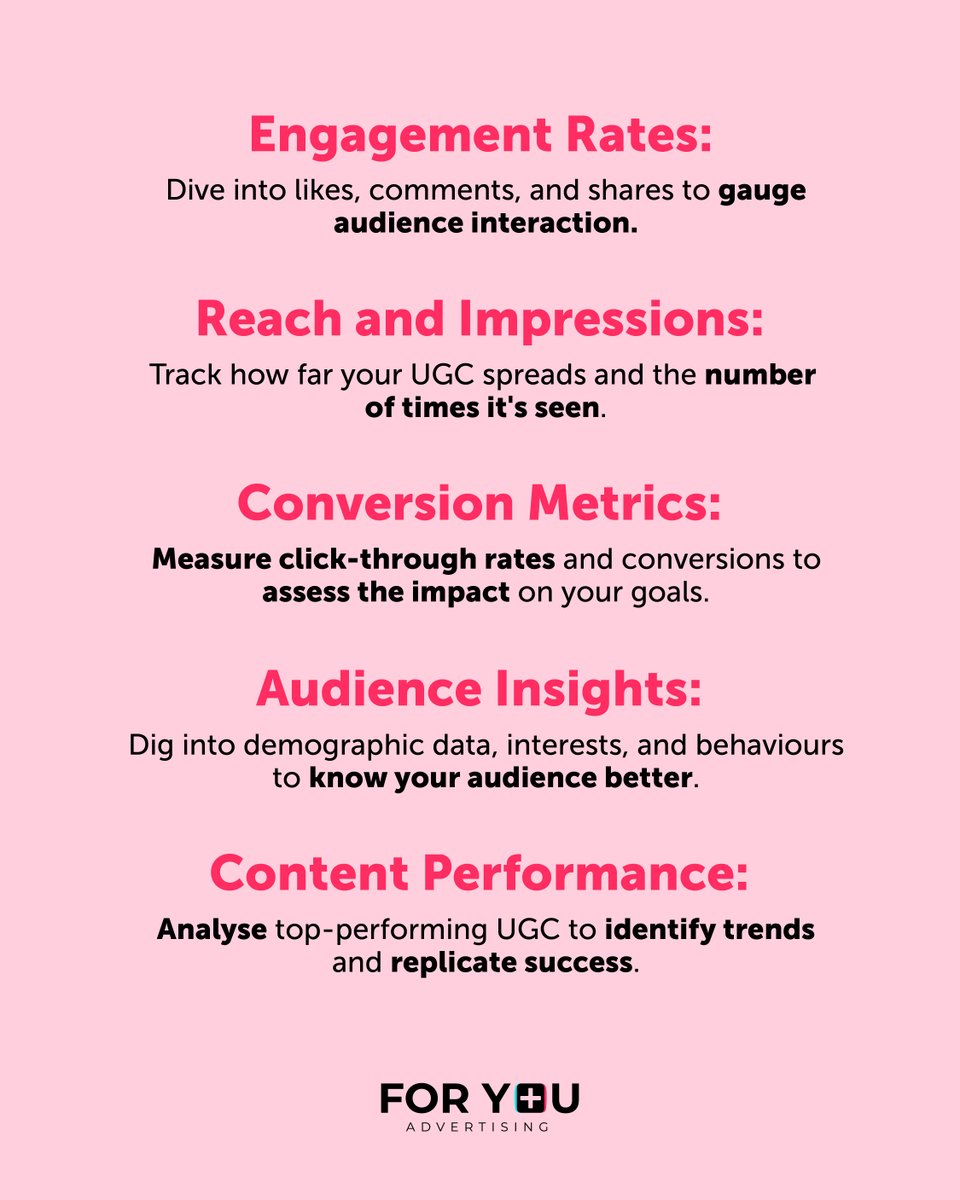
📊 UGC Metrics 101: Understanding Your Performance 📈
Dive into the world of UGC analytics and discover how to measure the success of your content. Stay tuned for more tips to level up your metrics game!
#UGCmetrics #DataDrivenInsights #ContentPerformance #UGCcommunity

2
218