
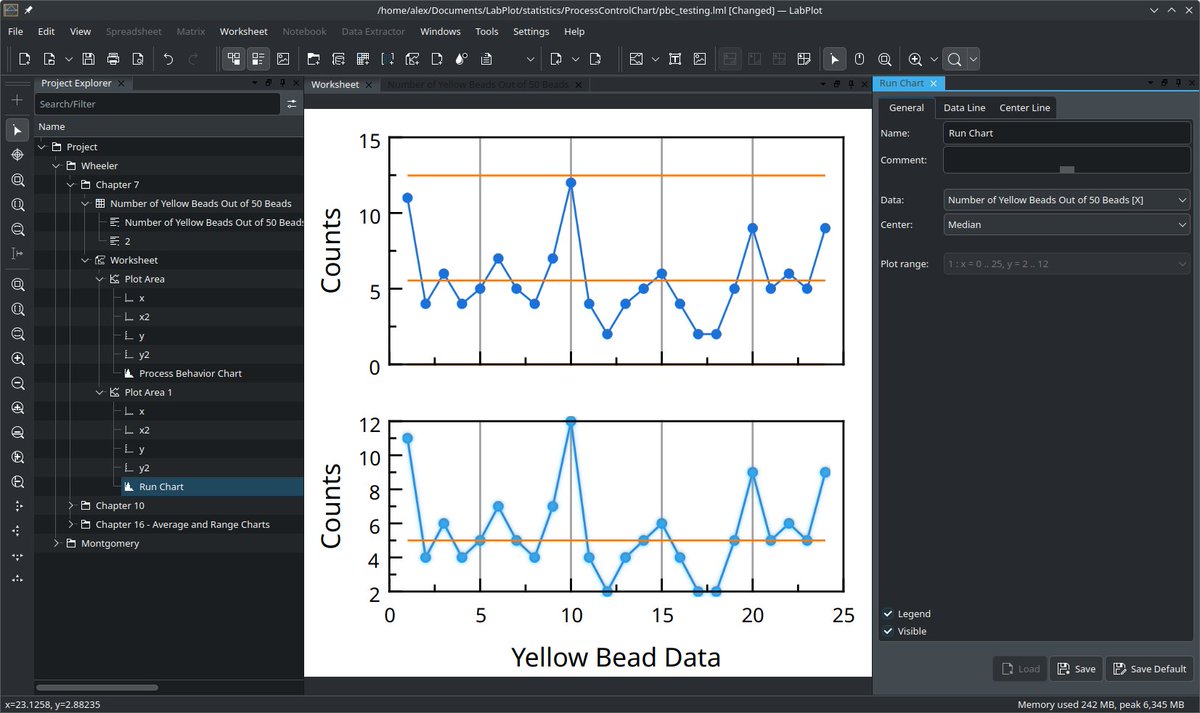
A new feature has been recently merged into the dev branch of #LabPlot - the new visualization: Run Chart.
The comparison between a Process Behavior Chart (XMR) and a Run Chart:
#DataAnalysis #Statistics #Quality #ControlChart #OpenSource #Business #FreeSoftware #Deming #Lean
1
5
225
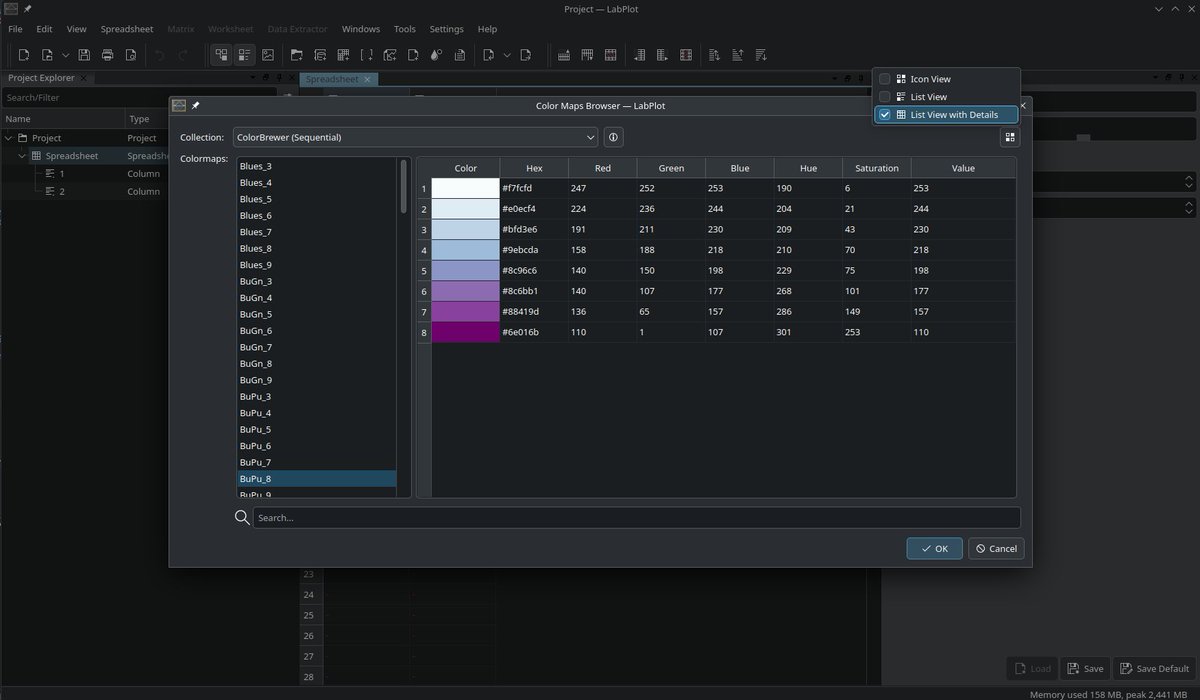
Another great feature has been added to the dev branch: Info view mode in the Color Maps Browser.
#DataAnalysis #DataViz #Research #Science #Statistics #Quality #SPC #ControlChart #FLOSS #FOSS #OpenSource #Business #FreeSoftware #Researchers #Professionals #Technology
2
2
6
304
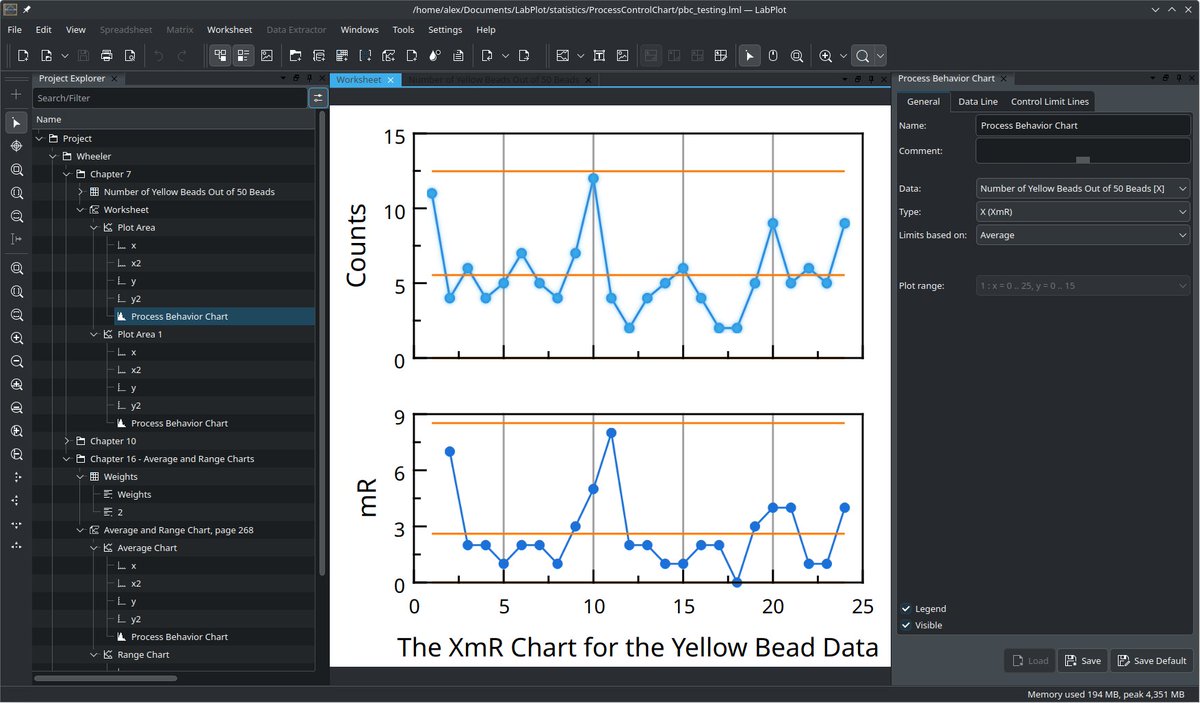
A new feature has been recently merged into the dev branch: Process Behavior Charts (Control Charts of #Shewhart Charts).
#DataAnalysis #Research #Science #Statistics #Quality #SPC #ControlChart #FLOSS #FOSS #OpenSource #Business #FreeSoftware #Researchers #Technology #XmR
1
2
8
256

27 Apr 2023
Control limits in #SPC charts are extremely useful for many reasons. They can help you to detect signals and help you to understand if the process is stable (predictable) or of out of control (unpredictable).
Learn more: hubs.ly/Q01MTK110
#QI #ControlLimits #ControlChart
1
506


10 Oct 2022
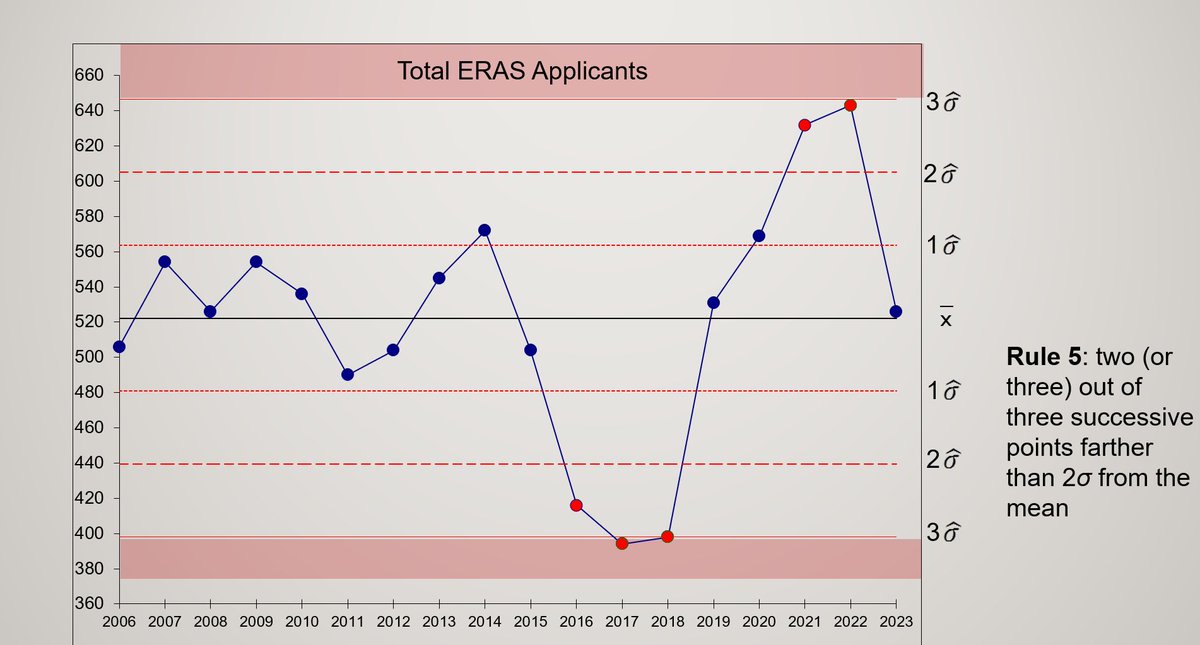
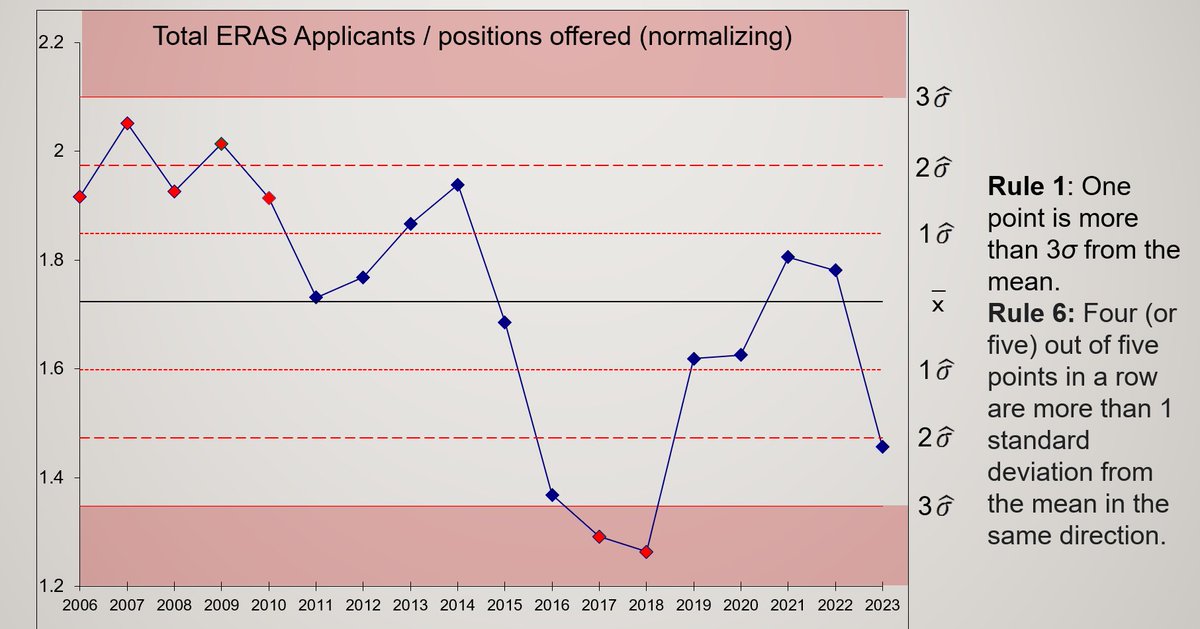
#OtoMatch over the years 2006-2023. If you look at raw ERAS numbers it looks like a whipsaw. If you normalize by looking at ratio of applications per position, the story shows a decreasing trend in applicants. #Controlchart
@futureENTres #ENTwitter #MedStudentTwitter
3
21

12 Apr 2022
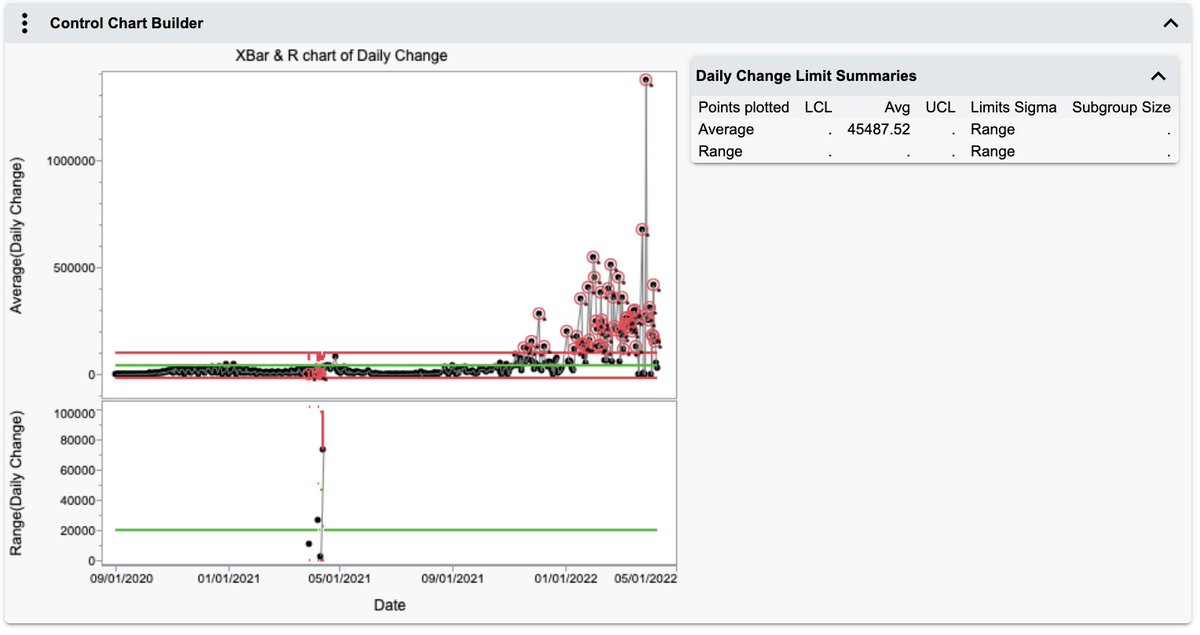
This control chart shows the daily change in reported cases of Covid-19 for Germany. bit.ly/3rigSFC
#ControlChart #JMP
1
1

11 Nov 2021
Do you want to take the regional train or the high-speed train in creating your control chart? bit.ly/3C0B81a
#ControlChart #JMP

ALT woman gazing at train tracks
1
1

13 Aug 2021
controlmg.com/2021/08/12/up-… - We are currently in the lead toping the Control Charts, help us secure the lead secure the victory. Vote Issues by Sui #LUKEWARM #controlmagazine #controlchart

3
1

20 Jul 2021
Control #Charts in #Excel
#ControlChart is the visual graph used to analyze the change of process over a period of time.
wallstreetmojo.com/control-c…
.
.
.
#Financefunctions #Excelfunctions #Excelfun #exceltips #exceltools #wallstreetmojo #basicexcel #advanceexcel #finance
2

15 Jun 2021
How to read a #Jira #ControlChart report?
I have introduced certain process changes, how do I know they are helping?
How to identify smells, and opportunities to improve the process?
Following are some quick tips (see thread)👇:
1
1
2
24 May 2021
A control chart is a good way to see changes in daily Covid-19 cases bit.ly/3fh0bov
#controlchart #dataviz #JMP
1
3
1 May 2021
Process control -- part of the set of reports a manufacturing engineer would look at bit.ly/3t80IN2
#controlchart #JMP #manufacturing
2

27 Oct 2020
The #analyst discussions and #plotthedots templates are great. Even better is the code sharing. Anyone have #Rcode or #SQLcode for #controlchart analysis of #NHS A&E performance and #COVID19 sitrep #data?
27 Oct 2020

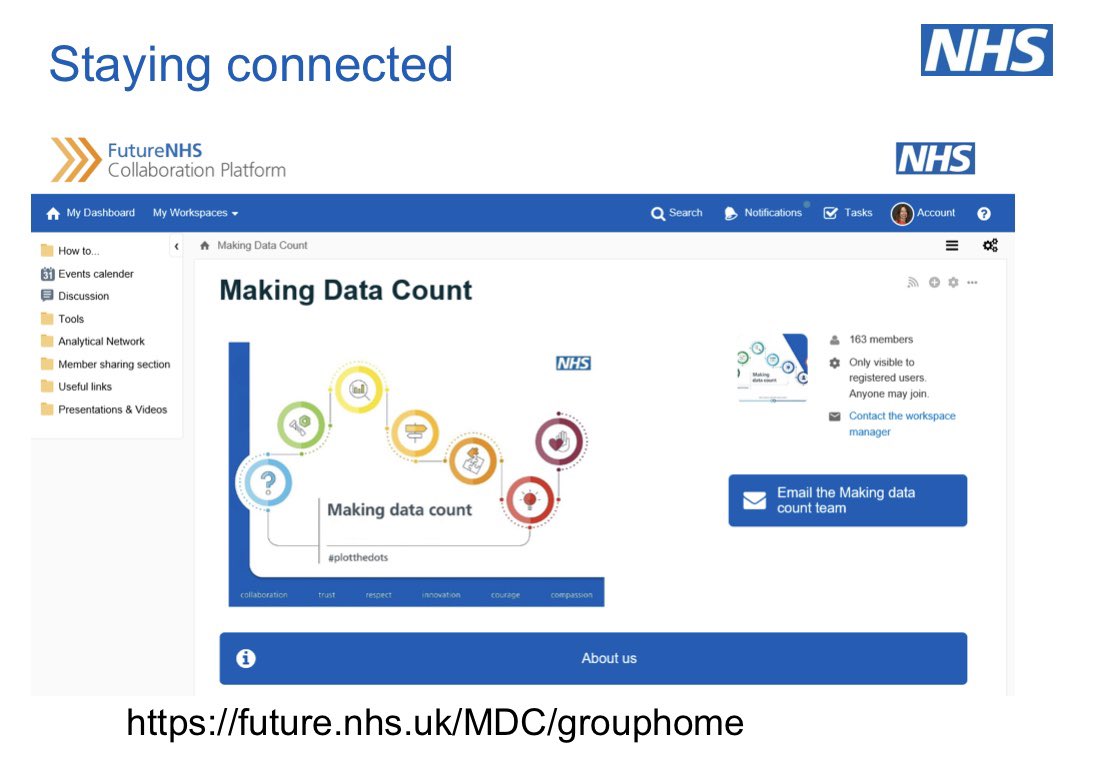
NEWS FLASH : Have you heard that Making Data Count has a new space for peeps to connect & access fun stuff? We will share all training materials, recordings of meetings & the calendar of up and coming events. Sign up and join our #plotthedots space! 🙌 future.nhs.uk/
1
1
4

13 Oct 2020
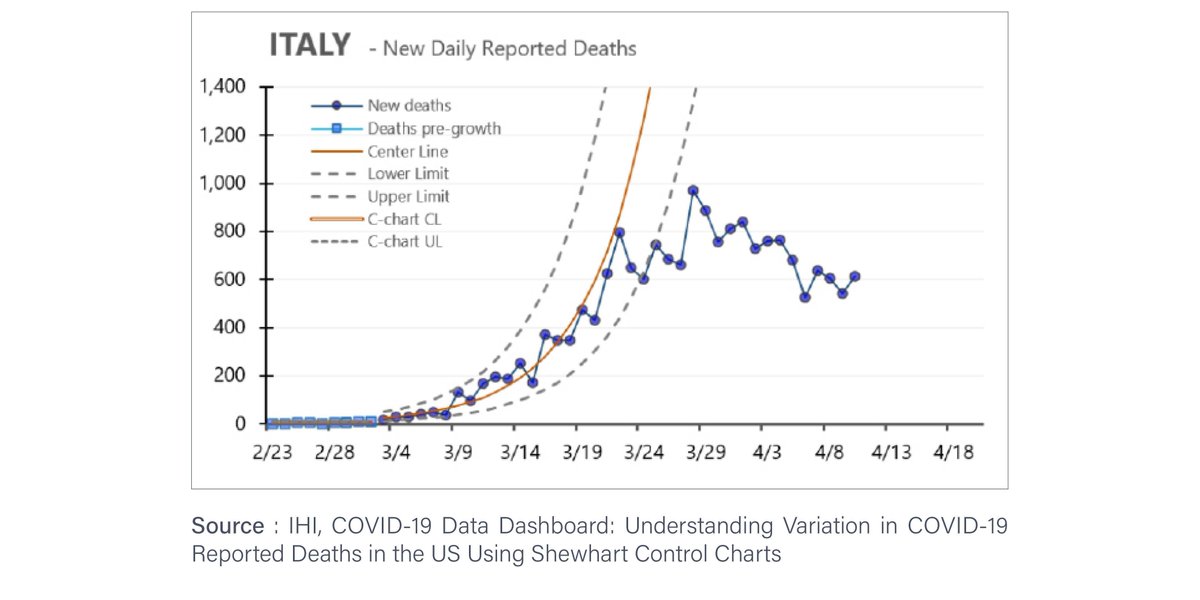
An improved approach to analyzing COVID-19 data.
From the International Journal for Quality in Health Care, "Understanding variation in reported covid-19deaths with a novel Shewhart chart application"
#shewhartchart #covid19 #controlchart #provost lnkd.in/gimmXJe
1
18 Aug 2020
Average Run Length is often used to measure the performance of control charts. Here's how to calculate it bit.ly/3iPitMz
#JMP #controlchart
1
6 Jul 2020
What if you could monitor and share a control chart of KPIs via the web, securely and privately? You can with JMP Live. See how it could look, on our public version of JMP Live bit.ly/2NTy804
#JMP #controlchart #quality
1
2

15 May 2020
Available on the iSixSigma Store! This Control Chart Wizard has a decision tree to help you figure out the type of data you have and how to build the right Control Chart, including all the formulas. isixsigma.com/store/control-… #controlchart #sixsigma #lean #formulas #shewhartchart
2

Connaissez-vous l'outil #ControlChart ? En cette période de #COVID19, il aide à l'analyse des variations quotidiennes du nombre de décès déclarés. Plus de détails sur buff.ly/3bMUkDn
#PatientSafety #Healthcare @TheIHI
1
2
