
May 27
Q1 FY27: Beat and raise across the board.
**The print**
- Revenue: $1.05B, 35% YoY (consensus ~$1.00B)
- Product revenue: $577M, 55% YoY
- Non-GAAP EPS: $0.47 vs $0.40 consensus
- Subscription ARR: $2.0B, 19% YoY
- RPO: $3.8B, 41% YoY
- Non-GAAP gross margin: 70.1% (above the 65-70% guide)
- Non-GAAP operating margin: 15.1% (vs 10.6% prior year)
- FCF: $112M
- Buybacks: $84M / 1.3M shares
**FY27 guide — raised**
- Revenue: $4.41B-$4.51B (was $4.3B-$4.4B)
- Growth: 20-23% (was 17-20%)
- Non-GAAP op income: $820M-$860M (was $780M-$820M)
- Op income growth: 29-36% (was 23-29%)
**Q2 guide**
- Revenue: $1.095B-$1.105B, 27-28% YoY
- Non-GAAP op income: $195M-$205M, 50-58% YoY
Product revenue 55% YoY and RPO 41% are the real signals. Backlog is building faster than recognized revenue — demand is outrunning supply.
**What to listen for on the call:**
1. Hyperscaler mix — explicit revenue contribution, not just generic language
2. Meta deal economics — DirectFlash licensing structure and ramp cadence
3. Second hyperscaler — pipeline color, qualification status, timing
4. Gross margin trajectory — 70.1% with rising hyperscaler mix is the bull case
5. Subscription ARR mix — software attach and Evergreen//One velocity
6. 1touch.io integration — early traction on DSPM cross-sell
7. Supply chain — NAND availability commentary into back half
Webcast 5pm ET.
May 27

Everpure $P earnings call in 1hr. Will post a link.
2
215

$P reports tonight
This name has lagged behind other AI semi and storage leaders all year SNDK/MU/WDC/STX etc.
The AI semi and storage leaders have cleaner scarcity signal because the market can see pricing power, sold-out capacity, exabyte growth, ASP/GB pressure, interconnect demand,
or gross margin expansion. Those stories are easier to underwrite.
$P is trying to move the market's frame from "flash storage vendor" -> "AI-era enterprise data control plane." Agents need more than GPUs. They need governed context, fast retrieval, writeback, and durable workflow memory. That
is the lane Everpure is trying to claim through Enterprise Data Cloud,and hyperscaler direct
flash.
So why no bid?
Well the same NAND tightness that makes SNDK a scarcity winner can be a margin headwind for P until Everpure proves pricing power, hyperscaler mix, or consumption economics can absorb the cost pressure.
Think of it this way
SNDK is the flour supplier in a flour shortage. P is the bakery. The same shortage that lets the flour supplier raise prices can hurt the bakery until it proves it can charge more for the cake, and/or use its brand and service model to protect margins.
What is holding the market back?
* Hyperscaler revenue is still not broken out cleanly.
* The ramp is back-half weighted, with management pointing to Q3/Q4 FY27.
* FlashBlade//EXA has proof, but still needs broader customer conversion.
* NAND and component inflation can pressure product gross margins before the AI/hyperscaler mix helps. (flour and bakery)
* Valuation already gives the company some credit, so vague AI language will not be enough.
The biggest AI spenders do have in-house infrastructure teams. They can source NAND, design storage services, and operate at a scale most enterprises cannot. That means $P cannot win hyperscalers by being a managed storage vendor. It has to win because its
DirectFlash and software architecture solve a specific performance, power, durability, density, or total cost problem that even a hyperscaler would rather license, than rebuild.
For normal enterprises, the pitch is different. Most enterprises are not buyingraw NAND and building a storage platform around it. They want uptime, support, snapshots, governance, performance,and lifecycle management. That is why they buy a platform instead of
going directly to SNDK.
Company guide:
* Q1 FY27 revenue: $990M-$1.01B.
* Q1 non-GAAP operating income: $125M-$135M.
* FY27 revenue: $4.3B-$4.4B.
* FY27 non-GAAP operating income: $780M-$820M.
Tonight customer proof is what im looking for. (hurdle)
* Revenue should be above $1.01B, not merely in range.
* Operating income should be above $135M, or the margin bridge needs to be
strong.
* FY27 revenue guide should be held with confidence or raised.
* RPO needs to stay materially above revenue growth. A hard deceleration from
prior 40% would hurt the thesis.
* Hyperscaler commentary must become more concrete; shipments, revenue timing,
customer breadth, design wins, and workload scope.
* Product gross margin pressure needs to stay contained, with a credible
recovery path.
Bull Case: Re-Rate Begins
The company beats the top end of guide, keeps or raises FY27, RPO stays strong,
and management gives real hyperscaler/EXA detail. The call makes the market
feel that Everpure is becoming the agentic enterprise memory layer, not just a
storage vendor.
Base Case: Story Is Real, Trade Needs Time
The print is good, but the guide is mostly reiterated. Management sounds
confident, but hyperscaler detail remains partly qualitative and back-half
weighted. RPO is fine but not explosive.
i rather avg up after the print than leverage up before.

Earnings may 27th I'll try to post something before the print, and post it here.
$P
1
14
3,421

May 25
$P is not the only doing this. It’s just that they’re really good at it.
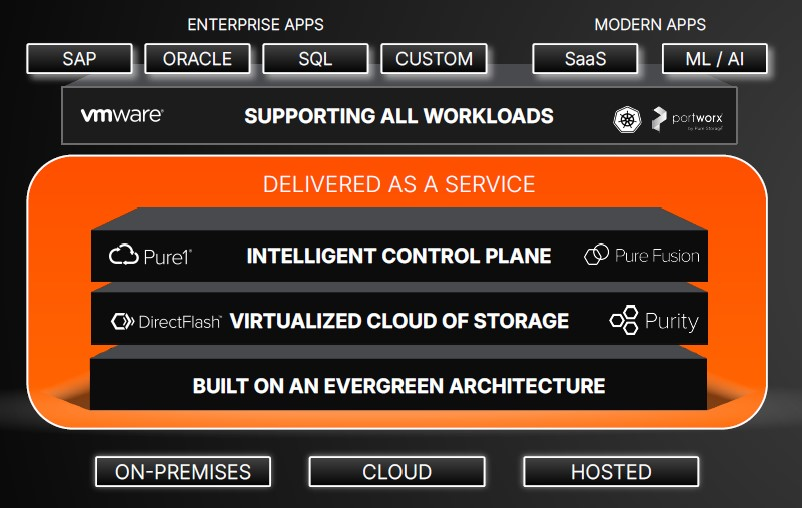
There are several vendors that integrate software deeply with hardware for storage. But $P excels in the enterprise all-flash segment.
Its moat stems from its Purity OS DirectFlash (custom flash management for superior efficiency, latency, and density) and the Evergreen architecture (non-disruptive, subscription-based upgrades with zero downtime). They create high switching costs, recurring revenue, and strong customer stickiness.
$P delivers better TCO and simplicity versus fragmented competitors, though it faces pressure from larger rivals and scale-out specialists.
1
1
756
May 18
$P and $META have collaborated since 2017 to help design $META’s initial AI infrastructure. Since then, $META has continued to deepen the relationship by using $P’s FlashArray and FlashBlade systems for scalable storage to support $META’s AI workloads.
More recently, $P has been providing $META with DirectFlash and architectural software solutions via its Purity platform.
With various bottlenecks surfacing in the AI race, $P creates value by:
- Reducing energy consumption by 85% or more compared to competitors. $P’s DirectFlash solution bypasses traditional SSD layers for lower latency and power at scale. This makes $P’s solution ideal for AI (training pipelines, inference).
- Removing the need for frequent hardware/software upgrades across multiple generations of SSD renewal. SSDs degrade and need replacement over time. Physical replacement is not tough; it is the downtime during replacements/swaps and the process of securing replacements that makes it cumbersome and costly. Moreover, data security is an issue. SSD controllers cannot be easily demagnetized like hard drives, so failing drives containing sensitive AI model data or user data must be physically shredded or cryptographically erased (via block-level cryptographic erasure) before disposal to comply with security standards.
$P makes storage reliable and non-disruptive for the customer. In turn, this creates customer loyalty and predictable costs.
1
1
3
146

May 11
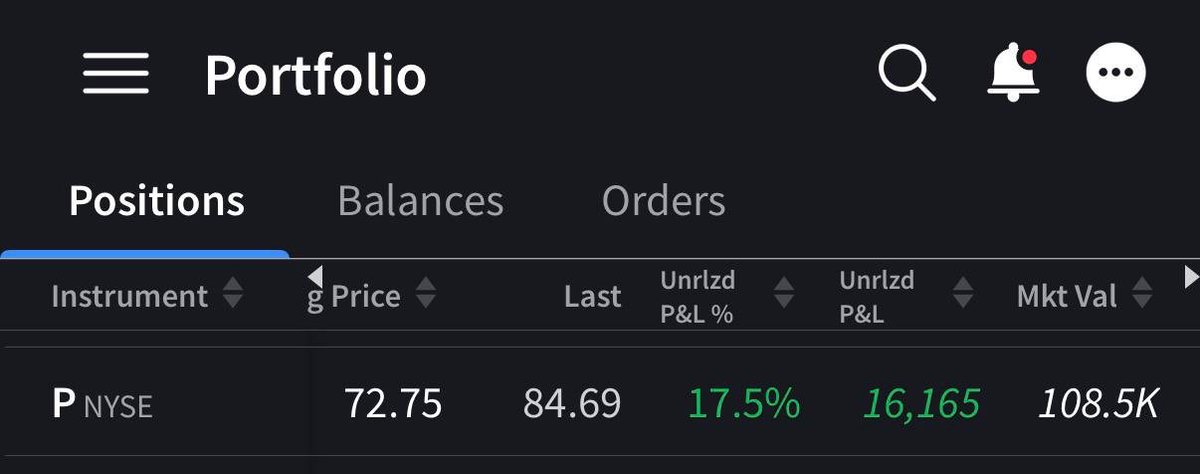
Entered Everpure at an average price of $72, now up 17.5% and crossed $100k.
My $P thesis is fairly simple.
As AI workloads continue scaling, the demand for faster, denser, and more power efficient storage infrastructure is growing rapidly. I think Pure Storage is one of the better positioned companies to benefit from that trend.
The company has been steadily taking share from older storage vendors by focusing entirely on all flash architecture instead of legacy hard drive systems. Their DirectFlash technology gives them advantages in density, efficiency, performance, and physical footprint, which becomes increasingly important for hyperscalers and AI data centers.
What also stands out is the financial profile. Revenue growth has been accelerating, earnings are growing much faster than revenue, gross margins remain strong around 70%, and the balance sheet carries significant net cash with no debt.
Compared to many AI infrastructure names, the market still does not fully price Pure Storage as a direct AI beneficiary.
Valuation is not necessarily cheap, so position sizing matters. But I think the long term setup remains attractive as AI infrastructure spending continues expanding.
$NTAP
$DELL
$HPE
$IBM
$WDC
$STX
$NTNX
$VRT
$SMCI
$ANET
1
5
2,108

May 11
$P
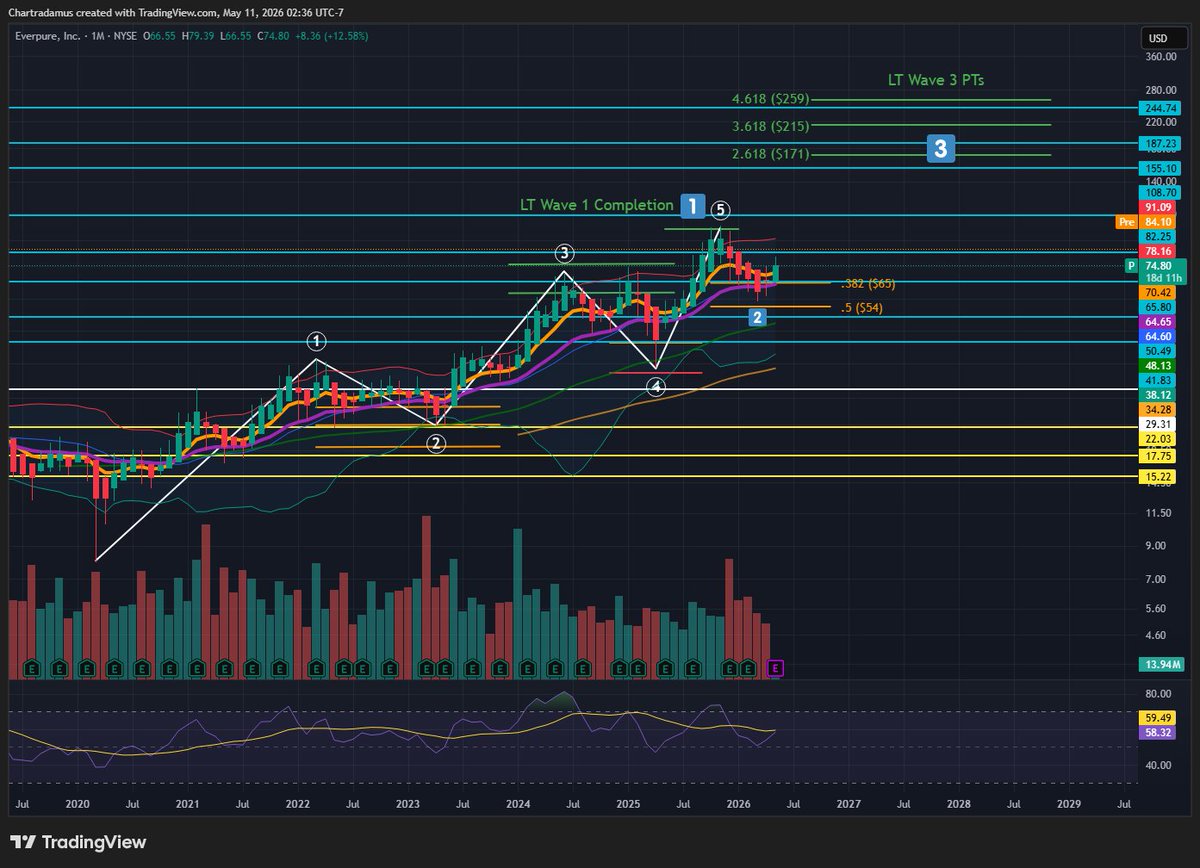
LT Wave 3 PT = $171 🟢 Base Case
A bit frustrated that a gap-up is building for this one overnight considering I wanted to stake an entry this week! Perhaps it gets crushed intraday back down to Earth as sellers do still sit above. Would love to enter a starter between $75-$80.
Everpure, previously known as Pure Storage and trading under the ticker $PSTG, is a data storage management platform company. $P makes all-flash storage systems that are becoming increasingly critical for data centers. AI training and inference clusters need extremely fast, power-efficient storage and Everpure's DirectFlash Purity OS do exactly that. They deliver data to GPUs faster and more reliably than traditional storage helping hyperscalers and enterprises save money.
Everpure has now broken into the hyperscaler market. They recently secured a major design win with one of the top hyperscalers, which is expected to ramp significantly in 2H 2026 and beyond. These deals can be very high-margin and open the door to exabyte-scale deployments. On top of that, their core enterprise business continues to grow at a healthy 16-20% rate with a strong backlog.
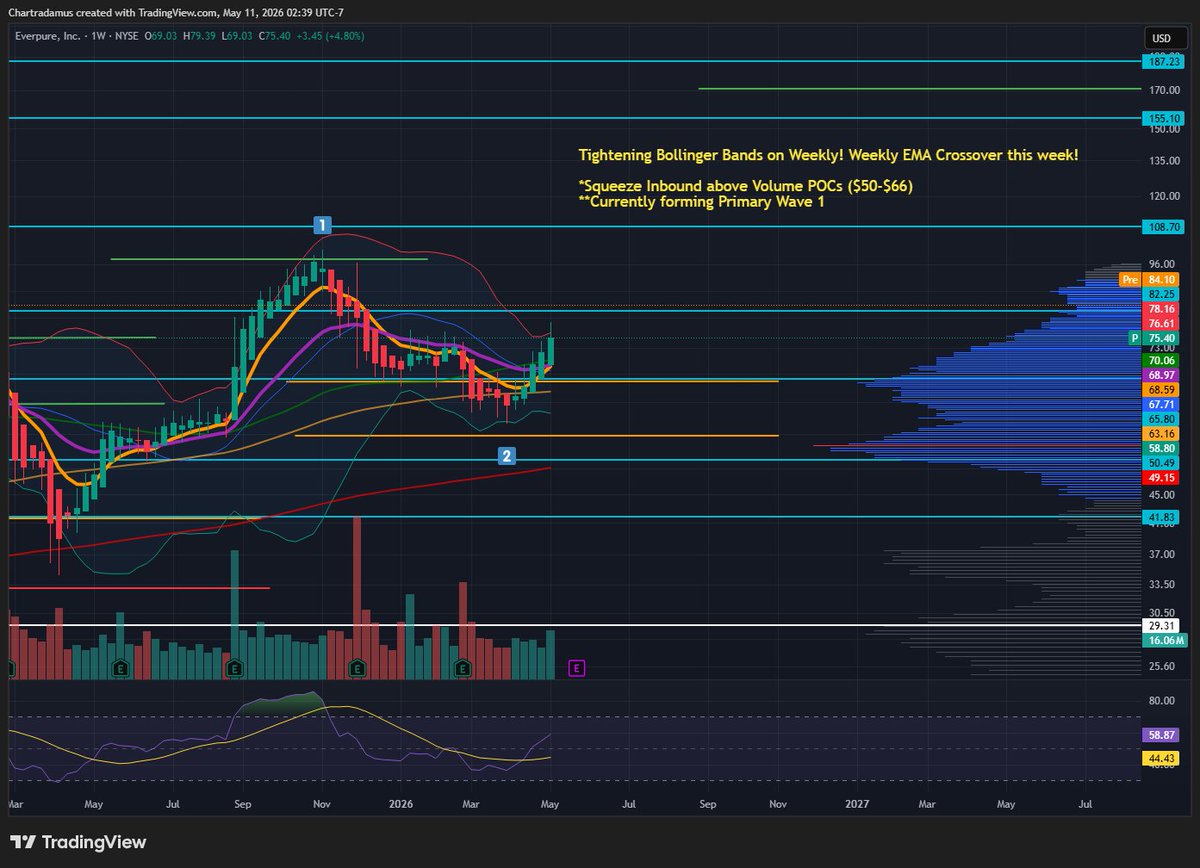
Technically, the stock has formed an extremely clean and patient move higher since 2020 in the form of Primary Waves to complete LT Wave 1. In contrast, this led up to a relatively swift correction for LT Wave 2 since October. This downtrend has now been broken off the Weekly 100MA retest that shared confluence with backtesting the Volume POC. The stock has since found strong momentum, on track to complete a Weekly EMA Bullish Crossover this week and begin a Bollinger Band squeeze higher on the Weekly chart as well with very little overhead resistance.
This should lead to the comfortable onset of the LT Wave 3 move towards a PT of $171 long-term. This current move higher is Minor Wave 1 of Primary Wave 1 in the larger LT Wave 3. A strong start. Let's see how the waves shake out as we move forward.
4
1
17
2,267

May 9
$P Everpure: Strategic Transition to AI Data Infrastructure Platform, and Investment Thesis.
Everpure — formerly Pure Storage — has moved well beyond its origins as a flash storage vendor. The repositioning toward AI data infrastructure is backed by tangible results: FY26 revenue growth was strong, and a record RPO of $3.7 billion provides meaningful forward visibility. The backlog at that level is not a narrative artifact — it represents real contracted demand and suggests the platform transition is resonating with enterprise buyers.
The near-term pressure point is margins. Semiconductor component inflation has forced aggressive price increases, and gross margins are feeling it. That's a difficult dynamic to manage when the investment thesis depends on demonstrating durable, high-margin recurring revenue — the two things are working against each other in the short term, and how quickly the company can restore margin trajectory matters for how the stock gets valued.
The strategic architecture is coherent. DirectFlash technology provides a differentiated hardware foundation, and the Evergreen subscription model creates the kind of recurring revenue base that supports premium valuation multiples. The hyperscaler relationship with Meta is a meaningful proof point — those partnerships are hard to win and signal genuine platform credibility rather than just transactional hardware sales.
Management has earned credibility through successful scaling and consistent product innovation. That track record matters here because the execution requirements going forward are significant — sustaining hyperscaler relationships, navigating supply chain volatility, and converting the RPO into recognized revenue at acceptable margins all have to happen simultaneously.
The valuation premium is the constraint. There's limited tolerance for execution slippage when the stock is priced for a strong outcome. The thesis is sound and the competitive position is real, but the margin compression cycle needs to resolve visibly before the multiple is fully comfortable.

6
4
57
28,407


May 6
I just started a new position today.
Haven’t seen anyone giving this one much attention besides a random tweet that put it on my radar the other day.
Company is $P (Everpure).
I see this business being a HUGE beneficiary of the AI infrastructure buildout, and specifically memory optimization.
Everpure recently rebranded from Pure Storage which was founded in 2009 by John “Coz” Colgrove.
The game they play is memory efficiency, making standard memory drives used in data centers store up to 5x more data while using 50-80% less power. 🤯
A few things about the company:
• Unlike rivals who buy off-the-shelf SSDs, Everpure builds proprietary DirectFlash Modules (DFMs). By removing the "middleman" controller found in standard drives, their software speaks directly to raw memory, drastically reducing latency and increasing lifespan.
• Their Purity OS leads the industry in deduplication and compression. They can make 1TB of physical flash act like 5TB of usable space, allowing customers to expand capacity without buying new chips.
• Everpure provides higher throughput in a smaller physical footprint. This prevents "GPU Starvation," ensuring that expensive $NVDA chips are always fed data at maximum speed.
• Their "Evergreen" model is a unique subscription-based approach that allows customers to upgrade hardware components (controllers/flash) while the system is running. This ensures zero downtime for customers.
• They offer Software Defined Storage which allows them to license their "intelligence" (Purity OS) to run on any hyperscaler's custom-built hardware. This high-margin licensing model scales faster than physical hardware sales. $META has already signed on as a huge customer for this. 👀
• They don't own massive factories or data centers (CapEx light). Instead, they focus more on R&D that improves their products.
• Their systems use 50% to 80% less power than legacy storage. In an era where power grids are at capacity, this efficiency allows any GPU-as-a-Service provider to add more chips without needing to find more energy for storage.
• The company maintains a pristine balance sheet with zero debt and over $1.5 billion in cash.
• Their storage solutions are extremely reliable (99.999%) and they carry a Net Promoter Score (NPS) consistently above 80. Their customer loyalty is nearly five times higher than the industry average, creating a high-trust environment for mission-critical AI training.
In a world where memory AND energy are the bottleneck, memory storage optimization will become critical.
I’m honestly surprised this stock hasn’t pumped even more with recent gains we’ve seen in companies like $MU and $SNDK.
The only real bear case I could find for this stock is that a chunk of their business requires them to buy memory drives themselves which are currently experiencing price spikes.
This would normally eat into Everpure’s margins, but they’ve been increasing their own prices to compensate. Fortunately, this hasn’t seemed to affect customer demand.
Very bullish on this name now that I’ve come across it.
I sold 100 shares of $RKLB and rotated most of the money into this new position.
Still only 1.5% of my portfolio for now.
Please do your own research on this name and don’t consider this post financial advice!

35
28
328
70,111
May 3
Everpure $P : The secretly sexy sleeper AI infrastructure play
Everpure has moved to my second largest position and conviction continues to build with every layer of due diligence. The setup here is rare. A mid-cap company sitting at the precise structural chokepoint of AI infrastructure, with a 15-year technology moat, expanding institutional accumulation, minimal retail awareness, and a stock that has not yet had its repricing moment despite the fundamentals supporting one. This is the kind of asymmetry that disappears once it becomes obvious. Right now it's still hiding in plain sight.
The thesis distilled to one sentence: power is the binding constraint of the AI era, and Everpure is the only company that can deliver hyperscaler-grade flash storage with the density and power efficiency required to keep building AI datacenters as the world runs out of available megawatts. Everything else flows from that.
Start with the power problem nobody is pricing correctly. Datacenters globally are no longer constrained by space, capital, or compute capacity. They are constrained by available electricity. Microsoft is signing nuclear PPAs to restart Three Mile Island. Meta committed 1.5 gigawatts to nuclear partnerships. Amazon is buying nuclear-adjacent datacenter campuses. Constellation Energy is up 5x in two years on this thesis alone. Every megawatt allocated to storage is a megawatt that cannot power GPUs. This is the equation that determines who wins the AI buildout. DirectFlash technology delivers 5 to 10 times the power efficiency of HDD storage at equivalent capacity. At hyperscaler scale, this translates directly into hundreds of millions of dollars in operational savings per datacenter per year, and more importantly, frees the power budget to deploy thousands of additional GPUs in the same footprint. Pure is not selling a faster storage box. They are selling additional GPU capacity through power efficiency arbitrage. This is why hyperscalers are signing. The math is undeniable.
The moat behind this is real and 15 years deep. Most storage companies buy commodity SSDs and put them in arrays. Everpure does something fundamentally different. They buy raw NAND flash chips directly from suppliers like Kioxia and manage them with their own software, bypassing the SSD controller layer entirely. This approach took 15 years and over a billion dollars in R&D to build. The result is DirectFlash Modules at 150TB today, 300TB shipping, and 600TB on the roadmap. A standard enterprise SSD maxes out at 30TB. The density gap is structural and widening with every generation. You cannot replicate this in a boardroom decision. Dell, NetApp, and HPE have publicly identified the AI storage opportunity for years and have been unable to close the architectural gap because their existing product lines depend on commodity SSDs. Walking away from that means destroying their core business. Pure had no such legacy to protect when they built DirectFlash from scratch starting in 2009. The IP, the patents, the software stack, the supplier relationships, and the hyperscaler qualifications are not catchable in any reasonable timeframe. This is a genuine technology moat in a world where most "moats" are marketing.
The TAM behind this moat is one of the largest in technology. The hyperscaler addressable market for storage modernization is over $700 billion in cumulative spend over the next decade. Every existing datacenter built on HDD architecture must eventually transition to flash because the power profile of disk is no longer compatible with AI workloads. Pure is currently capturing this transition through a hardware-excluded licensing model with Meta, generating 90 percent gross margins on software royalties while Meta procures the hardware itself. This structure delivers software-company economics on a category traditionally valued at hardware multiples. Multiple hyperscalers are reportedly in advanced engagement based on coded language in recent
4
4
42
9,305

Mar 5
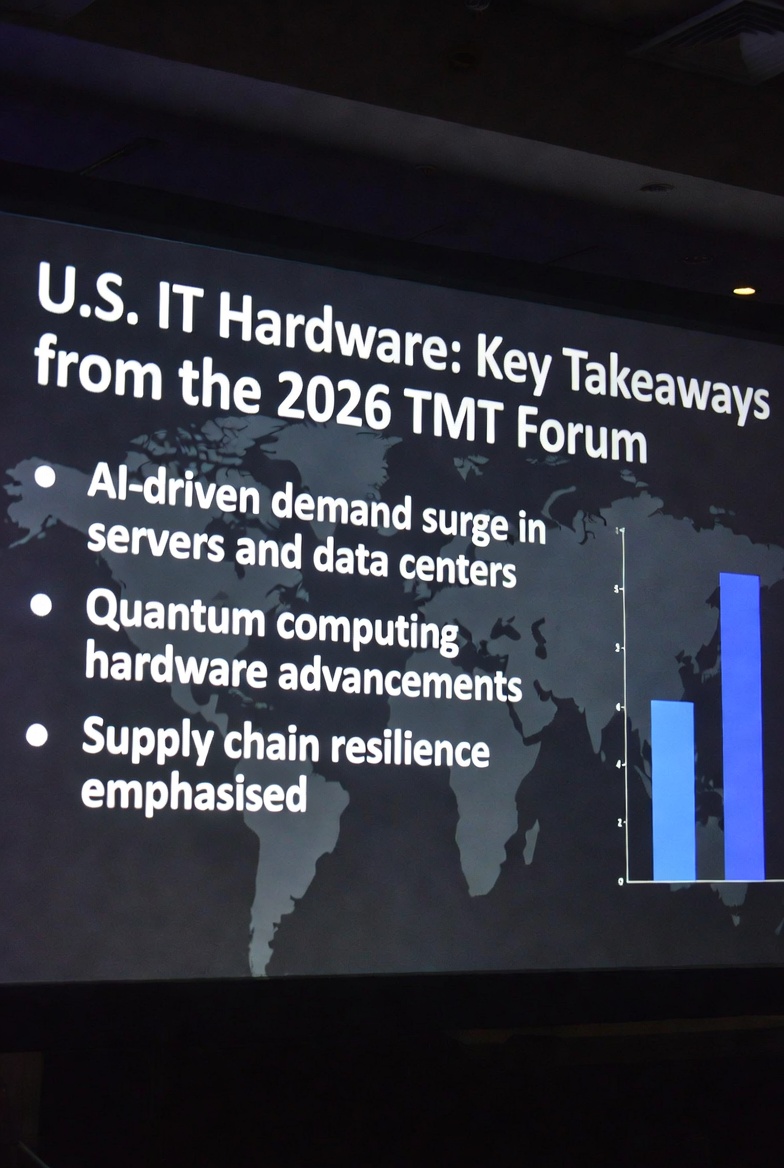
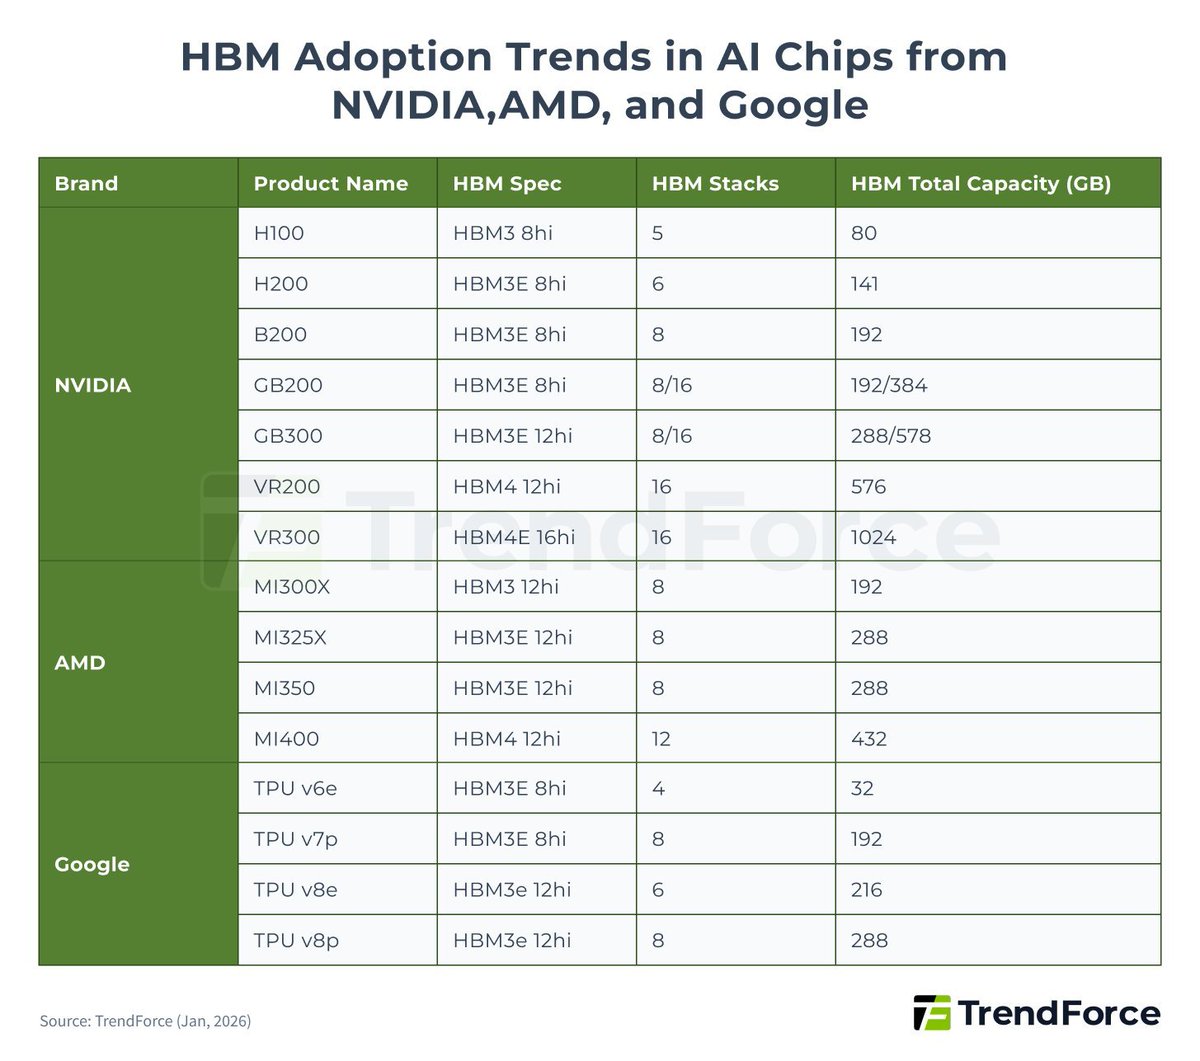
미국 IT 하드웨어: 2026 TMT 포럼의 주요 시사점
주요 기업별 핵심 포인트 요약 (2026년 3월)
1. SanDisk (샌디스크 / WDC)
• 비즈니스 모델 대변혁: 업계가 변동성 높은 주기적 사업에서 장기적 안정 수익 모델로 전환 중.
• 핵심 수단: 장기 계약(LTA)으로 고가격 고정 고객 장기 구매량 명시 → 수요 예측 불확실성 제거.
• 추가 포인트: HBF(고대역폭 플래시) 개발 순조, AI 추론용 HBM 대안 기대, 연내 다이 출시 예정.
2. Seagate (시게이트 / STX)
• 과대광고 거부: NAND 가격 급등에도 안정적 가격 정책 고수 → 11개 분기 연속 안정적인 매출총이익률.
• 핵심 동력: AI 학습 데이터 저장 추론 데이터 생성으로 HDD 용량 연평균 20% 중반 성장 전망.
• 궁극적 경로: HAMR 기술로 물리적 HDD 수 증가 없이 용량 2배 확대(20TB→40TB), 클라우드 TCO 대폭 절감.
3. Pure Storage (퓨어 스토리지 / PSTG)
• 핵심 경쟁력: 기존 SSD 아닌 소프트웨어 직접 관리 'DirectFlash' 기술.
• 차별화: 기업용 SSD 대비 가격 대비 성능 30~40% 향상, 전력·공간·발열 HDD의 1/10 수준.
• 실적 전망: 2026년 하이퍼스케일러 출하량 두 자릿수 엑사바이트, 매출총이익률 75~85% 기대.
4. Rigetti Computing (리제티 컴퓨팅 / RGTI)
• 현재 상태: 연구개발 단계, 상업적 수익까지 3~4년(2029년경) 소요 전망.
• 기술 노선: 초전도 큐비트가 주류(업계 자금 95%), 게이트 속도 이온 트랩 대비 수천 배 빠름.
• 차별화: '칩렛' 아키텍처로 수율 향상 및 비용 절감, IBM/구글 방식과 차별화.
5. Arista Networks (아리스타 네트웍스 / ANET)
• 프로토콜 통합: AI 클러스터 확대로 이더넷이 AI 전반의 '보편적 네트워크 구조'로 부상.
• 복잡성의 이점: 전력·발열·대역폭 문제와 기술 교체(400G→1.6T)로 인한 복잡성이 진입장벽, 핵심 공급자 지위 강화.
6. Logitech (로지텍 / LOGI)
• 성장 동력 전환: 신규 PC 판매보다 기존 PC 사용자 기반과 주변기기 추가 구매율 상승이 실적 견인.
• 구조적 변화: B2B(영상 협업) 확대로 현재 B2B 비중 약 40% → 향후 소비자/기업 매출 50:50 목표.
$WDC $STX $PSTG $RGTI $ANET $LOGI
#AI #반도체 #저장장치 #네트워크 #양자컴퓨터 #데이터센터 #투자전략
2
179


Feb 22
I’m not against $PSTG but these have been my two biggest concerns:
(1) Buyer and not supplier of flash memory means pain on input costs.
(2) I get high customer satisfaction but just as I raised concerns last year about $RBRK, in similar matter, what is stopping others from potentially building software stack on top of flash to offer similar of Pure Storage? NetApp counters that DirectFlash has no real advantage.
2
6
2,833
Feb 18
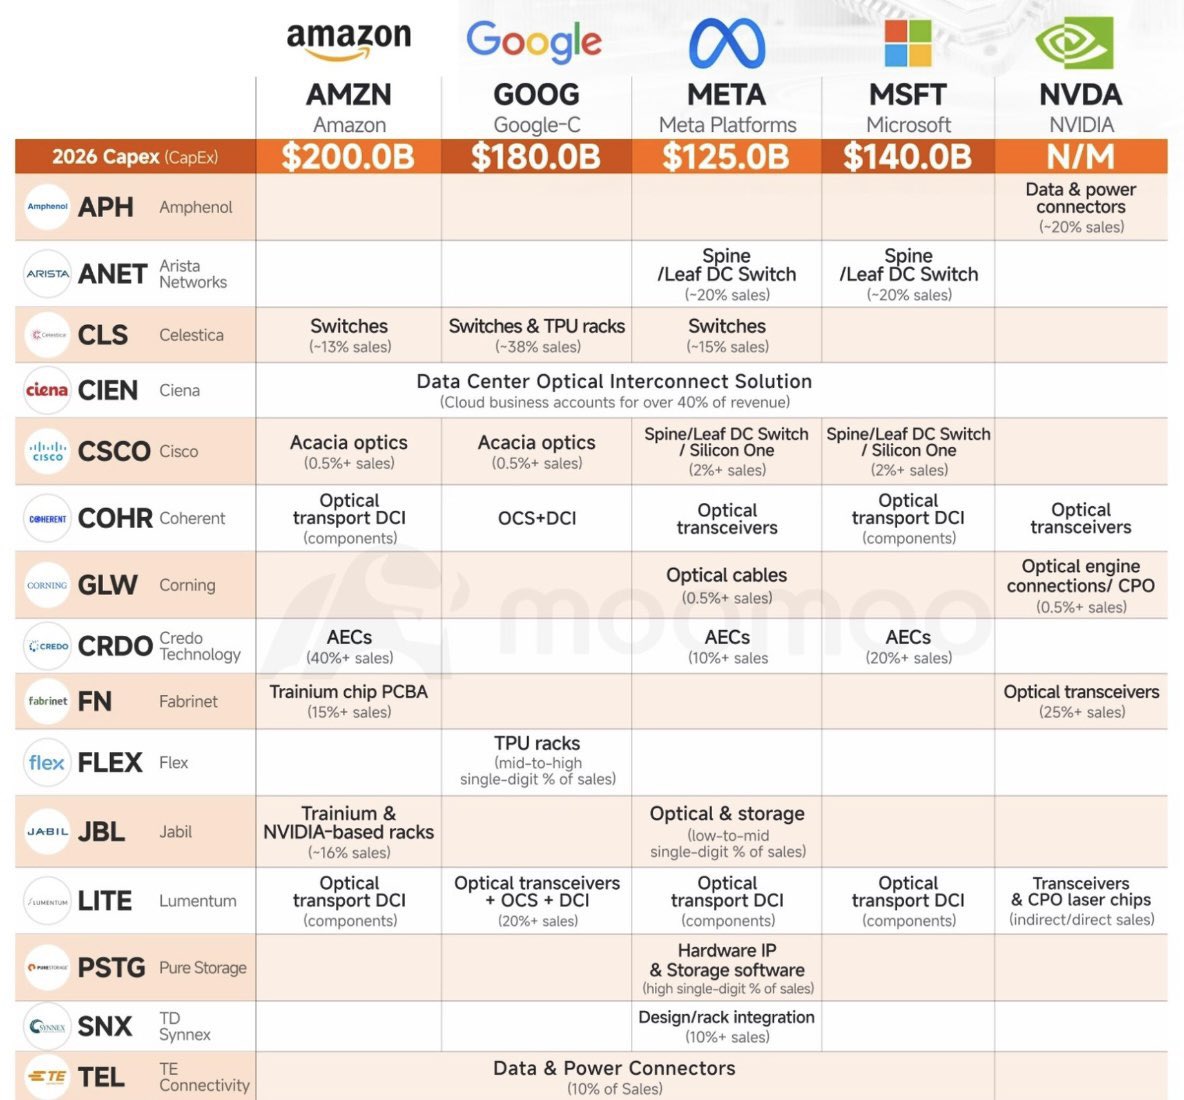
The names I've been discussing regularly over these past months, $LITE $COHR $CIEN, have exposure to all the US hyperscalers, with $TE in addition.
EXECUTIVE SUMMARY
The image presents a supplier exposure map tied to projected 2026 hyperscaler capital expenditures, with columns for AMZN ($200.0B), GOOG ($180.0B), META ($125.0B), MSFT ($140.0B), and NVDA (N/M), and rows listing selected publicly traded beneficiaries across networking, interconnect, rack integration, and storage. A “Morgan Stanley” watermark is visible, indicating the figure likely originated from a Morgan Stanley research deck or was reproduced from such material.
The 2026 capex magnitudes shown for GOOG and META are directionally consistent with publicly disclosed guidance for 2026 capex ranges, while the MSFT number appears to be an annualized extrapolation from recent quarterly capex run-rates rather than a single explicit full-year guidance figure. Alphabet has guided 2026 capex in a $175B–$185B range. Meta has guided 2026 capex in a $115B–$135B range (including finance leases). Microsoft reported quarterly capex including finance leases of $37.5B and cash paid for property and equipment of $29.876B in the quarter ended 12/31/2025, with $49.270B cash paid for property and equipment in the 6 months ended 12/31/2025; annualization of these run-rates supports a >$140B implied level depending on inclusion of finance leases and intra-year seasonality. Reuters has reported AMZN “projected” 2026 capital spending at approximately $200B.
Several row-level “% of sales” exposure figures in the image can be partially corroborated via public filings, but the majority appear to be analyst estimates, often blending direct revenue exposure with indirect “end-market” exposure. Where direct-customer concentration is disclosed, the image’s ~% figures generally align directionally but differ materially in some cases due to period mismatch, definitional mismatch (total company vs product-line), and the presence of indirect sales channels.
The most verifiable and investment-relevant takeaway is not the precision of any single cell, but the structural message: incremental AI/data center capex is heavily connectivity- and infrastructure-intensive, creating outsized content opportunity for connectors/power distribution, high-speed switching, short-reach interconnect (AECs and optics), and rack-level integration. The secondary takeaway is that the chart’s highlighted beneficiaries are disproportionately exposed to 1–2 hyperscaler customers, which raises volatility, pricing power asymmetry, and sudden program-shift risk even if aggregate capex expands.
IMAGE DESCRIPTION AND INTERNAL CONSISTENCY CHECK
The figure is structured as a matrix mapping capex “demand centers” (AMZN, GOOG, META, MSFT, and NVDA) to “supply chain beneficiaries” (APH, ANET, CLS, CIEN, CSCO, COHR, GLW, CRDO, FN, FLEX, JBL, LITE, PSTG, SNX, TEL). Each populated cell names a product category (e.g., spine/leaf switches, AECs, optical transport DCI components, optical transceivers, OCS, CPO-related components, TPU racks, Trainium-related PCBA, rack integration) and in many cases annotates an estimated contribution to supplier sales (e.g., “~20% sales,” “0.5% sales,” “mid-to-high single-digit % of sales,” “high single-digit % of sales”).
Internal consistency is mixed but directionally coherent:
Cells with “0.5% sales” or “2% sales” appear used for diversified conglomerates where AI-related content is material to growth but small versus consolidated revenue (e.g., CSCO, GLW).
Cells with “10% ,” “15% ,” “20% ,” or “40% ” appear used for companies with concentrated hyperscaler programs or product lines dominated by AI connectivity demand (e.g., ANET, CLS, CRDO, LITE, FN).
The NVDA column lists components associated with NVDA’s networking and platform ecosystem (transceivers, CPO laser chips, connectors) rather than “capex,” which is marked N/M. This is a reasonable presentation choice because NVDA is primarily a compute and platform supplier; its own capex is not the driver of demand for the listed components in the same way hyperscaler data center buildouts are.
2026 CAPEX VALIDATION AND DEFINITIONAL COMPARABILITY
The capex amounts in the image should be interpreted as “all-in” infrastructure investment budgets, but definitional comparability across the columns is not guaranteed. Public disclosures vary in whether capex is presented as:
cash paid for property and equipment (PPE),
capital expenditures including finance leases, and/or
broader “total capex” measures including principal repayments on finance leases and other items.
GOOG: Alphabet has guided 2026 capex in a $175B–$185B range. The image’s $180.0B aligns with the midpoint.
META: Meta has guided 2026 capex in a $115B–$135B range, explicitly including finance leases. The image’s $125.0B aligns with the midpoint.
MSFT: Microsoft’s cash paid for property and equipment was $29.876B in the quarter ended 12/31/2025 and $49.270B in the 6 months ended 12/31/2025. Microsoft also reported capex including finance leases of $37.5B for the quarter (with management commentary that quarter-to-quarter variability is expected). Annualizing recent quarters yields an implied level around the image’s $140.0B, but this should be treated as an extrapolation rather than a validated guidance point.
AMZN: Reuters reporting indicates AMZN projected approximately $200B capital spending in 2026. The number is therefore plausible as a market-reported projection, but the definitional basis (cash PPE vs capex including leases) materially affects comparability versus GOOG/META/MSFT.
Aggregate implication: The image implies combined 2026 capex of $645.0B for AMZN GOOG META MSFT. Even allowing for definitional differences, this level implies an AI infrastructure buildout regime where non-compute bottlenecks (power, networking, and interconnect) can become first-order constraints and therefore capture disproportionate incremental spend.
SUPPLY CHAIN CONTENT: TECHNICAL INTERPRETATION BY LAYER
The product categories highlighted map to 4 high-level infrastructure layers:
RACK-LEVEL BUILD AND INTEGRATION
Includes TPU racks, Trainium and NVDA-architecture racks, and general rack integration. These are typically supplied via ODM/EMS partners and system integrators (CLS, FLEX, JBL, SNX) plus contract manufacturers (FN). Economics are generally lower margin but high volume, with throughput and working capital management as key drivers.
INTRA-DATA CENTER NETWORKING
Spine/leaf switching and related silicon/platform content. ANET is highlighted for META and MSFT, consistent with large cloud switching footprints. CSCO is included as smaller exposure via switching/Silicon One.
INTRA-CLUSTER INTERCONNECT
AECs and optical transceivers are highlighted as the dominant near-term content vectors. AECs address high-speed, short-reach connections (rack-to-rack and within row) where power/latency and cost tradeoffs compete with pluggable optics. Optical transceivers are required for longer reach and scaling to larger topologies; the chart also flags OCS and CPO as architectural evolutions.
DATA CENTER INTERCONNECT (DCI) AND “AROUND THE DATA CENTER”
Optical transport DCI components and platforms (CIEN, CSCO via Acacia optics; COHR and LITE as component suppliers) map to the need to interconnect large campuses and multi-site clusters for training and distributed inference.
The image’s emphasis on OCS and CPO is technically directionally correct. OCS can reduce transceiver counts and power by enabling reconfigurable optical topologies, but adoption is architecture-dependent and benefits hyperscalers with custom networking stacks and control planes. CPO reduces electrical trace losses and power at very high bandwidth densities but shifts value between optical engine makers, connector/fiber attach ecosystems, and switch/GPU platforms; it also introduces packaging, thermal, and serviceability constraints that can slow deployment.
COMPANY-LEVEL VALIDATION AND FACT CHECKING
CONNECTORS AND POWER: APH, TEL
TEL (TE Connectivity): The image assigns “Data & Power Connectors (10% of Sales).” TE’s FY2025 annual report states approximately 13% of net sales were to customers in the digital data networks end market, explicitly noting that demand in this market depends on networking and data center infrastructure, and it also states digital data networks organic net sales increased 72.6% in FY2025 due primarily to growth in AI and cloud applications. This supports the image’s characterization that data center/digital networking is a >10% revenue exposure and is AI-linked. The image’s phrasing is directionally consistent, though TE’s disclosure is end-market based and not limited to “connectors” as a product subset.
APH (Amphenol): The image assigns “Data & power connectors (~20% sales)” tied to NVDA. A direct, public corroboration of “~20% of total Amphenol sales” tied specifically to NVDA-related data/power connectors is not established in the sources reviewed. The strategic direction toward IT datacom connectivity is supported by Amphenol’s agreement to acquire CommScope’s Connectivity and Cable Solutions division for $10.5B, described as enhancing fiber optic interconnect capabilities for the expanding IT datacom market including AI and data center applications. The cell should therefore be treated as an analyst estimate of program exposure rather than a validated disclosed figure.
NETWORKING AND SWITCHING: ANET, CLS, CSCO
ANET (Arista): The image assigns “Spine/Leaf DC Switch (~20% sales)” for META and MSFT. Arista’s FY2025 10-K discloses 2 end customers with material revenue concentration: sales to 1 end customer represented 16% of total revenue in 2025 (15% in 2024; 21% in 2023) and sales to the other end customer represented 26% of total revenue in 2025 (20% in 2024; 18% in 2023). These disclosed concentrations are consistent with the image’s “~20%” conceptually, but the image compresses a 16%/26% reality into a symmetric ~20% label and does not specify period. The mapping of these end customers to META and MSFT is widely assumed in market commentary, but Arista’s filing language itself does not name the end customers; the key fact that is verifiable is the magnitude of 2-customer concentration.
CLS (Celestica): The image assigns AMZN “Switches (~13% sales),” GOOG “Switches & TPU racks (~38% sales),” and META “Switches (~15% sales).” Celestica disclosed high customer concentration: in FY2025, 3 customers represented 32%, 14%, and 12% of total revenue. Celestica also explicitly referenced being a preferred manufacturing partner for Google’s data center hardware and TPU systems and discussed investments to support Google’s U.S. production of TPU systems. This provides strong validation that a large portion of revenue is tied to a hyperscale customer and that TPU systems are within Celestica’s scope. The exact “~38%” figure is not directly confirmed by the FY2025 disclosed concentration (32% for the largest customer), indicating either (a) a period mismatch (quarterly concentration higher than annual), (b) an estimate inclusive of adjacent Google programs not reflected in the single-year concentration number, or (c) a modeling assumption of 2026 run-rate.
CSCO (Cisco): The image assigns “Acacia optics (0.5% sales)” for AMZN and GOOG, and “Spine/Leaf DC Switch / Silicon One (2% sales)” for META and MSFT. These values appear deliberately small, implying Cisco’s AI networking participation is strategically relevant but financially modest versus consolidated Cisco revenue. Public filings generally do not provide a clean, directly comparable “Acacia optics as % of sales” metric, so these should be treated as analyst estimates consistent with Cisco’s scale and diversification.
DATA CENTER OPTICAL INTERCONNECT AND DCI: CIEN, COHR, LITE, GLW
CIEN (Ciena): The image states “Data Center Optical Interconnect Solution” and that “Cloud business accounts for over 40% of revenue.” Ciena’s FY2025 annual report shows sales to 1 cloud provider were $851.6M, or 17.9% of total revenue in FY2025 (and AT&T was 10.5%), with the 5 largest customers representing 49.7% of revenue. This validates meaningful cloud provider dependence but does not by itself reach “over 40%,” because that phrase likely refers to total cloud provider segment revenue across multiple cloud customers rather than 1 named customer. A summary of Ciena’s FY2025 Q4 earnings presentation indicates “Direct Cloud Provider revenue… represented 42% of total revenue” (and “Non-telco represented 55% of total revenue”). Taken together, the “over 40%” assertion is directionally consistent when interpreted as “direct cloud provider segment revenue as a share of revenue in a specific period,” but it should not be interpreted as “1 cloud customer represents >40% of revenue.”
COHR (Coherent): The image assigns optical transport DCI components for AMZN and MSFT, OCS DCI for GOOG, and optical transceivers for META and NVDA. These product categories are plausible for Coherent’s photonics portfolio, but the image provides no disclosed corroboration for % of sales. The most defensible interpretation is that Coherent is exposed to the underlying architectural themes (DCI, OCS, transceivers) with uncertainty on direct vs indirect revenue capture.
LITE (Lumentum): The image assigns AMZN/META/MSFT “Optical transport DCI (components),” GOOG “Optical transceivers OCS DCI (20% sales),” and NVDA “Transceivers & CPO laser chips (indirect/direct sales).” Lumentum’s FY2025 10-K shows customer concentration where multiple customers were >10% of revenue, with the largest customer at 16.0% and another at 15.4% for FY2025. This disclosure does not validate a single-customer “20% ” share in FY2025, implying the image’s “20% ” could reflect (a) a later period with higher concentration, (b) a product-line share rather than total company share, or (c) an analyst estimate of GOOG program-driven end demand. The NVDA CPO laser chip linkage is directionally consistent with industry roadmaps toward CPO, but direct revenue attribution remains uncertain from public filings.
GLW (Corning): The image assigns “Optical cables (0.5% sales)” for META and “Optical engine connections/ CPO (0.5% sales)” for NVDA. The small size annotation is plausible given Corning’s diversification, but the specific product-to-customer mapping and the “0.5% ” figures are not validated from sources reviewed.
ELECTRICAL INTERCONNECT: CRDO
CRDO (Credo): The image assigns AMZN “AECs (40% sales),” META “AECs (10% sales),” and MSFT “AECs (20% sales).” Credo’s FY2025 10-K shows extreme customer concentration: Customer A represented 67% of total revenue in FY2025 (39% in FY2024; 46% in FY2023), and top 10 customers represented approximately 90% of total revenue; accounts receivable concentration was also high (Customer A at 86% at FY2025 year-end). This fact pattern validates that Credo is substantially dependent on a single hyperscale ecosystem customer and that revenue sensitivity to 1 program is high. The image’s “40% ” for AMZN is therefore not inconsistent directionally, but it is lower than Credo’s FY2025 disclosed 67% concentration, indicating either a later-period diversification not captured by FY2025 annual disclosure or a narrower definition (AEC product line vs total company). Market commentary has linked Credo’s largest customer to AMZN, and 1 recent market report referenced a “largest customer (possibly Amazon)” at 42% of sales, consistent with the image’s magnitude if diversification has progressed.
From a technical standpoint, the AEC emphasis is coherent: AECs offer a near-term scaling vector for short reach high-speed connectivity (e.g., 800G) with attractive power/performance tradeoffs vs passive copper at longer reaches, but face medium-term substitution risk as optics cost curves improve and as architectures adopt more optical switching and potentially CPO. The chart’s emphasis on AECs as a hyperscaler-specific lever is plausible, as internal cabling choices can differ materially by operator and by cluster topology.
RACK INTEGRATION, ODM/EMS, AND CONTRACT MANUFACTURING: FN, FLEX, JBL, SNX
FN (Fabrinet): The image assigns “Trainium chip PCBA (15% sales)” for AMZN and “Optical transceivers (25% sales)” for NVDA. Fabrinet’s public filings show dependence on a small number of customers: during fiscal years 2025 and 2024, 2 customers each contributed 10% or more of revenue, and together accounted for 45.8% and 48.5% of revenue, respectively. This validates meaningful customer concentration but does not validate that NVDA is directly a 25% customer. Fabrinet’s business model is predominantly contract manufacturing for OEMs; therefore, “NVDA exposure” is more plausibly an end-market exposure (transceivers ultimately shipped into NVDA-associated systems) rather than direct billed revenue to NVDA. The “25% ” number should therefore be treated as an analyst estimate of end-demand linkage, not a directly disclosed customer concentration metric.
FLEX (Flex) and JBL (Jabil): The image assigns TPU rack build exposure to FLEX and Trainium/NVDA-architecture rack build exposure to JBL. Public, clean percentage-of-sales disclosures for “TPU racks” or “Trainium racks” are generally not provided in standard segment reporting, and no primary filings were identified in the sources reviewed that validate the specific “mid-to-high single-digit %” or “~16%” values. These values should be treated as analyst estimates that may be highly time-varying and dependent on whether revenue is recorded gross vs net of pass-through components.
SNX (TD SYNNEX): The image assigns “Design/rack integration (10% sales)” for META. This aligns directionally with the existence of hyperscale integration businesses within large distribution/platform companies, but the precise “10% ” figure and META specificity are not validated in the sources reviewed.
STORAGE AND IP: PSTG
PSTG (Pure Storage): The image assigns META “Hardware IP & Storage software (high single-digit % of sales).” Pure Storage has publicly discussed licensing its DirectFlash hardware and software technology to a hyperscaler customer, with product revenues including royalties from hyperscaler shipments. Independent reporting also referenced a META-related deal influencing Pure’s outlook, consistent with the image’s suggestion of META-linked software/IP economics rather than classic hyperscaler procurement of finished arrays. The “high single-digit %” magnitude is not directly verified, but the direction (hyperscaler royalties/IP model rather than pure hardware sales) is credible.
KEY INTERPRETATION ISSUES AND POTENTIAL MISREADS
DIRECT CUSTOMER EXPOSURE VS END-MARKET EXPOSURE
For ANET and CRDO, the “% of sales” figures can map directly to disclosed customer concentration and therefore have higher interpretability. For FN, COHR, LITE, GLW, the value chain often runs through OEMs and module makers; “exposure” can mean end-demand sensitivity rather than contractual revenue directly invoiced to the named hyperscaler or to NVDA.
PERIOD AND DENOMINATOR AMBIGUITY
Several rows likely mix fiscal years and run-rate quarters. For example, CLS’s largest customer is 32% in FY2025, but the image shows ~38% for GOOG, which could reflect a higher quarterly concentration or a 2026 program ramp assumption rather than FY2025 realized revenue share. Similarly, CRDO’s FY2025 customer A share is 67%, while the image shows 40% for AMZN, suggesting either diversification after FY2025 or a product-line-only denominator.
CAPEX DEFINITIONS MAY NOT ALIGN ACROSS COLUMNS
META’s guidance explicitly includes finance leases. Microsoft’s reported capex including finance leases differs materially from cash PPE in the same quarter. If AMZN’s reported “capital spending” is defined differently (e.g., including lease repayments), the column-to-column comparison becomes less meaningful for sizing “wallet share” available to the mapped suppliers.
THE MAP IS SELECTIVE
Major AI infrastructure beneficiaries not shown include GPU/ASIC supply chain, merchant silicon, memory, substrates/packaging, power and cooling infrastructure vendors, and fiber/transceiver module OEMs. The map appears designed to highlight a curated set of “connectivity and integration” equities rather than represent a complete bill of materials.
INVESTMENT-RELEVANT OBSERVATIONS IMPLIED BY THE MAP
CONNECTIVITY IS A DISPROPORTIONATE BENEFICIARY OF AI CAPEX
The supplier list is heavily skewed toward interconnect and networking, consistent with the reality that scaling AI training clusters increases the network-to-compute cost share and tightens latency/bandwidth constraints. This elevates demand for high-speed switch fabrics, cabling (AEC and fiber), and optical platforms for DCI.
CUSTOMER CONCENTRATION IS A CENTRAL RISK FACTOR
ANET and CRDO provide explicit examples where 2 customers or 1 customer represent outsized shares of revenue, which amplifies sensitivity to procurement timing, qualification changes, architecture transitions, and insourcing. Even when aggregate capex rises, share shifts between hyperscalers and between architectures can produce abrupt downdrafts for single-name suppliers.
ARCHITECTURE TRANSITIONS CAN REPRICE THE VALUE CHAIN
The inclusion of OCS and CPO signals that the market is not in a static “more of the same optics” regime. If OCS adoption accelerates, transceiver volume per incremental bandwidth can change, shifting value toward optical switching and control-plane capable ecosystems. If CPO adoption accelerates, value can migrate toward optical engines, packaging/assembly, and connector/fiber attach ecosystems, while challenging traditional pluggable optics margins and changing serviceability assumptions.
ODM/EMS BENEFICIARIES FACE DIFFERENT ECONOMIC TRANSMISSION
CLS, FLEX, JBL, and SNX exposure is likely more volume-driven with lower incremental margin per $ of incremental capex, and can be impacted by pass-through commodity pricing, working capital swings, and customer negotiations on cost-plus structures. In contrast, ANET, CRDO, CIEN, and certain optics component suppliers can have higher gross margin leverage but also higher technology and qualification risk.
BOTTOM LINE VALIDATION ASSESSMENT
The image is directionally credible as a qualitative map of which listed suppliers participate in the AI data center buildout and which hyperscalers are most associated with specific architectural elements (TPU/Trainium racks, spine/leaf switching, AECs, DCI optics, and emerging OCS/CPO themes). The capex figures for GOOG and META match publicly disclosed 2026 capex guidance midpoints, and the MSFT figure is consistent with annualizing reported capex run-rates, while AMZN’s figure is consistent with widely reported 2026 spending projections.
The precision of several “% of sales” cells is not fully verifiable from public disclosures and should be treated as analyst estimates that may combine direct and indirect exposure and may be time-period specific. Where public filings do allow verification, the image is broadly in the correct magnitude range but not exact: ANET’s customer concentrations are 16% and 26% in FY2025 rather than symmetric ~20%; CRDO’s largest-customer concentration is 67% in FY2025 rather than 40% , implying either subsequent diversification or a narrower denominator; TE’s digital data networks end market is 13% of net sales, supporting the “10% ” characterization.

5
26
119
24,471

Feb 11
2.11 美股日记 - Seedance 引发的存储赛道重估
一、宏观盘前指引
周二美股分化:昨夜指数分化但“广度偏强”:标普 -0.3%至 6941.8、纳指 -0.6%、道指 0.1%并续创新高,价值/等权相对占优。
宏观:关键矛盾在“盈利强 vs 消费/就业弱”:纽约联储 Q4 家庭债务升至 18.8 万亿美元、整体逾期率 4.8%(2017 以来高位),学生贷转入严重拖欠占比 16.2%,压力集中在低收入与年轻群体。
资金面上,达里奥称临近“资本战”,风险偏好更容易向黄金等低阻力避险迁移。
产业线索:台方称将 40%芯片产能迁美“不可能”,叠加 TSMC 1 月营收同比约 37% 显示 AI 需求仍稳。
未来关注:8:30ET 公布 1 月就业;SHOP 盘前财报,决定软件股反弹成色;周五公布 1 月 CPI。
二、美股观察 - Seedance 引发的存储赛道重估
1、背景
Seedance 2.0 将视频生成从“可展示”推进到“可规模化生产”,其硬件外溢并非单纯增加 GPU,而是显著抬升数据侧吞吐需求:(1)训练端需要更大数据集与更快迭代;(2)推理/生产端产生海量中间素材(分镜、版本、缓存、检索),形成“高写入 高读取”的双向压力。
结论:AI 视频的工业化会把数据中心投资从“算力堆叠”进一步推向“存储与数据管道扩容”,使 NAND/SSD 与企业级全闪的需求更具结构性与持续性。
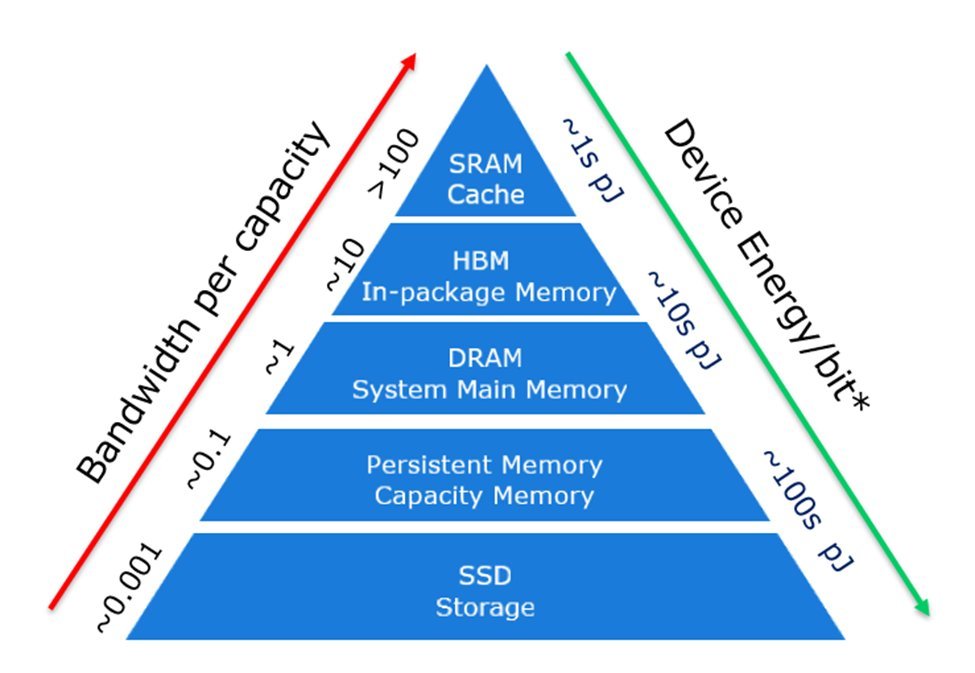
2、赛道 Overview:从 HBM → 商品 DRAM/NAND → 企业级全闪
本轮内存/存储的核心不是传统周期,而是供给约束 AI 需求长期化:
供给端:HBM 更“吃硅”,挤占传统 DRAM/NAND 的资本与产能弹性,导致行业更难像过去那样快速扩产;供给释放被推迟到更后面。
需求端:AI 数据中心对高端内存(HBM)与通用内存(商品 DRAM)同时抬升;同时“数据湖/检索/推理”把 NAND/SSD 需求拉长。
产业落点:上游(Samsung/MU)赚“涨价与供给话语权”,下游(PSTG)赚“把数据喂饱 GPU 的基础设施升级”。
3、供给约束与“双速脱钩”的供需新常态
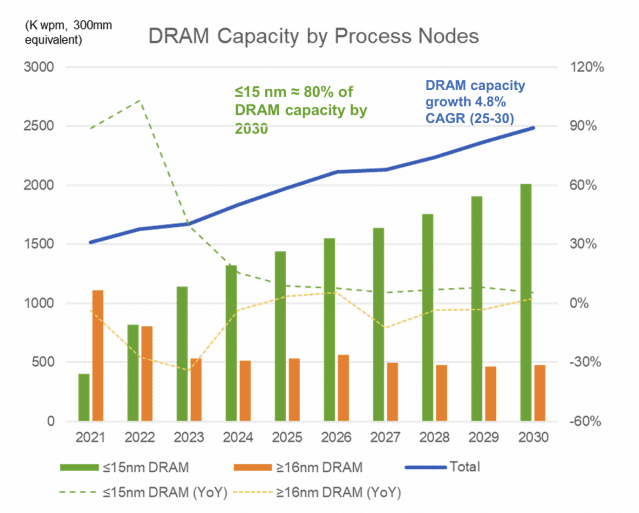
@jukan05 引用 (x.com/jukan05/status/2021412…) SEMI 口径指出 DRAM 产能增速长期偏低(2024–2030 年 CAPA 年化约 4.8%),且新增更偏向 HBM,意味着传统/专用 DRAM 可能更紧,短缺或延续至 2028 甚至更久。
与此同时,SMIC CEO 的表述(x.com/RYANHINGSHING/status/2…)进一步强调:AI/HBM 的瓶颈将从前端晶圆转移到后端工艺(TSV 堆叠、FT 测试、良率与认证爬坡极慢),导致 AI 侧缺货具有“多年化”特征;而手机/PC 等消费端虽被 AI 抽走产能而紧张,但新厂落成与渠道去库存可能在 9–12 个月内带来反转。因此,标的定价的关键在于:所处环节更偏“后端瓶颈(长窗口)”还是“消费端错配(短窗口)”。
4、Samsung Electronics:HBM4 量产爬坡的唯一全栈平台
一句话购买理由:全球唯一拥有“一站式闭环”能力的 HBM4 终极扩产商,正处于从“HBM 掉队者”到“全能垄断者”的估值修复前夜。
业务与环节定位:三星覆盖 DRAM/NAND 原厂供给,同时推进 HBM4,并跨越前端制造与后端交付环节,属于产业链最上游且“垂直整合度最高”的供给侧平台。其盈利弹性来自两条线:一是 HBM4 放量带来的结构性增量;二是商品 DRAM/NAND 涨价带来的周期弹性与谈判优势。
@jukan05 引用(x.com/jukan05/status/2021057…)券商观点强调非存储业务边际改善、并将商品 DRAM/NAND 的大幅涨价视为 HBM4 议价条件的强化。该观点隐含的核心是:市场不应只按“HBM 份额输赢”定价,而应将“涨价 议价权 量产爬坡能力”合并评估。
估值思考:当前市场仍沉浸于三星在 HBM3E 时代输给海力士的“旧叙事”,严重忽视了其作为首家 HBM4 出货商的潜力。其窗口期源于“后端瓶颈突破者”的身份,利用规模化封测产能吞噬数年内无法缓解的 AI 高质量存储缺口。需注意,2026 年 Q3 可能是业绩波动点,届时消费电子端的产能释放或令非 HBM 业务利润率承压。
5、MU(Micron):最纯粹的商品 DRAM 涨价 Beta
一句话购买理由:二级市场中最纯粹的“商品 DRAM 价格弹性”标的。
业务与环节定位:Micron 是 DRAM/NAND 原厂,处于内存产业链最上游,核心在前端晶圆产出与产品结构(商品 DRAM、HBM3E/4、NAND)配置。其主要受益路径是:AI 需求挤压供给弹性,推高商品 DRAM/NAND 价格与合同条款的“供应商友好度”,使盈利周期更依赖“供给释放”而非“需求崩塌”见顶。
@jukan05 转述 Korea Investment & Securities (x.com/jukan05/status/2021359…)观点称,HBM4 延迟对 Micron 盈利影响有限,因为 2026 年利润上行主要来自商品 DRAM/NAND ASP 的持续上升,且商品 DRAM 的季度定价机制更利于利润扩张。该观点的实质是:市场对 HBM4 进度的情绪波动可能制造短期错价。
估值思考:市场因 HBM4 进度的短期干扰(FUD)导致价格出现回撤,这实际上创造了买入窗口。其窗口期源于手机/PC 产能被 AI 抽走带来的 ASP 飙升。风险点同样在 2026 年 Q3,若通道商届时开始抛货,且 HBM4 尚未形成绝对利润支撑,股价可能随大盘商品存储周期同步反转。
6、PSTG(Pure Storage):把 NAND 卖出软件溢价的 AI 数据通道商
一句话购买理由:通过其独有的软硬一体化闪存技术消除了算力集群中的“存储墙”瓶颈,确保数据吞吐速率能够匹配 GPU 的峰值算力,极大程度提高了算力利用率。
业务与环节定位:PSTG 提供企业级全闪存储系统与软件(FlashBlade 等),处于产业链下游的“终端存储解决方案/数据平台层”,直接对接数据中心建设与 AI 数据管道升级需求。其需求与 Seedance 逻辑更贴近:视频 AI 工业化带来海量热数据与中间素材管理,企业端需要更高吞吐、更低延迟、更可扩展的全闪与对象化能力来承接推理与检索负载。
@Chip Stock Investor (youtube.com/watch?v=ysyZ8doi…)认为 PSTG 当前“并未得到足够的投资者关注”,公司与 hyperscaler(披露为 Meta)合作处于研发与导入阶段,收入有望随 hyperscaler ramp-up 加速;同时市场担忧在研发投入期利润率与自由现金流波动、以及 NAND 供给紧张对成本传导能力。该观点为“增长提速 vs 利润波动”的定价矛盾提供了框架。
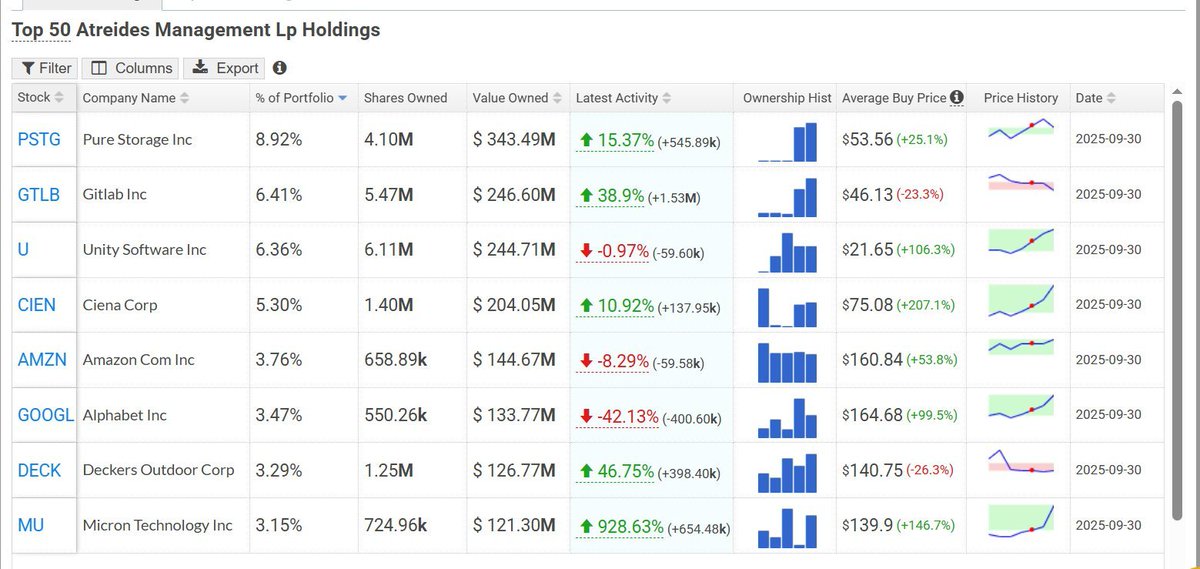
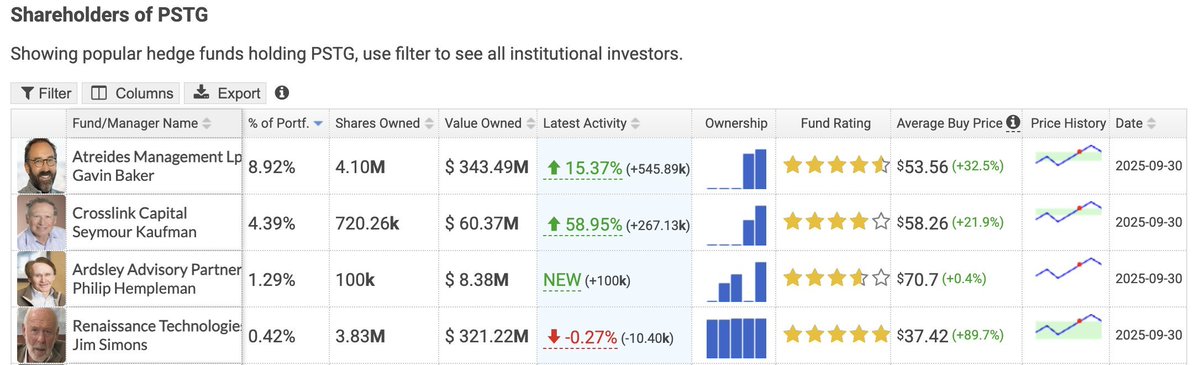
此外,根据公开讨论与其最新 13F 披露(x.com/SingularityRes/status/…),知名科技投资人 Gavin Baker 已重仓买入 PSTG,最新数据显示其持仓约 410 万股(约 3.43 亿美元),占其组合比例近 9%。
估值思考: PSTG 估值动力源于其从存储商向“AI 算力加速器”的叙事重构。上行核心在于 DirectFlash 技术对 GPU 投资回报率的优化,以及 Gavin Baker 的重仓背书与 Meta 合作的加速预期。下行风险在于其超过 180 倍的 P/E 估值对业绩容错率为零,且面临基建高峰后的需求真空,以及 NAND 成本压力对仅 3.7% 净利润的潜在侵蚀。
#Seedance2 #MemoryStorageSupercycle #MU #Samsung #PSTG #DRAM #HBM4
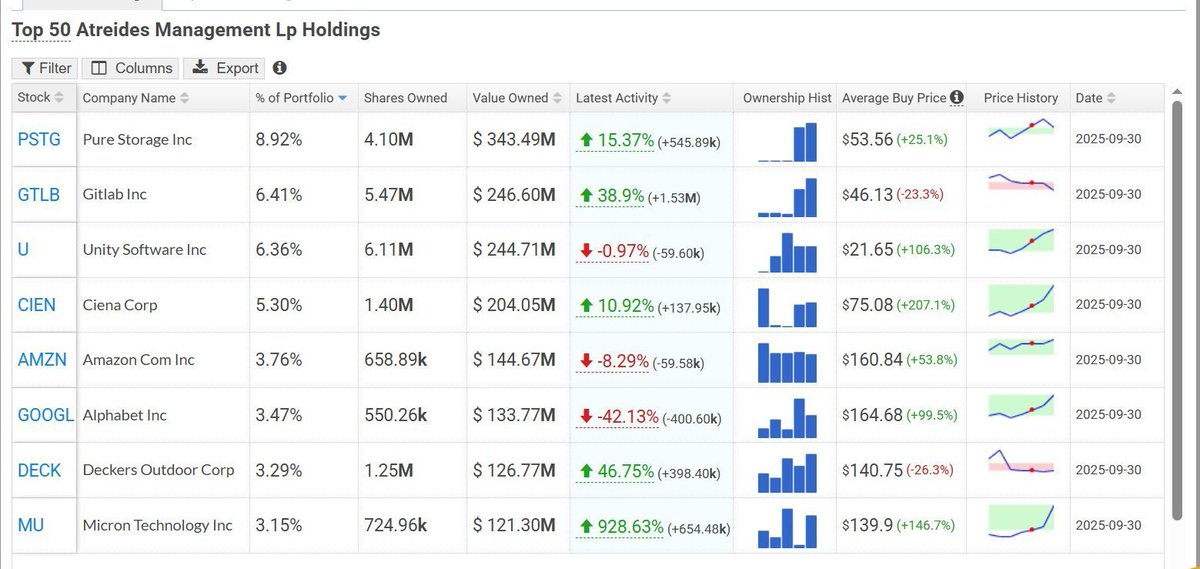

Gavin Baker ( who publicly announced in Jan'25 that his best business bet for 2025 was High Bandwidth Memory stocks like Micron, SK Hynix etc. )
According to his latest 13F filing, Pure Storage $PSTG is his #1 holding and is three times larger than Micron $MU
What does he know that everyone else is missing?
3
281

Feb 10
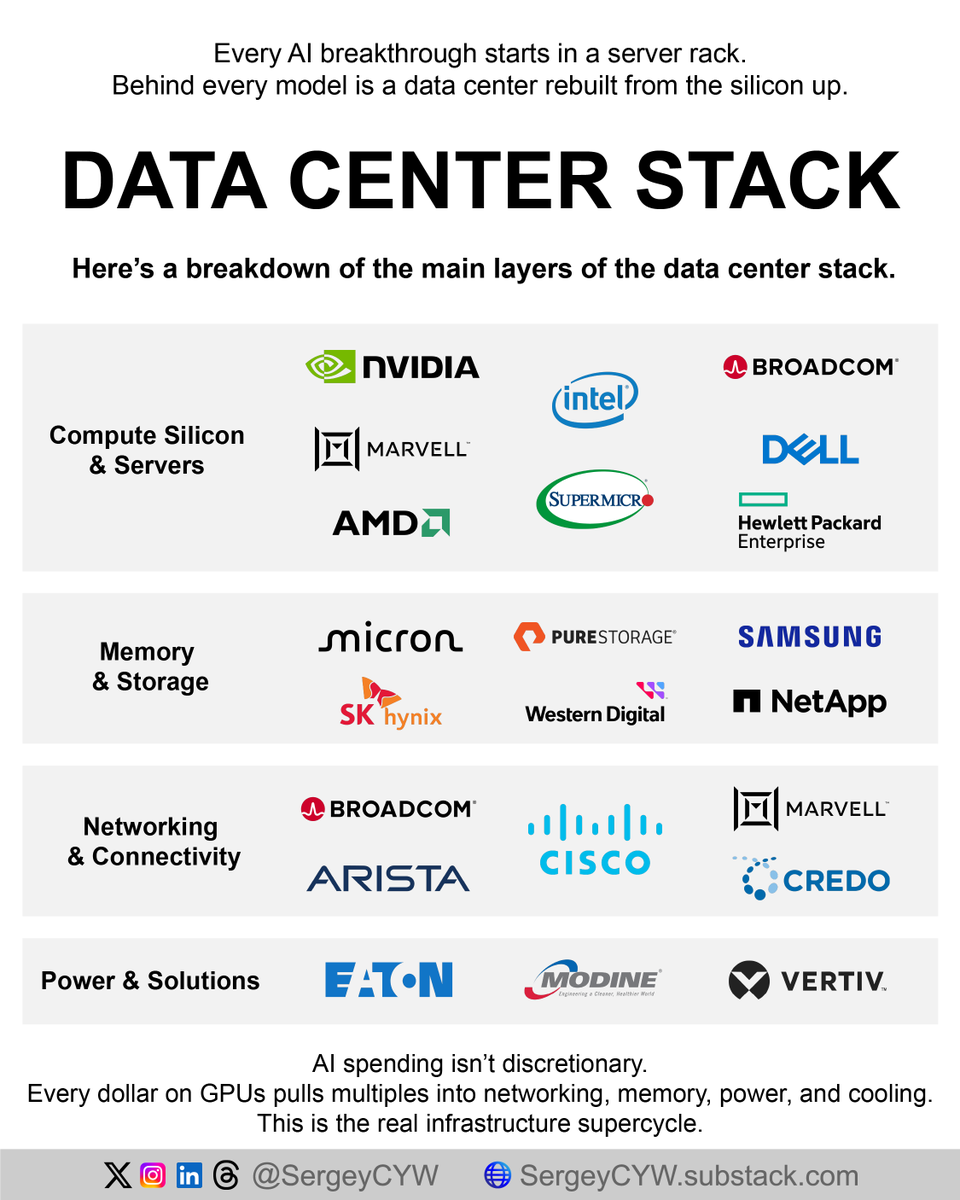
AI DATA CENTER STACK — this is a systems build, not a chip cycle 👇
COMPUTE & SERVERS:
$NVDA Owns accelerated compute end to end. CUDA locks software, NVLink locks topology. Sells architectures, not chips. Switching costs scale with clusters.
$AMD Pressure valve for hyperscalers. MI accelerators plus ROCm enable second sourcing and price leverage. Mandatory option in mission-critical AI stacks.
$INTC Turnaround optionality. Gaudi targets inference economics. IDM model adds supply security as geopolitics matter more than peak performance.
$AVGO Arms dealer to AI. Custom ASICs plus networking silicon. SerDes IP is the moat. Wins whether customers buy Nvidia or replace it.
$MRVL Bandwidth owner. Optical DSPs replace copper as clusters hit 800G and 1.6T. Content per rack rises non-linearly with scale.
$SMCI Speed layer. Modular server design ships new GPU platforms fast. Liquid cooling relevance rises as rack density breaks thermal limits.
$DELL Enterprise bridge. Delivers turnkey AI factories for customers avoiding DIY. Logistics, services, and long contracts drive stickiness.
$HPE Lifecycle play. GreenLake shifts AI from CapEx shock to OpEx flow. Juniper adds traffic control, not just compute.
MEMORY & STORAGE:
$MU Power-efficient HBM matters. Lower watts per bit increase rack density. U.S. supply adds strategic value beyond pricing cycles.
SK Hynix - HBM king. Packaging and logic integration define the edge. Controls the memory closest to GPUs. Pure AI training leverage.
Samsung - Swing producer. Scale fixes shortages once yields stabilize. Only player spanning memory, foundry, and packaging.
$WDC Data lake owner. HDD density feeds training pipelines before data hits HBM. Quietly lowers cloud TCO at scale.
$PSTG Inference storage winner. DirectFlash improves efficiency versus SSDs. Power efficiency becomes the moat as energy caps tighten.
$NTAP Data gravity solver. ONTAP moves datasets across cloud and on-prem. RAG workloads favor data mobility over raw speed.
NETWORKING & CONNECTIVITY:
$ANET Ethernet wins AI. Single OS controls massive switch fabrics. Preferred for backend training once clusters exceed manual management.
$CSCO Installed-base monetization. Silicon One sells inside rivals’ boxes. Optics exposure offsets slower switching growth.
$CRDO Rack-density enabler. Active electrical cables beat thick copper. Better airflow, lower power, higher packing density.
POWER & COOLING:
$VRT Rack survival layer. Liquid-to-chip cooling makes 100kW racks viable. Co-designed into next-gen GPU platforms.
$ETN Grid-to-rack monopoly. Switchgear and transformers are unavoidable. AI scales only as fast as electrons arrive.
$MOD Facility retrofit play. Upgrades legacy data centers for new thermal realities. Expands usable AI capacity globally.
4
26
100
6,847
Feb 9
2.9 美股日记 - Memory Supercycle 结束了吗?
一、宏观盘前指引
2/9 美股盘前处在典型“数据真空期”的震荡窗口:10Y 美债收益率约 4.22% 仍在区间内磨顶,黄金在 $5,020 高位震荡偏强,BTC 回到 $68k 更像是去杠杆后的均值回归而非“数字黄金”叙事重建。真正的方向被压缩到本周:受此前政府部分停摆影响,1 月 NFP 与 CPI 被历史性挤压至周三/周五集中发布,短线盘前波动更多是为两次宏观冲击预留仓位与波动预算,今日关注点在美联储官员表态对“缩表节奏与实际利率路径”的边际指引。
盘前异动主要围绕两条线:其一,AI 硬件反弹与估值修正并存(NVDA 上周五大涨后盘前小幅回吐、MU 因 HBM4 预期调整走弱),反映市场对“AI 军备竞赛等于确定性利润”的定价仍在摇摆;其二,监管重塑减肥药赛道(HIMS 受 FDA 强硬表态冲击、资金回流至 NVO 等合规头部)。
风格上,“Great Rotation”特征延续:资金从拥挤的 Mag7 抽离,推升道指史无前例突破 50,000 点,估值中枢向具备“物理护城河”的实体价值股(如 DOW、FDX、WMT)迁移。投资者的审美从“谁在造 AI”转向“谁在用 AI 赚钱”,高盛(GS)与卡特彼勒(CAT)等老牌巨头通过 AI 优化效率、重塑利润率上限,正将原本的“估值封顶资产”转化为“可成长资产”。这不仅是 AI 逻辑向实体的沉降,更是对“代码贬值”时代下实体资产价值的一次集体重新定价。
二、美股观察
1、赛道背景 - Memory Supercycle 讨论
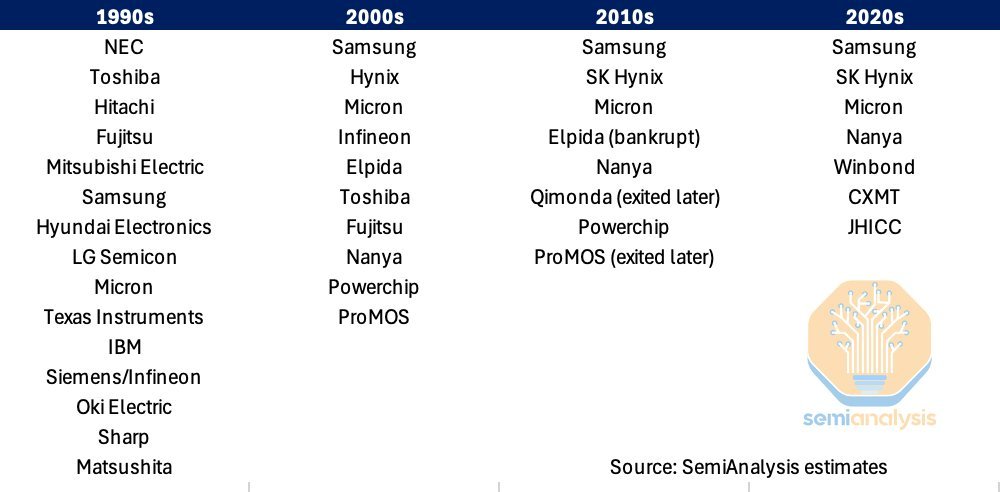
SemiAnalysis(newsletter.semianalysis.com/…)用周期经济学而非单纯“AI 需求叙事”解释本轮存储行情,其核心在于:内存供给是一种高度“惯性化”的供给体系,而需求却呈现非线性跳变。
本轮与 1993(Windows PC)、2010(智能机 云)、2017–18(服务器 NAND)等周期的相似之处在于:单位系统内存含量出现“阶跃式提升”;但不同之处在于,AI 加速卡将 DRAM / HBM 的“每系统内存强度”推入非线性区间,同时供给端又遭遇 DRAM 缩放墙 HBM 封装/测试/认证瓶颈的多重锁死。结果是:供需缺口不是像历史周期那样快速收敛,而是在更长时间内维持紧平衡甚至恶化。
所以长期的供需缺口形成了储存赛道的“超级周期”,但需要注意的是,超级周期并不等于价格线性上行,期间价格仍然存在多次深度回撤。
2、核心博弈:未来 2-3 年的收入是否已被“Price In”
(1)看涨逻辑
目前的定价模型大多基于“商品逻辑”,尚未计入“战略溢价”与“事后结算权利”。最新的合同异动表明,存储厂已开始签署包含“价格追偿条款”的订单,这意味着即便产能已售罄至 2027 年,其 ASP(平均售价)仍具备向上弹性。若 2027 年 HBM4 带来的“定制化价值”推高毛利率至 65% 以上(目前市场普遍预期为 50-55%),且政府补贴(如日本政府对美光的 $3.3B 资助)显著降低了 Capex 压力,那么美光等巨头的自由现金流(FCF)增速将远超目前的折现模型定价。
更重要的是,当前售罄主要集中在 HBM3E,而 2026–2027 年将进入 HBM4 与 GPU 深度堆叠的定制阶段,内存将不再是简单的“bit 出货”,而是高度定制化的系统级组件,毛利率与议价能力有可能脱离传统 memory 周期框架。
(2)看跌逻辑
当利润在短期内爆发时,P/E 看起来极低,但 P/S 往往已接近或突破历史极值,这意味着市场已经用“峰值收入”在折现未来。如果未来两年更多是履约交付而非超预期涨价,股价反而可能因“确定性兑现”而进入估值收缩阶段。
此外,历史 memory supercycle 几乎无一例外都伴随着重复下单的行为:客户在恐慌中锁量,导致需求被提前透支;一旦供给边际改善,库存压力会迅速反噬价格预期。换言之,即便基本面没有立刻恶化,股价也可能大幅下修。
3、策略思考
(1)Timing:什么时候布局更优?
超级周期中的最佳入场点,往往不是在“景气最强、订单最满”的时候,而是在价格/股价因宏观或情绪因素出现与基本面脱钩的回撤阶段。典型触发包括:宏观去杠杆导致高 beta 资产被无差别抛售、市场因“供给即将释放”的早期信号过度反应等。
(2)标的选择
寻找存储上游垄断的节点,例如掌握 HBM 测试、先进封装、关键材料或认证节奏的公司等。
三、Memory Supercycle 储备标的备选 - Pure Storage
Pure Storage 是一家专注于全闪存(All-Flash)数据存储的基础设施公司,其核心竞争力在于 DirectFlash 架构:绕过传统 SSD 控制器,直接管理 NAND,从而显著降低延迟、提升吞吐,并在单位性能下大幅降低功耗。当前数据中心的核心瓶颈已从“算力不足”转向“电力与散热受限”,Pure 旨在解决这一痛点。根据公开讨论与其最新 13F 披露,知名科技投资人 Gavin Baker 已买入 PSTG。
从数据上看,PSTG 正处在“主动牺牲短期利润、换取长期结构性位置”的阶段:FY25 收入约 32 亿美元、同比增长 ~12%,明显快于传统企业级存储行业;订阅 ARR 约 18% 增长、净留存率 117%,说明客户扩容与黏性仍然健康。毛利阶段性下滑并非竞争失速,而是公司在 E-family 产品线上主动吸收 NAND 成本、用价格与 TCO 优势替代机械硬盘,这是一次典型的“disk replacement land-grab”。更关键的是 hyperscaler 线索:Pure 已在 Meta 等超大规模客户中完成设计验证,未来采用软件授权 支持服务而非重资产卖硬件的模式,一旦进入 exabyte 级部署,其边际利润结构将明显优于传统存储厂商。
交易思考:目前 PTSG 并未进入 Memory Supercycle 的主线交易逻辑,但 Pure 有机会成为 AI 数据中心的低功耗数据层标准。鉴于目前 FCF 倍数较高,且 2 月 9 日正值宏观“数据压缩周”前的真空期,追高性价比极低;可等待科技股整体回撤期间建仓。
#MemorySupercycle #MU #SNDK #PSTG #Samsung #SKhynix
3
193


Feb 1
Storage accounts for roughly 5-6% of total data center power consumption. Compute (GPUs) dominates at 40-60%, cooling takes 15-40%. Which is the point, $PSTG Pure's DirectFlash architecture delivers up to 85% less energy per TB than competing all-flash arrays, turning that 5-6% into a near-rounding error. As AI racks push 100kW , every watt saved on storage is a watt freed for compute.
1
5
587